Abstract
In the absence of specialized immune cells, the need for plants to reprogram transcription to transition from growth-related activities to defence is well understood1, 2. However, little is known about translational changes that occur during immune induction. Using ribosome footprinting (RF), we performed global translatome profiling on Arabidopsis exposed to the microbe-associated molecular pattern (MAMP) elf18. We found that during this pattern-triggered immunity (PTI), translation was tightly regulated and poorly correlated with transcription. Identification of genes with altered translational efficiency (TE) led to the discovery of novel regulators of this immune response. Further investigation of these genes showed that mRNA sequence features are major determinants of the observed TE changes. In the 5′ leader sequences of transcripts with increased TE, we found a highly enriched mRNA consensus sequence, R-motif, consisting of mostly purines. We showed that R-motif regulates translation in response to PTI induction through interaction with poly(A)-binding proteins. Therefore, this study provides not only strong evidence, but also a molecular mechanism for global translational reprogramming during PTI in plants.
Upon pathogen challenge, the first line of defence in plants involves recognition of microbe-associated molecular patterns (MAMPs) by the pattern-recognition receptors (PRRs), such as the Arabidopsis EFR for the bacterial translation elongation factor EF-Tu (epitope elf18)3. Activation of PRRs results in pattern-triggered immunity (PTI) characterized by a series of cellular changes, including MAPK activation, ethylene biosynthesis, defence gene transcription, and enhanced resistance to pathogens4. PTI-associated transcriptional changes have been studied extensively. However, our previous report showed that in addition to transcriptional control, translation of a key immune transcription factor (TF), TBF1, is rapidly induced during defence responses1. TBF1 translation is regulated by two upstream open reading frames (uORFs). The inhibitory effect of the uORFs on translation of the downstream major ORF (mORF) of TBF1 was rapidly alleviated upon immune induction. Similar to TBF1, translation of the Caenorhabditis elegans immune TF, ZIP-2, is regulated by 3 uORFs5, suggesting that de-repressing translation of pre-existing mRNAs of key immune TFs may be a common strategy for rapid response to pathogen challenge.
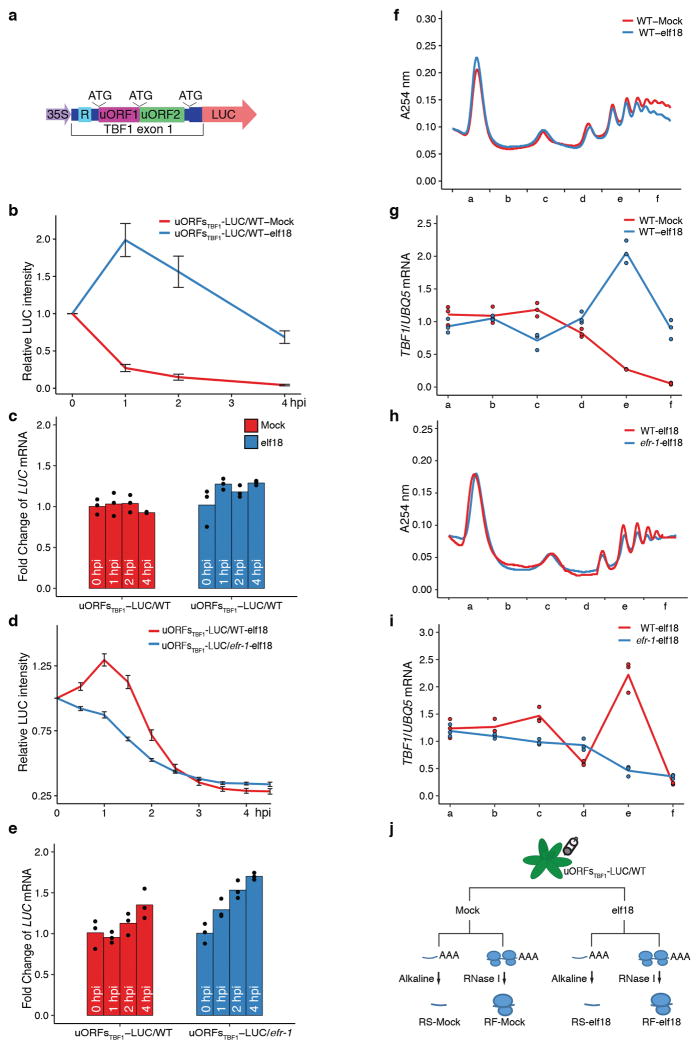
To monitor translational changes during immune responses, we generated an Arabidopsis transgenic line carrying the 35S:uORFsTBF1-LUC reporter (Extended Data Fig. 1a), whose translation, but not transcription, was induced by elf18 one hour post infiltration (hpi) in an EFR6-dependent manner (Extended Data Fig. 1b–e). Consistent with the reporter study, polysome profiling showed that in the absence of overall translational activity changes, the endogenous TBF1 mRNA had a significant increase in association with the polysomal fractions after elf18 treatment in wild type (WT), but not in the efr-1 mutant (Extended Data Fig. 1f–i). Using conditions optimized with the 35S:uORFsTBF1-LUC reporter, we collected leaves treated with either Mock or elf18 to generate libraries for ribosome footprinting-seq (RF-Mock vs RF-elf18) and RNA-seq (RS-Mock vs RS-elf18) (Extended Data Figs. 1j, 2, 3). Translational efficiency (TE) of mRNA was then determined by counting of mRNA fragments captured by the ribosome through sequencing (Ribo-seq) versus measuring available mRNA using RNA-seq (Extended Data Fig. 4a–c). This strategy has previously been applied to study plant translational responses to light, hypoxia, drought, ethylene and heat stress7–11.
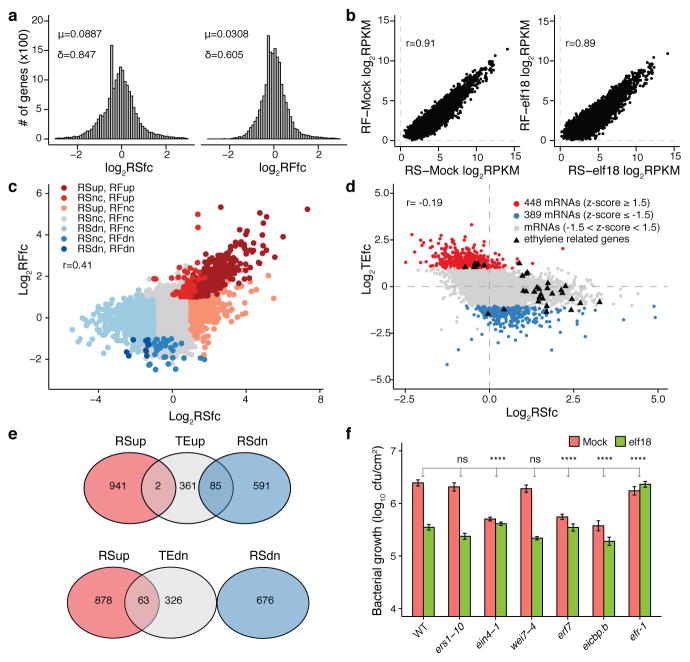
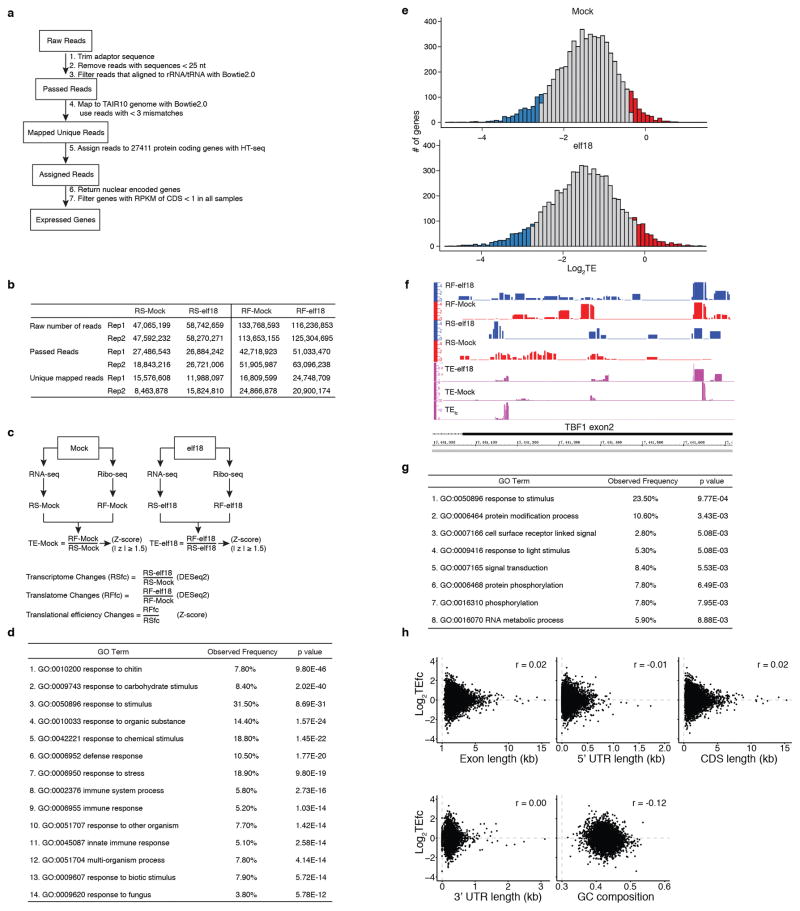
We found that upon elf18 treatment, 943 and 676 genes were transcriptionally induced (RSup) and repressed (RSdn), respectively, based on differential analysis of fold change in the transcriptome (RSfc; Supplementary Table 1). Gene Ontology (GO) terms enriched for RSup genes included defence responses (Extended Data Fig. 4d). In parallel, differential analysis of fold change in the translatome (RFfc) discovered 523 genes with increased translation (RFup) and 43 genes showing decreased translation (RFdn) (Supplementary Table 1). The range of RFfc (0.177 to 40.5) was much narrower than that of the RSfc (0.0232 to 160), suggesting that translation is more tightly regulated than transcription during PTI (p-value = 3.22E-83; Fig. 1a). We then calculated TE values according to a previously reported formula12 (Extended Data Fig. 4c, e, Supplementary Table 2), using the endogenous TBF1 as a positive control by counting reads to exon2 to distinguish reads from the 35S:uORFsTBF1-LUC reporter (Extended Data Fig. 4f).
Figure 1. Identification of novel PTI regulators based on global analysis of elf18-mediated changes in translational efficiency.
a, Histogram of log2RSfc and log2RFfc. RS, RNA-seq; RF, ribosomal footprinting; fc, fold change; μ, mean; δ, standard derivation. b, Pearson correlation coefficient r between RS and RF. c, d, Relationships between RSfc and RFfc (c) and between RSfc and TEfc (d). dn, down; nc, no change. e, Venn diagrams of RSfc and TEfc. f, elf18-induced resistance to Psm ES4326. Mean ± s.e.m. (n = 12 biological replicates from 2 experiments). See Extended Data Figs. 4, 5.
In contrast to the strong correlation between levels of transcription and translation observed within the same sample (Fig. 1b), the fold-changes (elf18/Mock) in transcription and translation were poorly correlated (r = 0.41; Fig. 1c), indicating that induction of PTI involves a significant shift in global TE. Among those mRNAs with TE changes, 448 had increased TEfc (TE fold change; GO analysis in Extended Data Fig. 4g) and 389 genes displayed decreased TEfc (|z| ≥ 1.5) (Supplementary Table 1). Little correlation was found between TE changes and mRNA abundance (r = −0.19; Fig. 1d, e), length or GC composition (Extended Data Fig. 4h). Thus, both transcription and TE are involved in controlling protein production during PTI and mRNA abundance is not the sole determinant of TE.
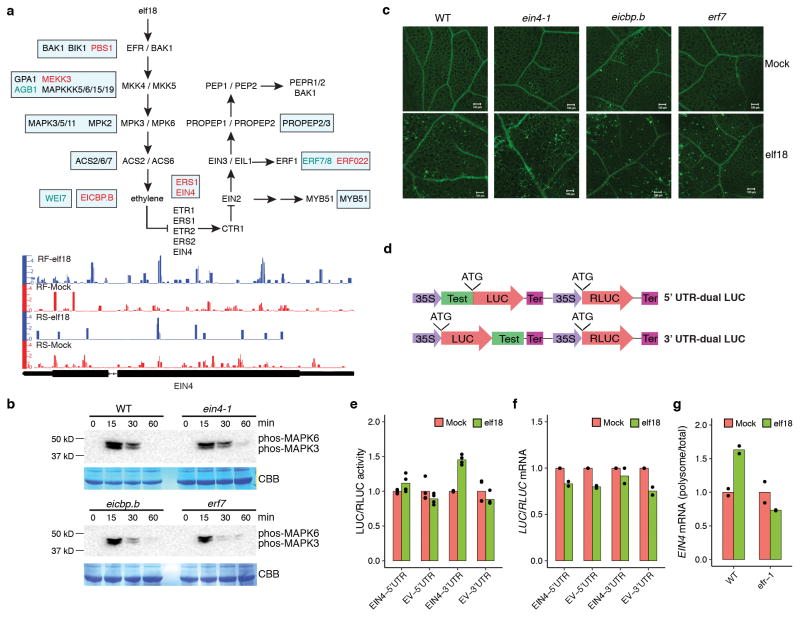
Among the genes with TE changes, we found either a known component or a homologue of a known component of nearly every step of the ethylene- and the damage-associated molecular pattern Pep-mediated PTI signalling pathways13 (Extended Data Fig. 5a, Supplementary Table 3). To demonstrate that TE measurement is an effective method of uncovering new genes involved in the elf18 signalling pathway, we tested mutants of five TE-altered genes for elf18-induced resistance against Pseudomonas syringae pv. maculicola ES4326 (Psm ES4326). We found that ers1-10 and wei7-4 showed WT responsiveness to elf18, whereas ein4-1, erf7, and eicbp.b displayed insensitivity to elf18-induced resistance (Fig. 1f), but not MAPK3/6 activity or callose deposition (Extended Data Fig. 5b, c). Using a dual-luciferase system, we found that the 3′ UTR of EIN4 was responsible for elf18-induced translational activity increase through the elf18 receptor, EFR (Extended Data Fig. 5d–g). The discovery of EIN4, ERF7 and EICBP.B as new PTI components based on their TE changes underscores the utility of this approach.
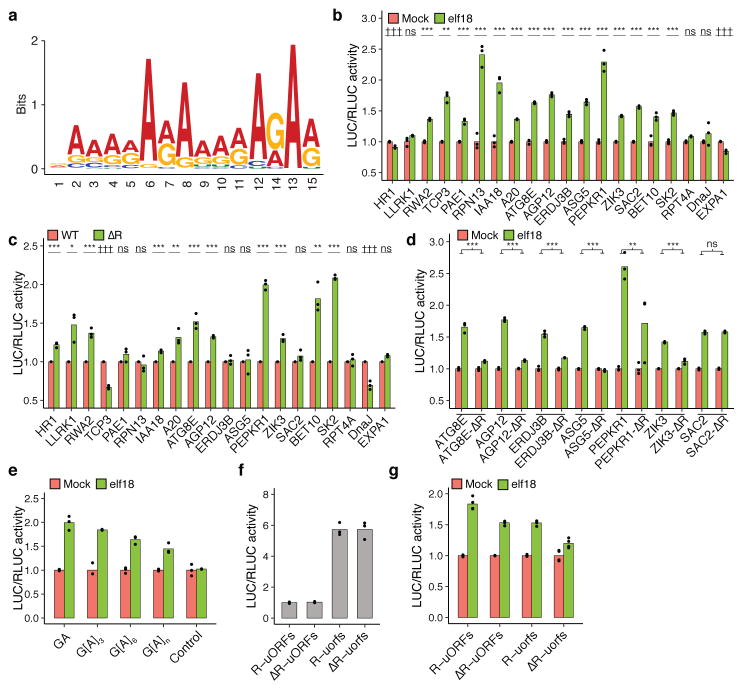
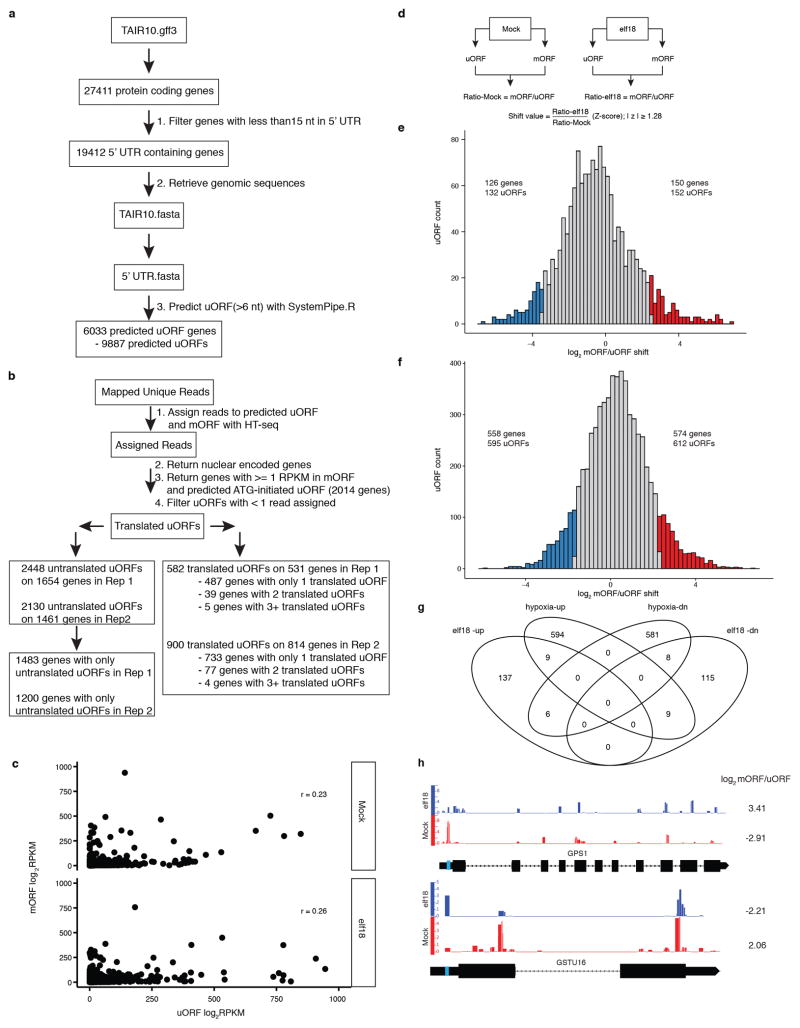
To determine the potential mechanisms governing PTI-specific translation, we searched transcripts with elf18-triggered TE changes for uORFs, which have been associated with genes of different cellular functions in both plants14 and animals15. Detailed description of the analysis and the data are shown in Supplementary Text, Supplementary Table 4 and Extended Data Fig. 6. We also searched for consensus sequences and found one that was significantly enriched in the 5′ leader sequences of TE-up transcripts (38.2%, E-value = 1.2e-141; Supplementary Table 5) compared to all Arabidopsis transcripts (17.7%) and all translated transcripts in this translatome analysis (24.3%; Supplementary Table 5). Since this element contains almost exclusively purines (Fig. 2a), we named it “R-motif” (IUPAC code).
Figure 2. Effects of R-motif on elf18-induced translation.
a, R-motif consensus. b, Translational responses of 5′ leader sequences from 20 R-motif-containing genes. c, d, Effects of R-motif deletion mutations (ΔR) on basal translation (c) and translational responsiveness to elf18 (d). e, Gain of elf18-responsiveness with GA, G[A]3, G[A]6 and G[A]n repeats. f, g, Contributions of R-motif and uORFs to TBF1 basal translation (f) and translational responsiveness to elf18 (g). Bar with solid circles, mean with individual biological replicates (b–f, n = 3; g, n = 4). See Supplementary Table 6 and Extended Data Fig. 7.
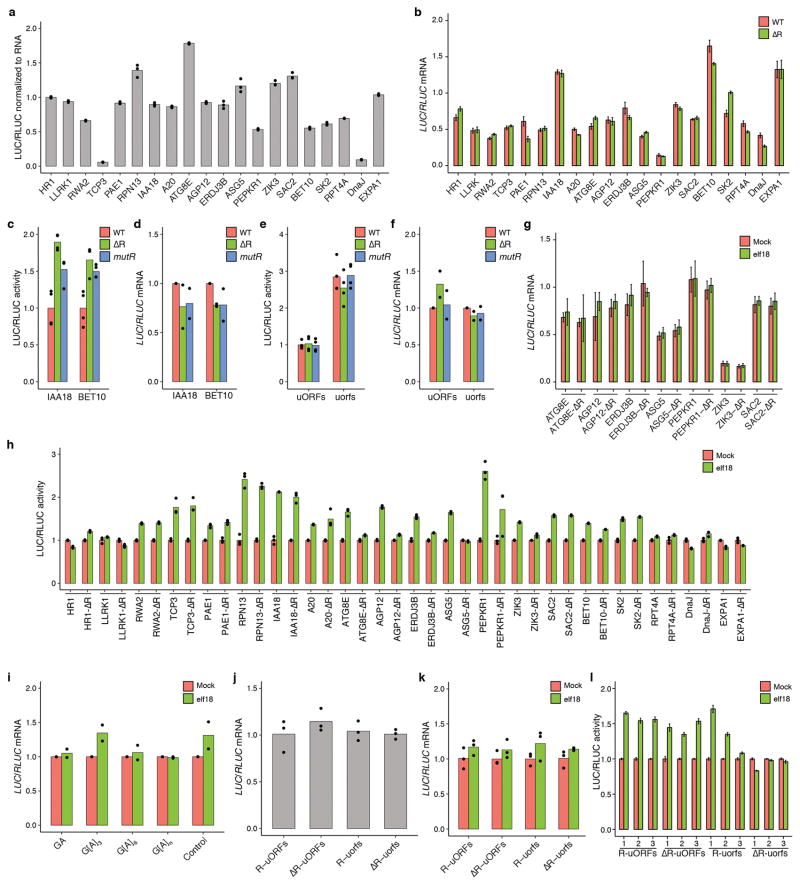
To examine the effect of R-motif on elf18-induced translation, we tested 5′ leader sequences of 20 R-motif-containing TE-up genes using the dual-luciferase system (Extended Data Fig. 5d). Consistent with their known importance in controlling translation16, the different 5′ leader sequences showed distinct basal translational activities (Extended Data Fig. 7a) and elf18-mediated translational activity increase was confirmed in 15 of them (Fig. 2b). We then generated R-motif deletion and multi-base pair substitution mutant reporters and found that 11 of them showed increased while only two displayed decreased translational activity compared to their corresponding WT controls (Fig. 2c, Extended Data Fig. 7b–f). These results suggest a predominantly negative role for R-motif in basal translational activity. We subsequently found six R-motif deletion mutants to have abolished or decreased responsiveness to elf18 induction compared to the controls (Fig. 2d, Extended Data Fig. 7g, h), indicating that releasing R-motif-mediated repression may be an activation mechanism for these genes during PTI. To demonstrate that R-motif is sufficient for responsiveness to elf18, we tested repeats of GA, G[A]3, G[A]6 and mixed G[A]n, which are core sequence patterns found in R-motifs of endogenous genes, and discovered that translation of resulting reporters indeed became responsive to elf18 induction (Fig. 2e, Extended Data Fig. 7i). However, R-motif may have a more complex role in those genes in which deleting R-motif did not affect elf18-mediated translation (Extended Data Fig. 7h). Other mRNA sequence features in these transcripts may influence R-motif activity.
The relationship between R-motif and uORFs was then studied in the TBF1 transcript which contains both features (Extended Data Fig. 1a). Translational activity assessment using the dual-luciferase system showed that deletion of R-motif had no significant effect on basal translation of the reporter, in contrast to the uORFsTBF1 mutant (Fig. 2f, Extended Data Fig. 7j). However, both R-motif and uORFs mutant reporters showed compromised responses to elf18 in transient expression analysis as well as in transgenic plants (Fig. 2g, Extended Data Fig. 7k, l). The effects appeared to be additive, suggesting that R-motif and uORFs control translation through distinct mechanisms.
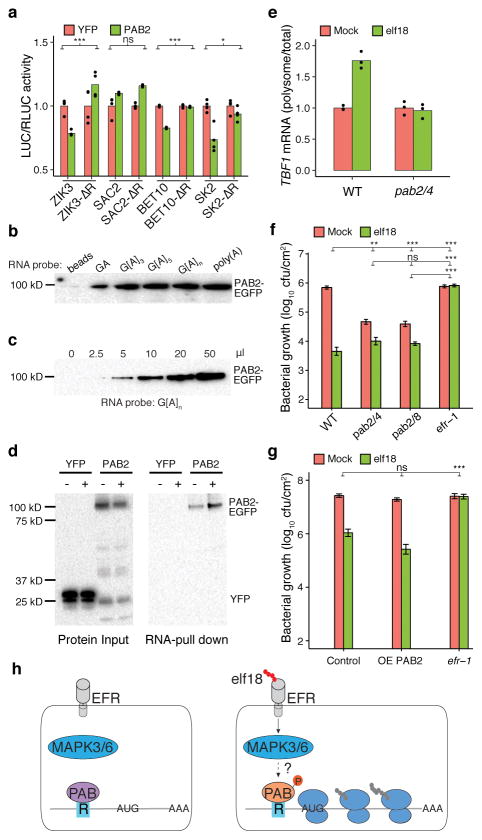
We hypothesized that the mechanism by which R-motif affects translation is likely through association with poly(A)-binding proteins (PABs) because these proteins have been shown to bind to not only poly(A) tails of transcripts to enhance translation, but also A-rich sequences located in their own 5′ leader sequences to inhibit translation17. To test our hypothesis, we examined the role of class II PABs (i.e., PAB2, PAB4 and PAB8)18 by co-expressing PAB2 with three R-motif-dependent genes, ZIK3, BET10, and SK2 and one R-motif-independent gene, SAC2. We found that all three R-motif-dependent genes, but not the control, had lower translational activity when PAB2 was co-expressed, and that this inhibition could be overcome by deleting the R-motif (Fig. 3a, Extended Data Fig. 8a). This PAB2 effect is likely through a direct physical interaction with R-motif, because in an in vitro binding assay, PAB2 displayed comparable affinities to G[A]3, G[A]6 and G[A]n repeats as to poly(A) (Fig. 3b, c). Moreover, plant-synthesized PAB2 could be pulled down using a G[A]n RNA probe (Fig. 3d). Surprisingly, PAB2 from elf18-induced plants appeared to bind the probe more tightly than the mock-treated control, suggesting elf18-triggered derepression was unlikely due to dissociation of PAB2. PAB2 is known to switch its activity through phosphorylation19, which might have occurred upon elf18 treatment.
Figure 3. R-motif controls translation through PAB.
a, Effects of PAB2 on translation of R-motif-containing genes. b–d, R-motif-binding by in vitro (b, c) and in vivo synthesized PAB2 (d). − or +, Mock or elf18-treated plants. e, TBF1 translation in pab2/4 plant. f, g, elf18-induced resistance to Psm ES4326 in pab2/4 and pab2/8 plants (f), and in primary transformants overexpressing PAB2 (OE-PAB2) (g), mean ± s.e.m.. h, Working model. Bar with solid circles, mean with individual biological replicates. See Extended Data Fig. 8, Source Data for sample size (n) and Supplementary Text for gel source data.
We next examined the phenotypes of the pab2/4 and pab2/8 double mutants18. We found that the elf18-triggered increase in polysome-association of the endogenous TBF1 mRNA was compromised in the pab2/4 double mutant (Fig. 3e). The inhibitory effect of elf18 on plant growth was also diminished in the double mutants (Extended Data Fig. 8b). In comparison to WT, the double mutants had significantly elevated basal resistance to Psm ES4326, but reduced resistance to the pathogen after elf18 treatment (Fig. 3f). This insensitivity to elf18 was rescued by transformation of PAB2 (Fig. 3g). These data support our hypothesis that PABs play a negative role in background translation, but a positive role in elf18-induced translation. Whether the activities of PABs are regulated by components of the known PTI signalling pathway, such as MAPK3/6, remains to be tested. Detection of MAPK3/6 activity in the pab2/4 and pab2/8 mutants (Extended Data Fig. 8c), suggests that PABs could function downstream of MAPK3/6, possibly as substrates (Fig. 3h).
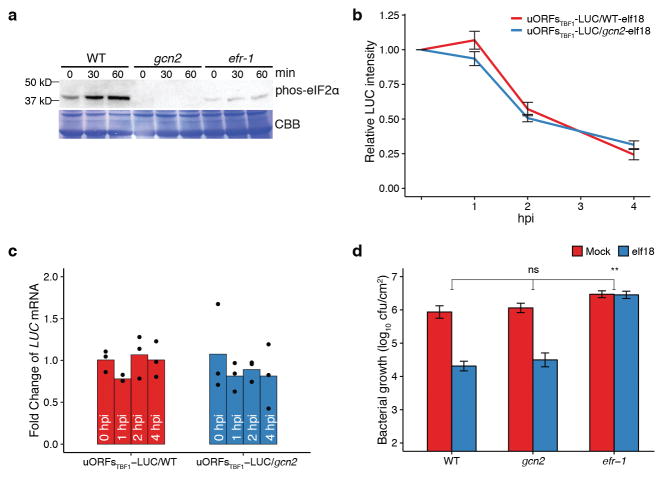
Immune-related translation has not been well studied in any organism. In this study, we found that the inhibitory effects of uORFs and R-motif on PTI-associated genes are rapidly alleviated upon immune induction in Arabidopsis. In yeast, uORF inhibition on GCN4 translation is removed during amino acid starvation through GCN2-mediated phosphorylation of the translation initiation factor eIF2α20. Surprisingly, GCN2-mediated eIF2α phosphorylation is not required for elf18-induced TBF1 translation or resistance (Extended Data Fig. 9), suggesting an alternative mechanism in immune-induced translational reprogramming in plants. Further investigation will also be required to dissect the regulatory mechanisms of R-motifs and understand the roles of PABs in different translation mechanisms21. Intriguingly, R-motif is also prevalent in mRNAs from other organisms (Supplementary Table 5), including the human p53 mRNA, suggesting a conserved regulatory mechanism may be shared across species.
Methods
Plasmids
To construct the 35S:uORFsTBF1-LUC reporter, the 35S promoter and the TBF1 exon1 (including the R-motif, uORF1-uORF2, and the coding sequence of the first 73 amino acids of TBF1) were amplified from p35S:uORF1-uORF2-GUS1 using Reporter-F/R primers, and ligated into pGWB23522 via Gateway recombination. The 35S:ccdB cassette-LUC-NOS construct was generated by fusing PCR fragments of the 35S promoter from pMDC14023, the ccdB cassette and the NOS terminator from pRNAi-LIC24 and LUC from pGWB23522. The 35S:ccdB cassette-LUC-NOS was then inserted into pCAMBIA1300 via PstI and EcoRI and designated as pGX301 for cloning 5′ leader sequences through replacement of the ApaI-flanked ccdB cassette24. Similarly, the 35S:RLUC-HA-rbs terminator construct was made through fusion of PCR fragments of 35S from pMDC14023, RLUC from pmirGLO (Promega, E1330) and rbs terminator from pCRG330125. The 35S:RLUC-HA-rbs fragment flanked with EcoRI was inserted into pTZ-57rt (Thermo fisher, K1213) via TA cloning to generate pGX125. 5′ leader sequences were amplified from the Arabidopsis (Col-0) genomic DNA or synthesized by Bio Basics (New York, USA) and inserted into pGX301 followed by transferring 35S:RLUC-HA-rbs from pGX125 via EcoRI. EFR, PAB2, PAB4 and PAB8 were amplified from U21686, C104970, U10212 and U15101 (from ABRC), respectively, and fused with the N-terminus of EGFP by PCR. Fusion fragments were then inserted between the 35S promoter and the rbs terminator to generate 35S:EFR-EGFP (pGX664), 35S:EFR (pGX665) and 35S:PAB2-EGFP (pGX694). Information on all plasmids and primers in this study can be found in Supplementary Table 6.
Plant growth, transformation, and treatment
Plants were grown on soil (Metro Mix 360) at 22 °C under 12/12-h light/dark cycles with 55% relative humidity. efr-16, ers1-10 (a weak gain-of-function mutant; ERS, ethylene receptor-related gene family member)26, ein4-1 (a gain-of-function mutant; EIN4, ethylene receptor-related gene family member)27, wei7-4 (a loss-of-function mutant; WEI7, involved in ethylene-mediated auxin increase)28, eicbp.b (camta 1–3; SALK_108806; EICBP.B, an ethylene-induced calmodulin-binding protein)29, pab2/418 and pab2/818 were previously described. efr7 (SALK_205018; ERF7, a homologue of the ethylene responsive TF gene ERF1) and gcn2 (GABI_862B02) were from the Arabidopsis Biological Resource Center (ABRC). Transgenic plants were generated using the floral dip method30.
Ribo-seq library construction
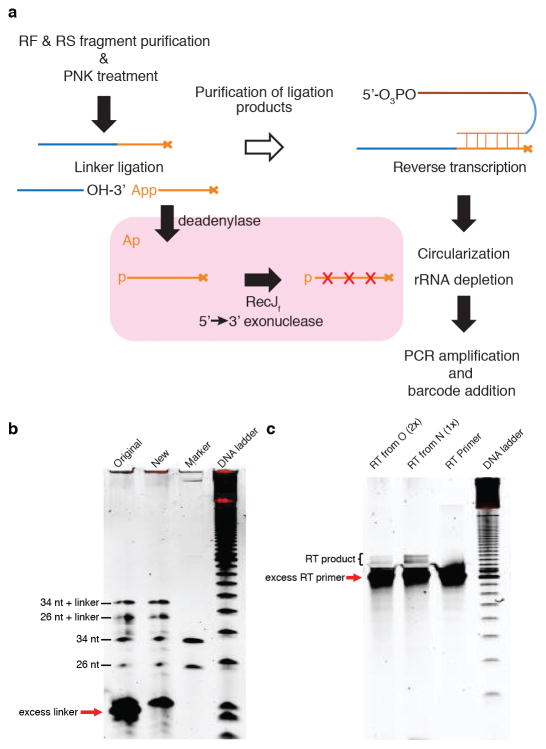
Leaves from ~24 3-week-old plants (2 leaves/plant; ~1.0 g) were collected. Tissue was fast frozen and ground in liquid nitrogen. 5 ml cold polysome extraction buffer [PEB; 200 mM Tris pH 9.0, 200 mM KCl, 35 mM MgCl2, 25 mM EGTA, 5 mM DTT, 1 mM phenylmethanesulfonylfluoride (PMSF), 50 μg/ml cycloheximide, 50 μg/ml chloramphenicol, 1% (v/v) Brij-35, 1% (v/v) Igepal CA630, 1% (v/v) Tween 20, 1% (v/v) Triton X-100, 1% Sodium deoxycholate (DOC), 1% (v/v) polyoxyethylene 10 tridecyl ether (PTE)] was added. After thawing on ice for 10 min, lysate was centrifuged at 4 °C/16,000 g for 2 min. Supernatant was transferred to 40 μm filter falcon tube and centrifuged at 4 °C/7,000 g for 1 min. Supernatant was then transferred into a 2-ml tube and centrifuged at 4 °C/16,000 g for 15 min and this step was repeated once. 0.25 ml lysate was saved for total RNA extraction for making the RNA-seq library. Another 1 ml lysate was layered on top of 0.9 ml sucrose cushion [400 mM Tris·HCl pH 9.0, 200 mM KCl, 35 mM MgCl2, 1.75 M sucrose, 5 mM DTT, 50 μg/ml chloramphenicol, 50 μg/ml cycloheximide] in an ultracentrifuge tube (#349623, Beckman). The samples were then centrifuged at 4 °C/70,000 rpm for 4 h in a TLA100.1 rotor. The pellet was washed twice with cold water, resuspended in 300 μl RNase I digestion buffer [20 mM Tris·HCl pH 7.4, 140 mM KCl, 35 mM MgCl2, 50 μg/ml cycloheximide, 50 μg/ml chloramphenicol]10 and then transferred to a new tube for brief centrifugation. The supernatant was then transferred to another new tube where 10 μl RNase I (100 U/μl) was added before 60 min incubation at 25 °C. 15 μl SUPERase-In (20 U/μl) was then added to stop the reaction. The subsequent steps including ribosome recovery, footprint fragment purification, PNK treatment, and linker ligation were performed as previously reported31. 2.5 μl of 5′ deadenylase (NEB) was then added to the ligation system and incubated at 30 °C for 1 h. 2.5 μl of RecJf exonuclease (NEB) was subsequently added for 1 h incubation at 37 °C. The enzymes were inactivated at 70 °C for 20 min and 10 μl of the samples were taken as template for reverse transcription (Extended Data Fig. 2). The rest of the steps for the library construction were performed as in the reported protocol31, with the exception of using biotinylated oligos, rRNA1 and rRNA2, for Arabidopsis according to another reported method10.
RNA-seq library construction
0.75 ml TRIzol® LS (Ambion) was added to the 0.25 ml lysate saved from the Ribo-seq library construction, from which total RNA was extracted, quantified and qualified using Nanodrop (Thermo Fisher Scientific Inc). 50–75 μg total RNA was used for mRNA purification with Dynabeads® Oligo (dT)25 (Invitrogen). 20 μl of the purified poly (A) mRNA was mixed with 20 μl 2× fragmentation buffer (2 mM EDTA, 10 mM Na2CO3, 90 mM NaHCO3) and incubated for 40 min at 95 °C before cooling on ice. 500 μl of cold water, 1.5 μl of GlycoBlue and 60 μl of cold 3 M sodium acetate were then added to the samples and mixed. Subsequently, 600 μl isopropanol was added before precipitation at −80 °C for at least 30 min. Samples were then centrifuged at 4°C/15,000 g for 30 min to remove all liquid and air dried for 10 min before resuspension in 5 μl of 10 mM Tris pH 8. The rest of the steps were the same as Ribo-seq library preparation with QC data shown in Extended Data Fig. 3.
LUC reporter assay and dual-luciferase assay
To record the 35S:uORFsTBF1-LUC reporter activity, 3-week-old Arabidopsis plants were sprayed with 1 mM luciferin 12 h before infiltration with either 10 μM elf18 (synthesized by GenScript) or 10 mM MgCl2 as Mock. Luciferase activity was recorded in a CCD camera-equipped box (Lightshade Company) with each exposure time of 20 min. For dual-luciferase assay, N. benthamiana plants were grown at 22 °C under 12/12-h light/dark cycles. Dual-luciferase constructs were transformed into the Agrobacterium strain GV3101, which was cultured overnight at 28 °C in LB supplied with kanamycin (50 mg/l), gentamycin (50 mg/l) and rifampicin (25 mg/l). Cells were then spun down at 2,600 g for 5 min, resuspended in infiltration buffer [10 mM 2- (N-morpholino) ethanesulfonic acid (MES), 10 mM MgCl2, 200 μM acetosyringone], adjusted to OD600nm = 0.1, and incubated at room temperature for additional 4 h before infiltration using 1 ml needleless syringes. For elf18 induction, 10 mM MgCl2 (Mock) solution or 10 μM elf18 were infiltrated 20 h after the dual-luciferase construct and EFR-EGFP had been co-infiltrated at the ratio of 1:1, and samples were collected 2 h after treatment. For PAB2-EGFP co-expression assay, Agrobacterium containing a dual-luciferase construct was mixed with Agrobacterium containing the PAB2-EGFP construct at the ratio of 1:5. Leaf discs were collected, ground in liquid nitrogen and lysed with the PLB buffer (Promega, E1910). Lysate was spun down at 15,000 g for 1 min, from which 10 μl was used for measuring LUC and RLUC activity using the Victor3 plate reader (PerkinElmer). At 25 °C, substrates for LUC and RLUC were added using the automatic injector and after 3 s shaking and 3 s delay, the signals were captured for 3 s and recorded as CPS (counts per second).
elf18-induced growth inhibition and resistance to Psm ES4326
For elf18-induced growth inhibition assay, seeds were sterilized in a 2% PPM solution (Plant Cell Technology) at 4 °C for 3 d and sowed on MS media (1/2 MS basal salts, 1% sucrose, and 0.8% agar) with or without 100 nM elf18. 10-day-old seedlings were weighed with 10 seedlings per sample. For elf18-induced resistance to Psm ES4326, 1 μM elf18 or Mock (10 mM MgCl2) was infiltrated into 3-week-old soil-grown plants 1 day prior to Psm ES4326 (OD600nm = 0.001) infection of the same leaf. Bacterial growth was scored 3 days after infection. For elf18-induced resistance to Psm ES4326 in primary transformants overexpressing PAB2 in the pab2/8 mutant (OE-PAB2), transgenic plants expressing YFP in the WT background was used as control and both control and OE-PAB2 were selected for basta-resistance and further confirmed by PCR.
elf18-induced MAPK activation and callose deposition
For MAPK activation, 12-day-old seedlings grown on MS media were flooded with 1 μM elf18 solution and 25 seedlings were collected at indicated time points. Protein was extracted with co-IP buffer [50 mM Tris, pH 7.5, 150 mM NaCl, 0.1% (v/v) Triton X-100, 0.2% (v/v) Nonidet P-40, protease inhibitor cocktail (Roche), phos-stop phosphatase inhibitor cocktail (Roche)]. Antibody information and conditions can be found in Supplementary Table 6. For callose deposition, 3-week-old soil-grown plants were infiltrated with 1 μM elf18. After 20 h of incubation, leaves were collected, decolorized in 100% ethanol with gentle shaking for 4 h and rehydrated in water for 30 min before stained in 0.01% (w/v) aniline blue in 0.01 M K3PO4 pH 12 covered with aluminium foil for 24 h with gentle shaking. Callose deposition was observed with Zeiss-510 inverted confocal using 405 nm laser for excitation and 420–480 nm filter for emission.
RNA-pull down of in vitro and in vivo synthesized PAB proteins
PAB2-EGFP was amplified from pGX694. GA, G[A]3, and G[A]6 were synthesized using Bio Basics (New York, USA) while poly(A) and G[A]n were synthesized by IDT (https://www.idtdna.com/site). The sequences used for in vitro biotin-RNA synthesis can be found in Supplementary Table 6. In vitro transcription and translation were performed using the wheat germ translation system according to the manufacturer’s instructions (BioSieg, Japan). To make biotin-labelled RNA probes, 2 μl of 10 mM biotin-16-UTP (11388908910, Roche) was added into the transcription system. DNase I was then used to remove the DNA template. 0.2 nmol biotin-labelled RNA was conjugated to 50 μl streptavidin magnetic beads (65001, Thermo Fisher) according to the manufacturer’s instruction. In vitro synthesized PAB2-EGFP was incubated with biotin-labelled RNA in the glycerol-co-IP buffer [50 mM Tris, pH 7.5, 150 mM NaCl, 2.5 mM EDTA, 10% (v/v) glycerol, 1 mM PMSF, 20 U/mL Super-In RNase inhibitor, protease inhibitor cocktail (Roche)]. To perform in vivo pull down experiment, PAB2-EGFP was co-expressed with the elf18 receptor EFR (pGX665) for 40 h in N. benthamiana which was then treated with Mock or elf18 for 2 h. Protein was extracted with glycerol-co-IP buffer and used in the pull down assay at 4 °C for 4 h. YFP was expressed as a control. Antibody information and assay conditions can be found in Supplementary Table 6.
Polysome profiling
0.6 g Arabidopsis tissue was ground in liquid nitrogen with 2 ml cold PEB buffer. 1 ml crude lysate was loaded to 10.8 ml 15% – 60% sucrose gradient and centrifuged at 4 °C for 10 h (35,000 rpm, SW 41 Ti rotor). A254 absorbance recording and fractionation were performed as described previously32. Polysomal RNA was isolated by pelleting polysomes and polysomal/total mRNA ratio was calculated as described previously8.
Real-time reverse-transcription polymerase chain reaction (RT-PCR)
~50 mg leaf tissue was used for total RNA extraction using TRIzol following the instruction (Ambion). After DNase I (Ambion) treatment, reverse transcription was performed following the instruction of SuperScript® III Reverse Transcriptase (Invitrogen) using oligo (dT). RT-PCR was done using FastStart Universal SYBR Green Master (Roche). Primer sequences can be found in Supplementary Table 6.
Bioinformatic and statistical analyses
Read processing and statistical methods were conducted following the criteria illuminated in Extended Data Fig. 4. Generally, Bowtie2 was used to align reads to the Arabidopsis TAIR10 genome33. Read assignment was achieved using HT-seq34. Transcriptome and translatome changes were calculated using DESeq235. Transcriptome fold changes (RSfc) for protein-coding genes were determined using reads assigned to exon by gene. Translatome fold changes (RFfc) for protein-coding genes were measured using reads assigned to CDS by gene. TE was calculated by combining reads for all genes that passed RPKM ≥ 1 in CDS threshold in two biological replicates and normalizing Ribo-seq RPKM to RNA-seq RPKM as reported12. The criteria used for uORF prediction are shown in Extended Data Fig. 6 and performed using systemPipeR (https://github.com/tgirke/systemPipeR). The MEME online tool36 was used to search strand-specific 5′ leader sequences for enriched consensuses compared to whole genome 5′ leader sequences with default parameters. Density plot was presented using IGB37. The nucleotide resolution of the coverage around start and stop codons was performed using the 15th nucleotide of 30-nt reads of RF, similar as reported previously10, 38. Whole transcriptome R-motif search was performed using FIMO tool in the MEME suite36. LUC/RLUC ratio was first tested for normal distribution using the Shapiro-Wilk test. Two-sided student’s t-test was used for comparison between two samples. Two-sided one-way ANOVA or two-way ANOVA was used for more than two samples and Tukey test was used for multiple comparisons. GraphPad Prism 6 was used for all the statistical analyses. Unless specifically stated, sample size n means biological replicate and experiment has been performed three times with similar results. *P < 0.05, **P < 0.01, ***P < 0.001, and ****P < 0.0001 indicate significant increases; ns, no significance; †††P < 0.001 indicates a significant decrease.
Data availability
The authors declare that the main data supporting the findings of this study are available within the article and its Source Data files. Extra data are available from the corresponding author upon request. The RS and RF data presented in this publication have been deposited in NCBI’s Gene Expression Omnibus (GSE86581).
Extended Data
Extended Data Figure 1. Translational activities during elf18-induced PTI.
a, Schematic of the 35S:uORFsTBF1-LUC reporter, which is a fusion between the TBF1 exon1 (uORF1/2 and sequence of the N-terminal 73 amino acids) and the firefly luciferase gene (LUC) expressed constitutively by the CaMV 35S promoter. R, R-motif. b–e, Translation (b, d) and transcript levels (c, e) of the 35S:uORFsTBF1-LUC reporter in wild type (WT) after Mock or elf18 treatment (b, c) or in WT and efr-1 upon elf18 treatment (d, e). LUC activity, mean ± s.e.m. (b, n = 12; d, n = 9) after normalization to time 0; Transcript levels, mean of fold changes normalized to time 0 with individual biological replicates shown as solid circles (n = 3). hpi, hours post infiltration. f–i, Polysome profiling of global translational activity (f, h) and TBF1 mRNA translational activity calculated as ratios of polysomal/total mRNA (g, i) in WT after Mock or elf18 treatment (f, g) or in WT and efr-1 upon elf18 treatment (h, i). Lower case letters indicate polysomal fractions in polysome profiling indicated by sucrose gradient absorbance (A254). Expression levels of TBF1 were normalized against UBQ5 level determined by RT-PCR in total mRNA and in polysomal fractions respectively. Data are shown as the relative TBF1 mRNA level in polysomal fractions after normalization to total TBF1 mRNA level. Bar with solid circles, mean with individual biological replicates (n = 3). j, Schematic of RS and RF library construction using uORFsTBF1-LUC/WT plants. RS, RNA-seq; RF, ribosome footprint. RNase I and Alkaline are two methods of generating RNA fragments.
Extended Data Figure 2. Improvement made in the library construction protocol.
a, Addition of 5′ deadenylase and RecJf to remove excess 5′ pre-adenylylated linker. mRNA fragments of RS and RF were size-selected and dephosphorylated by PNK treatment, followed by 5′ pre-adenylylated linker ligation. The original method used gel purification to remove the excess linker. In the new method (pink background), 5′ deadenylase was used to remove pre-adenylylated group (Ap) from the unligated linker allowing cleavage by RecJf. The resulting sample could then be used directly for reverse transcription. b, The original (Original) and new (New) methods to remove excess linker were compared. 26 and 34 nt synthetic RNA markers were used for linker ligation. RNA markers without the linker were used as controls. Arrow indicates the excess linkers. DNA ladder, 10-bp. c, Reverse transcription (RT) showed the improvement of the new method over the original one. Half of the ligation mixture (O) was gel purified to remove excess linkers before RT (loaded 2x). The other half (N) was treated with 5′ deadenylase and RecJf, and directly used as template for RT (loaded 1x). RT primers were loaded as control. Arrow indicates excess RT primers.
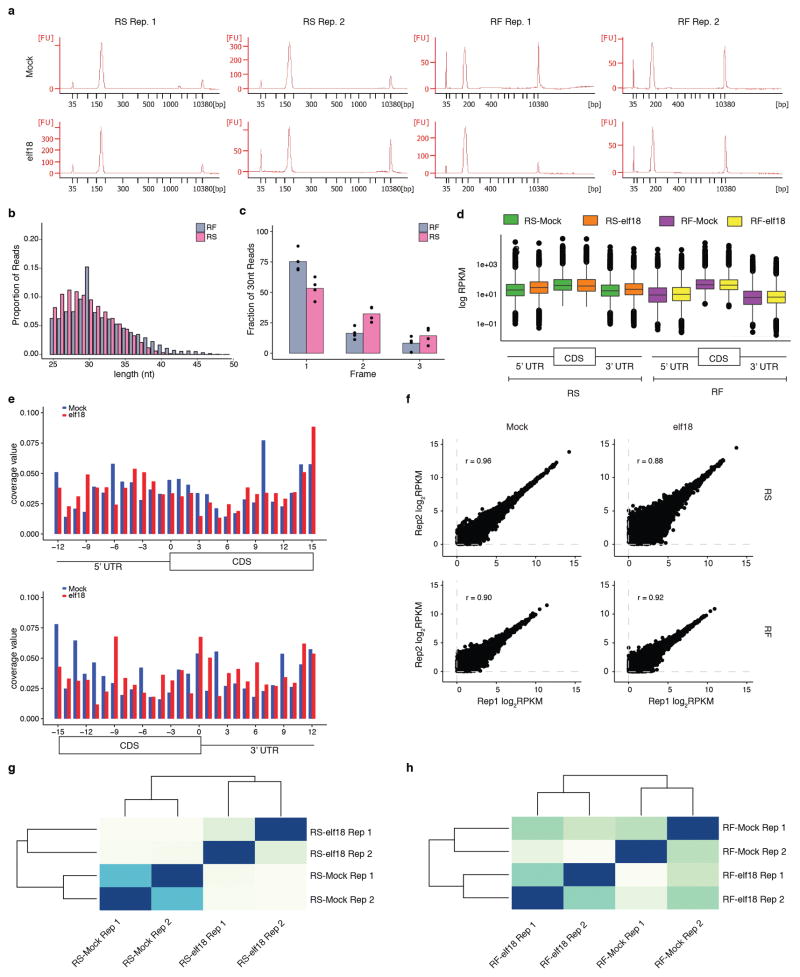
Extended Data Figure 3. Quality and reproducibility of RS and RF libraries, related to Fig. 1.
a, BioAnalyzer profile showed high quality of RS and RF libraries. In addition to internal standards (35 bp and 10380 bp), a single ~170 bp peak is present for RS and RF libraries for Mock and elf18 treatments with both biological replicates (Rep1/2). b, Length distribution of total reads from 4 RS and 4 RF libraries. c, Fraction of 30 nt reads in total reads from 4 RS and 4 RF libraries. Bar with solid circles, mean with individual biological replicates (n = 4) of percentage of reads with 5′ aligning to A (frame1), U (frame2) and G (frame3) of the initiation codon. d, Read density along 5′UTR, CDS and 3′ UTR of total reads from 4 RS and 4 RF libraries. Expressed genes with RPKM in CDS ≥ 1 and length of UTR ≥ 1 nt were used for box plots. The top, middle and bottom line of the box indicate the 25, 50, and 75 percentiles, respectively. Filled circles represent RPKM values for individual outlier genes. e, Nucleotide resolution of the coverage around start and stop codons using the 15th nucleotide of 30-nt reads of RF. Reads in 3′ UTR may be due to digestion conditions that might favour the capture of ribosomes in different conformations associated with UTRs as previously observed10 and explained38. f, Correlation between two replicates (Rep1/2) of RS and RF samples. Data are shown as the correlation of log2RPKM in CDS for expressed genes with RPKM in CDS ≥ 1. Pearson correlation coefficient r is shown. g, h, Hierarchical clustering showing the reproducibility between RS (g) and RF (h) within two replicates (Rep1/2). Darker colour means greater correlation.
Extended Data Figure 4. Global analyses of transcriptome, translatome and translational efficiency (TE) upon elf18 treatment, related to Fig. 1.
a, Flowchart for read processing and assignment. b, Reads after each processing. c, Statistical methods and criteria for transcriptome (RSfc), translatome (RFfc) and TE changes (TEfc) analyses. d, GO term enrichment analysis for RS up-regulated genes. e, Normal distribution of log2TE for Mock and elf18 treatment. f, TE changes in the endogenous TBF1 gene. Read coverage was normalized to uniquely mapped reads with IGB. TEs for the TBF1 exon 2 in Mock and elf18 treatments were determined to calculate TEfc. g, GO term enrichment found in TEup genes in response to elf18 treatment. z-score ≥ 1.5 was used. h, Correlation between TEfc and exon length, 5′ UTR length, 3′ UTR length and GC composition.
Extended Data Figure 5. Characterization of novel PTI regulators, related to Fig. 1f.
a, RS and TE changes in known or homologues of known components of the ethylene- and the damage-associated molecular pattern Pep-mediated PTI signalling pathways (upper panel) and normalized distribution of RNA-seq and Ribo-seq reads of one example (i.e., EIN4; lower panel). The pathway was modified from Zipfel13. In rectangular boxes: Black, RS-changed; Red, TEup; blue, TEdn. b, MAPK activation. 12-day-old ein4-1, eicbp.b and erf7 seedlings were treated with 1 μM elf18 solution and collected at indicated time points for immunoblot analysis using the phosphospecific antibody against MAPK3 and MAPK6. See Supplementary Text for gel source data. c, Callose deposition. 3-week-old plants were infiltrated with 1 μM elf18 or Mock. Leaves were stained 20 h later in aniline blue followed by confocal microscopy. Representative of 5 images. Scale bar, 100 μm. d, Schematic of the dual-LUC system. Test, 5′ leader sequence (including UTR) or 3′ UTR of the gene tested; LUC, firefly luciferase; RLUC, renilla luciferase, Ter, terminator. e, Dual-LUC assay of EIN4 UTRs on translational activity upon elf18 treatment in N. benthamiana (n = 4). f, Effects of EIN4 UTRs on ratios of LUC/RLUC mRNA upon elf18 treatment (2 experiments with 3 technical replicates). EV, empty vector. g, EIN4 translational activity upon elf18 treatment calculated as ratios of polysomal/total mRNA (2 experiments with 3 technical replicates). Bar with solid circles, mean with individual biological replicates.
Extended Data Figure 6. uORF-mediated translational control.
a, b, Flowcharts of steps used to identify predicted (a) and translated (b) uORFs. c, Read density of uORF and mORF. For those genes with reads assigning to uORF and with RPKM in its mORF ≥ 1, log2RPKMs for individual uORFs and mORFs are plotted for Mock and elf18 treatment, respectively. r, Pearson correlation coefficient. d, Definition of mORF/uORF ratio shift between Mock and elf18 treatments. e, Histogram of mORF/uORF shift upon elf18 treatment. The ratio of mORF/uORF for elf18 divided by that for Mock was defined as shift value. Data are shown as the distribution of log2 transformation of shift values. uORFs with significant shift determined by z-score are coloured and whose numbers are shown. f, Histogram of mORF/uORF shift upon hypoxia stress10. g, Venn diagrams showing overlapping uORFs with significant ribo-shift in responses to elf18 and hypoxia treatments. h, Normalized distribution of RNA-seq and Ribo-seq reads to show ribo-shift of GPS1 (AT2G34630) and GSTU16 (AT1G59700) upon elf18 treatment. Numbers on the right mean log2 RF (mORF/uORF). uORFs are boxed with blue colour.
Extended Data Figure 7. R-motif-mediated translational control in response elf18 induction, related to Fig 2.
a, Effects of R-motif containing 5′ leader sequences on basal translational activities after normalization to mRNA (n = 3). b, Effects of R-motif deletions (ΔR) on mRNA abundance (n = 6). c–f, Effects of R-motif deletion and R-motif substitution mutations on basal translation (c, e; n = 4) and mRNA levels (d, f, 2 experiments with 3 technical replicates) for IAA18 and BET10 (c, d) and TBF1 (e, f). g, mRNA levels in WT and R-motif deletion mutants with and without elf18 treatment (n = 9). h, Effects of R-motif deletions (ΔR) on translational responsiveness to elf18 measured using the dual-LUC assay (n = 3). i, Effects of GA, G[A]3, G[A]6 and G[A]n repeats on mRNA levels when inserted into 5′ UTR of the reporter in transient assay performed in N. benthamiana (2 experiments with 3 technical replicates). j, k, Effects of R-motif deletion and/or uORF mutations on TBF1 mRNA abundance (j) and transcriptional responsiveness to Mock and elf18 treatments (k). n = 3 after normalization to WT (j) or WT with Mock treatment (k). l, Contributions of R-motif and uORFs to TBF1 translational response to elf18 in transgenic Arabidopsis plants. 1, 2, and 3 represent individual transgenic lines tested (n = 6 after normalization to Mock). Bar with solid circles, mean with individual biological replicates.
Extended Data Figure 8. Effects of PABs on mRNA transcription and PTI-associated phenotypes, related to Fig. 3.
a, Influence of co-expressing PAB2 on mRNA abundance (n = 9). b, elf18-induced seedling growth inhibition in WT, efr-1, pab2 pab4 (pab2/4) and pab2 pab8 (pab2/8) (mean ± s.e.m., n = 5). c, MAPK activation in WT, pab2/4, pab2/8 and efr-1 seedlings after elf18 treatment measured by immunoblotting using a phosphospecific antibody against MAPK3 and MAPK6.
Extended Data Figure 9. Roles of GCN2 in PTI in plants.
a–d, Effects of the gcn2 mutation on elf18-induced eIF2α phosphorylation (a), translational induction (b, mean ± s.e.m. of LUC activity, n = 8) and transcription of the uORFsTBF1-LUC reporter (c, n = 3; bar with solid circles, mean with individual biological replicates), and resistance to Psm ES4326 (d, mean ± s.e.m., n = 8). See Supplementary Text for gel source data.
Supplementary Material
Acknowledgments
This study was supported by grants from NIH 5R01 GM069594-11 and the HHMI-GBMF (through Grant GBMF3032) to X. Dong. We thank Jose M. Alonso for ein4-1, wei7-4 and ers1-10 seeds; T. Girke, M. Hummel and J. Bailey-Serres for providing the Ribo-Seq workflow package for data analyses; W. Wang, P. Y. Hsu and P. N. Benfey for discussing the protocol; R. Zavaliev for the callose staining method; and the Arabidopsis Information Resource for gcn2, erf7, eicbp.b, pab2/4 and pab2/8 seeds. We thank P. Zwack and S. Zebell for comments on the manuscript.
Footnotes
Supplementary Information is available in the online version of the paper.
Author Contributions
G.X. and X.D. designed the research. G.X., H.Y. and J. Marqués optimized the footprinting protocol. H.Y. and G.X. performed ethylene-related and polysome profiling experiments. L.L. and G.X. generated the reporter lines. G.X. and J. Motley performed eIF2α phosphorylation assay. G.X. performed the rest of the experiments. G.G. and G.X. carried out the bioinformatic analyses and prepared the figures. G.X. and X.D. wrote the manuscript with input from all authors.
The RS and RF data presented in this publication have been deposited in NCBI’s Gene Expression Omnibus and are accessible through GEO Series accession number GSE86581.
The authors declare competing financial interests: A patent based on this study has been filed by Duke University with G.X., G.G. and X.D. as inventors.
References
- 1.Pajerowska-Mukhtar KM, et al. The HSF-like transcription factor TBF1 is a major molecular switch for plant growth-to-defense transition. Curr Biol. 2012;22:103–112. doi: 10.1016/j.cub.2011.12.015. [DOI] [PMC free article] [PubMed] [Google Scholar]
- 2.Huot B, Yao J, Montgomery BL, He SY. Growth-Defense Tradeoffs in Plants: A Balancing Act to Optimize Fitness. Mol Plant. 2014;7:1267–1287. doi: 10.1093/mp/ssu049. [DOI] [PMC free article] [PubMed] [Google Scholar]
- 3.Couto D, Zipfel C. Regulation of pattern recognition receptor signalling in plants. Nat Rev Immunol. 2016;16:537–552. doi: 10.1038/nri.2016.77. [DOI] [PubMed] [Google Scholar]
- 4.Wu SJ, Shan LB, He P. Microbial signature-triggered plant defense responses and early signaling mechanisms. Plant Sci. 2014;228:118–126. doi: 10.1016/j.plantsci.2014.03.001. [DOI] [PMC free article] [PubMed] [Google Scholar]
- 5.Dunbar TL, Yan Z, Balla KM, Smelkinson MG, Troemel ER. C. elegans detects pathogen-induced translational inhibition to activate immune signaling. Cell Host Microbe. 2012;11:375–386. doi: 10.1016/j.chom.2012.02.008. [DOI] [PMC free article] [PubMed] [Google Scholar]
- 6.Zipfel C, et al. Perception of the bacterial PAMP EF-Tu by the receptor EFR restricts Agrobacterium-mediated transformation. Cell. 2006;125:749–760. doi: 10.1016/j.cell.2006.03.037. [DOI] [PubMed] [Google Scholar]
- 7.Lei L, et al. Ribosome profiling reveals dynamic translational landscape in maize seedlings under drought stress. Plant J. 2015;84:1206–1218. doi: 10.1111/tpj.13073. [DOI] [PubMed] [Google Scholar]
- 8.Merchante C, et al. Gene-specific translation regulation mediated by the hormone-signaling molecule EIN2. Cell. 2015;163:684–697. doi: 10.1016/j.cell.2015.09.036. [DOI] [PubMed] [Google Scholar]
- 9.Liu MJ, et al. Translational landscape of photomorphogenic Arabidopsis. Plant Cell. 2013;25:3699–3710. doi: 10.1105/tpc.113.114769. [DOI] [PMC free article] [PubMed] [Google Scholar]
- 10.Juntawong P, Girke T, Bazin J, Bailey-Serres J. Translational dynamics revealed by genome-wide profiling of ribosome footprints in Arabidopsis. Proc Natl Acad Sci USA. 2014;111:E203–212. doi: 10.1073/pnas.1317811111. [DOI] [PMC free article] [PubMed] [Google Scholar]
- 11.Lukoszek R, Feist P, Ignatova Z. Insights into the adaptive response of Arabidopsis thaliana to prolonged thermal stress by ribosomal profiling and RNA-Seq. BMC Plant Biol. 2016;16 doi: 10.1186/s12870-016-0915-0. [DOI] [PMC free article] [PubMed] [Google Scholar]
- 12.Ingolia NT, Ghaemmaghami S, Newman JRS, Weissman JS. Genome-wide analysis in vivo of translation with nucleotide resolution using ribosome profiling. Science. 2009;324:218–223. doi: 10.1126/science.1168978. [DOI] [PMC free article] [PubMed] [Google Scholar]
- 13.Zipfel C. Combined roles of ethylene and endogenous peptides in regulating plant immunity and growth. Proc Natl Acad Sci USA. 2013;110:5748–5749. doi: 10.1073/pnas.1302659110. [DOI] [PMC free article] [PubMed] [Google Scholar]
- 14.von Arnim AG, Jia Q, Vaughn JN. Regulation of plant translation by upstream open reading frames. Plant Sci. 2014;214:1–12. doi: 10.1016/j.plantsci.2013.09.006. [DOI] [PubMed] [Google Scholar]
- 15.Barbosa C, Peixeiro I, Romao L. Gene expression regulation by upstream open reading frames and human disease. PLoS Genet. 2013;9:e1003529. doi: 10.1371/journal.pgen.1003529. [DOI] [PMC free article] [PubMed] [Google Scholar]
- 16.Hinnebusch AG, Ivanov IP, Sonenberg N. Translational control by 5′-untranslated regions of eukaryotic mRNAs. Science. 2016;352:1413–1416. doi: 10.1126/science.aad9868. [DOI] [PMC free article] [PubMed] [Google Scholar]
- 17.Patel GP, Ma S, Bag J. The autoregulatory translational control element of poly(A)-binding protein mRNA forms a heteromeric ribonucleoprotein complex. Nucleic Acids Res. 2005;33:7074–7089. doi: 10.1093/nar/gki1014. [DOI] [PMC free article] [PubMed] [Google Scholar]
- 18.Dufresne PJ, Ubalijoro E, Fortin MG, Laliberte JF. Arabidopsis thaliana class II poly(A)-binding proteins are required for efficient multiplication of turnip mosaic virus. J Gen Virol. 2008;89:2339–2348. doi: 10.1099/vir.0.2008/002139-0. [DOI] [PubMed] [Google Scholar]
- 19.Gallie DR. The role of the poly(A) binding protein in the assembly of the Cap-binding complex during translation initiation in plants. Translation (Austin) 2014;2:e959378. doi: 10.4161/2169074X.2014.959378. [DOI] [PMC free article] [PubMed] [Google Scholar]
- 20.Hinnebusch AG. Translational regulation of GCN4 and the general amino acid control of yeast. Annu Rev Microbiol. 2005;59:407–450. doi: 10.1146/annurev.micro.59.031805.133833. [DOI] [PubMed] [Google Scholar]
- 21.Gilbert WV, Zhou KH, Butler TK, Doudna JA. Cap-independent translation is required for starvation-induced differentiation in yeast. Science. 2007;317:1224–1227. doi: 10.1126/science.1144467. [DOI] [PubMed] [Google Scholar]
- 22.Nakagawa T, et al. Development of series of gateway binary vectors, pGWBs, for realizing efficient construction of fusion genes for plant transformation. J Biosci Bioeng. 2007;104:34–41. doi: 10.1263/jbb.104.34. [DOI] [PubMed] [Google Scholar]
- 23.Curtis MD, Grossniklaus U. A gateway cloning vector set for high-throughput functional analysis of genes in planta. Plant Physiol. 2003;133:462–469. doi: 10.1104/pp.103.027979. [DOI] [PMC free article] [PubMed] [Google Scholar]
- 24.Xu GY, et al. One-step, zero-background ligation-independent cloning intron-containing hairpin RNA constructs for RNAi in plants. New Phytol. 2010;187:240–250. doi: 10.1111/j.1469-8137.2010.03253.x. [DOI] [PubMed] [Google Scholar]
- 25.Li JT, et al. Modification of vectors for functional genomic analysis in plants. Genet Mol Res. 2014;13:7815–7825. doi: 10.4238/2014.September.26.20. [DOI] [PubMed] [Google Scholar]
- 26.Alonso JM, et al. Five components of the ethylene-response pathway identified in a screen for weak ethylene-insensitive mutants in Arabidopsis. Proc Natl Acad Sci USA. 2003;100:2992–2997. doi: 10.1073/pnas.0438070100. [DOI] [PMC free article] [PubMed] [Google Scholar]
- 27.Hua J, et al. EIN4 and ERS2 are members of the putative ethylene receptor gene family in Arabidopsis. Plant Cell. 1998;10:1321–1332. doi: 10.1105/tpc.10.8.1321. [DOI] [PMC free article] [PubMed] [Google Scholar]
- 28.Stepanova AN, Hoyt JM, Hamilton AA, Alonso JM. A Link between Ethylene and Auxin Uncovered by the Characterization of Two Root-Specific Ethylene-Insensitive Mutants in Arabidopsis. Plant Cell. 2005;17:2230–2242. doi: 10.1105/tpc.105.033365. [DOI] [PMC free article] [PubMed] [Google Scholar]
- 29.Galon Y, et al. Calmodulin-binding transcription activator 1 mediates auxin signaling and responds to stresses in Arabidopsis. Planta. 2010;232:165–178. doi: 10.1007/s00425-010-1153-6. [DOI] [PubMed] [Google Scholar]
- 30.Clough SJ, Bent AF. Floral dip: a simplified method for Agrobacterium-mediated transformation of Arabidopsis thaliana. Plant J. 1998;16:735–743. doi: 10.1046/j.1365-313x.1998.00343.x. [DOI] [PubMed] [Google Scholar]
- 31.Ingolia NT, Brar GA, Rouskin S, McGeachy AM, Weissman JS. The ribosome profiling strategy for monitoring translation in vivo by deep sequencing of ribosome-protected mRNA fragments. Nat Protoc. 2012;7:1534–1550. doi: 10.1038/nprot.2012.086. [DOI] [PMC free article] [PubMed] [Google Scholar]
- 32.Mustroph A, Juntawong P, Bailey-Serres J. Isolation of plant polysomal mRNA by differential centrifugation and ribosome immunopurification methods. Methods Mol Biol. 2009;553:109–126. doi: 10.1007/978-1-60327-563-7_6. [DOI] [PubMed] [Google Scholar]
- 33.Langmead B, Salzberg SL. Fast gapped-read alignment with Bowtie 2. Nat Methods. 2012;9:357–359. doi: 10.1038/nmeth.1923. [DOI] [PMC free article] [PubMed] [Google Scholar]
- 34.Anders S, Pyl PT, Huber W. HTSeq--a Python framework to work with high-throughput sequencing data. Bioinformatics. 2015;31:166–169. doi: 10.1093/bioinformatics/btu638. [DOI] [PMC free article] [PubMed] [Google Scholar]
- 35.Love MI, Huber W, Anders S. Moderated estimation of fold change and dispersion for RNA-seq data with DESeq2. Genome Biol. 2014;15:550. doi: 10.1186/s13059-014-0550-8. [DOI] [PMC free article] [PubMed] [Google Scholar]
- 36.Bailey TL, et al. MEME SUITE: tools for motif discovery and searching. Nucleic Acids Res. 2009;37:W202–208. doi: 10.1093/nar/gkp335. [DOI] [PMC free article] [PubMed] [Google Scholar]
- 37.Nicol JW, Helt GA, Blanchard SG, Raja A, Loraine AE. The Integrated Genome Browser: free software for distribution and exploration of genome-scale datasets. Bioinformatics. 2009;25:2730–2731. doi: 10.1093/bioinformatics/btp472. [DOI] [PMC free article] [PubMed] [Google Scholar]
- 38.Miettinen TP, Bjorklund M. Modified ribosome profiling reveals high abundance of ribosome protected mRNA fragments derived from 3′ untranslated regions. Nucleic Acids Research. 2015;43:1019–1034. doi: 10.1093/nar/gku1310. [DOI] [PMC free article] [PubMed] [Google Scholar]
Associated Data
This section collects any data citations, data availability statements, or supplementary materials included in this article.
Supplementary Materials
Data Availability Statement
The authors declare that the main data supporting the findings of this study are available within the article and its Source Data files. Extra data are available from the corresponding author upon request. The RS and RF data presented in this publication have been deposited in NCBI’s Gene Expression Omnibus (GSE86581).


