

Abstract
Cyclists are exposed to traffic-related air pollution (TRAP) during their commutes due to their proximity to vehicular traffic. Two of the main components of TRAP are black carbon (BC) and nitrogen dioxide (NO2), which have both been causally associated with increased mortality. To assess the impact of cyclists’ exposure to TRAP, a battery-powered mobile monitoring station was designed to sample air pollutants along five bike routes in Boston, Massachusetts. The bike routes were categorized into three types: bike paths, which are separated from vehicle traffic; bike lanes, which are adjacent to traffic; and designated bike lanes, which are shared traffic lanes for buses and cyclists. Bike lanes were found to have significantly higher concentrations of BC and NO2 than bike paths in both adjusted and unadjusted generalized linear models. Higher concentrations were observed in designated bike lanes than bike paths; however, this association was only significant for NO2. After adjusting for traffic density, background concentration, and proximity to intersections, bike lanes were found to have concentrations of BC and NO2 that were approximately 33% higher than bike paths. Distance from the road, vegetation barriers, and reduced intersection density appear to influence these variations. These findings suggest that cyclists can reduce their exposure to TRAP during their commute by using bike paths preferentially over bike lanes regardless of the potential increase of traffic near these routes.
Keywords: exposure assessment, mobile monitoring, traffic-related air pollution (TRAP), vegetation, bicycle route type
1.0 Introduction
Cycling has been increasingly promoted as a mode of transportation in cities in the U.S. to reduce the emission of hazardous particulate and gaseous pollutants, decrease traffic congestion, and improve physical activity. In 1991, Congress passed the Intermodal Surface Transportation Efficiency Act (ISTEA) that recognized the increasingly important role of bicycling and walking in creating a balanced, intermodal transportation system. Since then, the Federal government has funded projects to improve the bicycling infrastructure in cities and towns (FHA, 2012). From 2007 to 2011, Boston, Massachusetts, has installed more than 500 bike racks and 50 miles of bike lanes; by 2011, cyclists represented 2.1% of the commuters in Boston, more than three-times the national average (City of Boston, 2012).
In response to an increase in cyclists in urban areas, bicycle safety has received more attention in recent years, and efforts are underway to improve conditions for cyclists (Reynolds et al., 2009). These efforts have not, however, been focused on mitigating air pollution exposure to the cyclist. Accurate methods to assess cyclists’ exposure to traffic-related air pollutants (TRAP) are warranted since cyclists share the roads with cars, buses, and trucks, all of which contribute to TRAP.
TRAP has been associated with several adverse health outcomes including increased asthma, cardiovascular risks, lung cancer risks, fatal myocardial infarction, and increased mortality (Han and Naeher, 2005). Two key components of TRAP are nitrogen dioxide (NO2) and elemental black carbon (BC). They represent the complex mixture of TRAP and have been causally associated with mortality (Hoek et al., 2013). BC has been shown to increase the risk of adverse cardiovascular events. The effect of BC on mortality is more robust than PM2.5 and therefore serves as a better indicator of particle pollution (Janssen et al., 2011). Exposure to outdoor NO2 is associated with significant respiratory health effects, particularly to asthmatics. Children exposed to a 5.7 ppb increase in NO2 have 1.83 (95% CI = 1.04–3.22) times the odds of doctor-diagnosed asthma (Gauderman et al., 2005).
Several studies have investigated cyclists’ exposure to TRAP, mainly via comparisons with vehicle commuters and pedestrians. Cyclists are generally at risk for higher exposures to TRAP after accounting for increased minute ventilation rates during their commutes. In addition, cyclists are exposed to higher peak concentrations since in-vehicle concentrations are buffered by limited air exchange (Zuurbier et al., 2010). The increased exposure to TRAP suggests that bicycle commuters are at greater risk of cardiovascular and respiratory damage. Strak et al. monitored PM10, soot, and particle number along low and high traffic routes and measured lung function, exhaled nitrogen oxide, and respiratory symptoms in 12 participants before, directly after, and six hours after each bike trip. Bikers on high traffic routes did not have any more acute damage to respiratory function than bikers on low traffic routes. However, Weichenthal et al. observed an inverse relationship between TRAP exposure and heart rate variability. They measured breathing zone levels of a wide-variety of traffic related air pollutants during hour long bike commutes and measured heart rate variability for 4 hours following the commute. To our knowledge, no studies have looked at the chronic effects from long-term bicycling exposure.
These results, which were obtained in Canada and Europe, cannot be generalized to the U.S. because of differences in fuels, vehicle fleet mix, meteorology, urban typology, and road infrastructure between the U.S. and Europe. Of those studies conducted in the U.S., many have relied on gasoline or diesel-powered vehicles to haul their monitoring equipment. TRAP is episodic and highly variable in urban environments. Large, energy-intensive equipment is required to achieve the quick response time and fine temporal resolution necessary to capture rapidly changing TRAP levels. Use of vehicles that generate the pollutants being measured requires an assessment of the monitoring vehicles’ contribution to the levels being measured. Vehicles are also limited in their capacity to access all routes or lanes accessible to cyclists, potentially limiting the accuracy of the cyclist’s exposure assessment.
Some bike routes allow cyclists to reduce their exposure to TRAP compared to vehicle commuters by travelling adjacent to traffic and bypassing heavily polluted intersections (Gee and Raper, 1999). Specific characteristics of urban environments (e.g. proximity to major roads, street canyons, tree-lined streets and traffic patterns) all play a role in determining the level of exposure in the cycling microenvironment. Jarjour et al. (2013) and Hertel et al. (2008) both showed that exposure to TRAP can be greatly reduced by choosing low-traffic bike routes. While traffic levels remain difficult to control, urban planners can reduce exposures to TRAP with smart bike route development.
In this study, exposure to NO2 and BC during morning and evening commutes is determined for three bike route types in Boston, Massachusetts: bike path, which is a separated from vehicle traffic; bike lane, which is adjacent to vehicle traffic; and designated bike lane, which is a shared traffic lane for bicycles and buses. A mobile monitoring platform was designed to measure NO2, BC, carbon monoxide (CO), carbon dioxide (CO2), ozone (O3), particle mass concentration less than 2.5 microns in diameter (PM2.5), PM2.5 elemental composition, particle number count, particle extinction coefficient, temperature, relative humidity, atmospheric pressure, wind speed, wind direction, video of adjacent traffic, and GPS location along these routes. Focusing on NO2 and BC, we hypothesize that bike lanes and designated bike lanes have higher NO2 and BC concentrations than bike paths.
2.0 Methods
Air pollution measurements were collected during morning (7:00 am to 10:00 am) and evening (3:00 pm to 6:00 pm) commutes along pre-designated bike routes in Boston. The bike routes were selected to represent travel over a variety of bike route types during variable traffic and atmospheric conditions. A total of five routes were selected and each route was monitored four times (Table 1). A total of 263 km (163 miles) were monitored. Cycling was continuous with breaks every hour or when riding by a fixed-site monitoring station in order to obtain a wind speed and direction reading. Wind speed and direction measurement locations were consistent within each route.
Table 1.
Length in kilometers and sampling size of sampling routes and bike route types
| Route Type | Route
|
Sample Size
|
||||||
|---|---|---|---|---|---|---|---|---|
| 1 | 2 | 3 | 4 | 5 | Total | BCa | NO2b | |
| Bike Path | 1.4 | 5.7 | 5.7 | 4.4 | 0 | 17.3 | 257 | 381 |
| Bike Lane | 10.2 | 10.7 | 9.4 | 7.7 | 10.6 | 48.6 | 818 | 1,478 |
| Designated Bike Lane | 0 | 0 | 0 | 2.6 | 0 | 2.6 | 19 | 40 |
|
| ||||||||
| Total | 11.6 | 16.4 | 15.2 | 14.6 | 10.6 | 68.4 | 1,094 | 1,899 |
Averaged by time periods with a 0.02 change in attenuation
Averaged to the nearest minute
The monitoring equipment was towed behind a bicycle on a mobile monitoring platform. Four 18 amp hour batteries provided AC power to all the instruments for five hours, eliminating the concern of self-sampling emissions produced by a fuel-powered platform. All monitoring instruments were housed in a SKB rotoshock rack transport case to reduce vibrations that may interfere with the instruments. Despite this precaution, measurements of PM2.5 and particle counts were interrupted by vibrations, resulting in incomplete datasets.
BC was measured with an AETH Labs (San Francisco, CA) microAeth® Model AE51 black carbon aerosol monitor. The attenuation (ATN), a measure of the light absorbance of the particles, is measured relative to an adjacent ‘Reference’ portion of the filter once per sampling period. The gradual accumulation of optically-absorbing particles leads to a gradual increase in ATN from one period to the next. The concentration is calculated using the flow rate and the change in ATN. The BC concentration, which was recorded every second, was averaged over time intervals where ATN increased by 0.02, according to the Optimized Noise-Reduction Averaging method (Hagler et al., 2011). If the ATN increased by 0.04 or greater over the course of one minute, both recorded data points were deemed imprecise and removed. As an additional measure to reduce noise, the top and bottom percentiles were removed from the dataset. The resulting sensitivity is 1 ng/m3 within a range of 0–1000 ng/m3.
NO2 measurements were obtained with Aerodyne Research’s (Billerica, MA) CAPS NO2 Monitor, which uses a direct absorption measurement to eliminate sensitivity to other nitro-containing species (Kebabian et al., 2005). A reading was recorded every second but averaged to the nearest minute for statistical analyses. Using the fast response logging interval, the sensitivity is less than 1.5 ppb. Since different quality control measures were applied for BC and NO2, the datasets have different points excluded from analysis. As a result, traffic and vegetation density are slightly different in each dataset due to the exclusion criteria (Table 2).
Table 2.
Descriptive statistics of model parameters for each pollutant by route type. “At intersection” is the fraction of time within 50 m of an intersection and “vegetation density” is the average vegetation density where 0 is no vegetation, 1 is sparse vegetation, 2 is moderate vegetation, and 3 is dense vegetation.
| Route Type | Mean (Standard Error)
|
|
|---|---|---|
| BC (ng/m3) | NO2 (ppb) | |
| Sampled Concentration | ||
|
| ||
| Bike Path | 1,670 (101) | 14.7 (0.582) |
| Bike Lane | 2,360 (85.1) | 19.5 (0.343) |
| Designated Bike Lane | 1,980 (336) | 24.2 (1.72) |
|
| ||
| Traffic Density (veh-km) | ||
|
| ||
| Bike Path | 13,900 (423) | 12,900 (386) |
| Bike Lane | 7,300 (173) | 6,260 (124) |
| Designated Bike Lane | 5,430 (70.2) | 5,220 (375) |
|
| ||
| Background Concentration | ||
|
| ||
| Bike Path | 640 (16.9) | 16.1 (0.115) |
| Bike Lane | 641 (9.35) | 15.8 (0.102) |
| Designated Bike Lane | 1,020 (129) | 15.9 (0.245) |
|
| ||
| At Intersection | ||
|
| ||
| Bike Path | 0.510 (0.0312) | 0.423 (0.0253) |
| Bike Lane | 0.630 (0.0169) | 0.537 (0.0130) |
| Designated Bike Lane | 0.368 (0.114) | 0.400 (0.0784) |
|
| ||
| Vegetation Density | ||
|
| ||
| Bike Path | 0.981 (0.0773) | 1.36 (0.0664) |
Temperature, relative humidity, atmospheric pressure, CO, and CO2 were measured using TSI’s model 7565 Q-trak indoor air quality monitor. A reading was recorded every 30 seconds. RainWise’s (Bar Harbor, ME) WindLog Wind Data Logging Device was used to record wind speed and direction when the mobile monitoring platform was stopped. The operator of the mobile platform would point the Windlog in the northerly direction and record the stop and restart time on his log.
The position of the mobile monitoring platform was recorded every second or every 5 seconds using a Q STARZ (Taipei, ROC) model BT-1000XT GPS travel recorder. Data collected within 120 m of the Landmark Center (42.344819N, 71.102326W), where each of the routes started and ended, was removed because the satellite signal was unreliable (Figure 1). When a 5-second sampling time was used, the location of pollution data recorded within that 5-second window was linearly interpolated. Routes were created by matching one-minute GPS readings associated with air pollution measurements to Massachusetts Department of Transportation (MassDOT) 2009 Roads and Bicycle Trails obtained from the Office of Geographic Information (MassGIS), Commonwealth of Massachusetts, Information Technology Division (http://www.mass.gov/).
Figure 1.
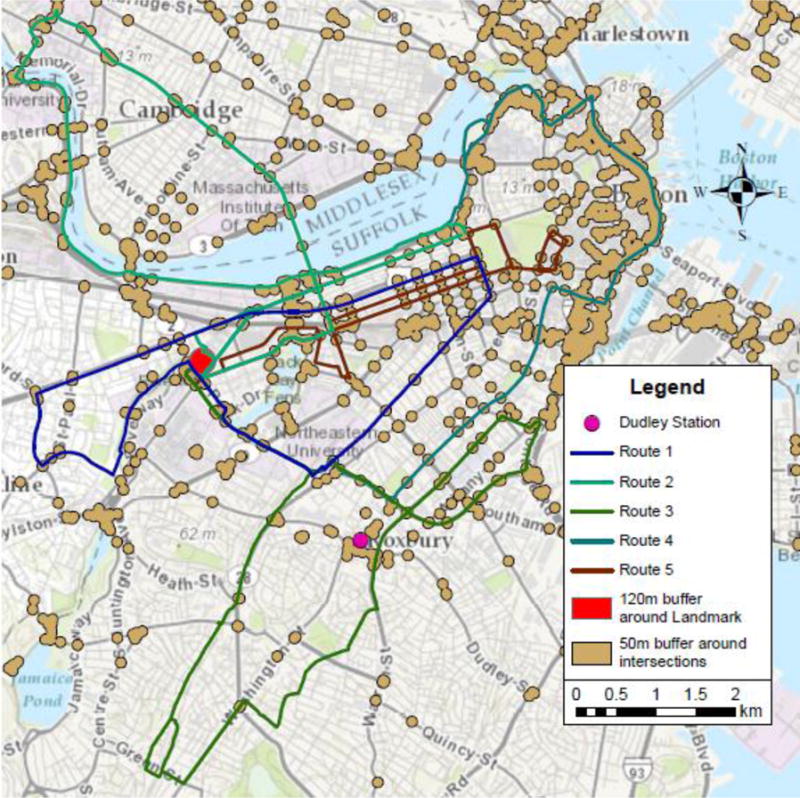
Map of study area showing the 5 sampling routes
Generalized linear models were used to test the association between bike route type and pollution levels. The bike route types were entered as indicator variables. The covariates used in the models were traffic density, background pollution levels, proximity to intersections, and vegetation density between the bike route and vehicle traffic. Traffic density within 100 m was assessed spatially by dividing the study area into a grid of points spaced 200 m apart. For each point in the grid, the following equation was used to determine traffic density:
| (1) |
where n is the total number of roads within a 100 m radius of the point, L is the length of the road, and ADT is the average daily traffic of the road (Figure 2). ADT is based on vehicle counts of major roads and estimates of local roads conducted by MassDOT in 2009. The traffic densities of the four nearest points to the GPS location of the mobile monitoring platform were averaged, weighted by the distance from the GPS location to the point.
Figure 2.
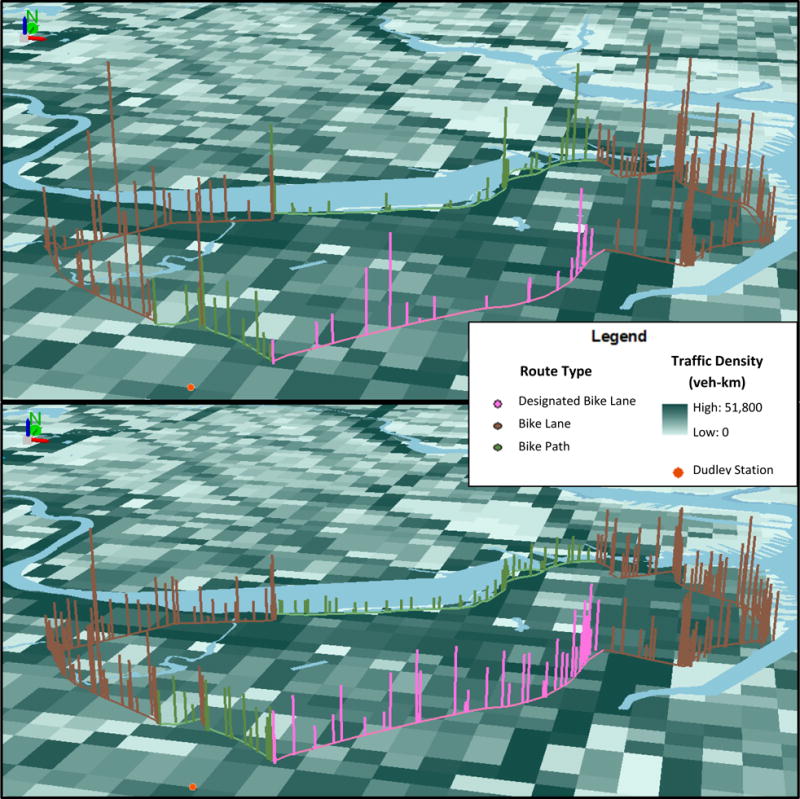
Map of BC (top) and NO2 (bottom) concentrations on Route 4, divided into the three bike route types. Average daily vehicle kilometers per 200 m square grids are shown in blue. These are 3D representations; comparisons of linear distance and magnitude of pollutant can only be made with nearby points.
The background pollution levels were obtained from the EPA monitoring station located in Dudley Square, Roxbury (AQS Site ID: 25-025-0042). The hourly measurements were linearly interpolated to be matched with sampled concentrations with a one-minute time resolution. Points sampled within 50 m of an intersection of two or more major roads were defined as “at intersection” (Figure 1). Major roads were defined as roads of MassDOT functional class 1 to 4. The type of vegetation between the bike path and the road was assessed for each data point using google streetview: 0 = no vegetation, 1 = sparse vegetation (one row of bushes or trees with trunk diameter < 15 cm), 2 = moderate vegetation (one row of trees with trunk diameter > 15 cm), and 3 = dense vegetation (two or more rows of trees and bushes). The model analyses were performed with SAS software version 9.3 (SAS Institute Inc., Cary, NC, USA, Copyright 2009). Geographic analyses and representations were performed with ArcMap and ArcScene software version 10.1 (Esri, Redlands, CA, USA, Copyright 2012).
3.0 Results
Table 2 shows the distribution of each covariate among the three bike route types. Traffic density was greater for bike paths than bike lanes for both pollutants. Bike paths are often coupled with high traffic roads to prevent unsafe bicycling conditions (Figure 2). Intersections were more common along bike lanes than bike paths or designated bike lanes (Table 2). Background concentration levels were consistent across all bike route types with the exception of BC in designated bike lanes. Most (14 of 19) of the data points in this stratum were collected on a single, high pollution day. The larger sample sizes of the other route types resulted in distributions representing more typical conditions.
Generalized linear models were used to test the association between bike route type and sampled pollution levels after adjusting for traffic density, background concentration, and proximity to intersections. Bike paths were used as the reference category. The beta coefficients for bike lanes were all statistically significantly different from zero with the exception of designated bike lanes for BC, which was limited by its small sample size (Table 3). The significance of the other estimates was not just driven by large sample sizes. BC was predicted to increase by 33% in bike lanes compared to bike paths after controlling for traffic, background concentration and intersections. NO2 was predicted to increase by 31% in bike lanes and 59% in designated bike lanes.
Table 3.
Generalized linear model results testing the association between bike route type and pollution levels with and without adjusting for traffic density, background levels, intersections and vegetation density.
| Parameter | BC (ng/m3)
|
NO2 (ppb)
|
||
|---|---|---|---|---|
| β | p-valuea | β | p-value | |
| Unadjusted | ||||
|
| ||||
| Bike Path (Reference) | 0 | NA | 0 | NA |
| Bike Lane | 682.3 | <0.0001 | 4.80 | <0.0001 |
| Designated Bike Lane | 305.2 | 0.569 | 9.46 | <0.0001 |
| Intercept | 1673 | <0.0001 | 14.74 | <0.0001 |
|
| ||||
| Traffic, Background Concentration and Intersections | ||||
|
| ||||
| Bike Path (Reference) | 0 | NA | 0 | NA |
| Bike Lane | 580.1 | 0.0019 | 4.33 | <0.0001 |
| Designated Bike Lane | 118.8 | 0.831 | 8.98 | <0.0001 |
| Traffic Density | −0.017 | 0.206 | −8.1×10⁻⁵ | 0.153 |
| Background Concentration | 0.095 | 0.700 | 0.684 | <0.0001 |
| At Intersection | −62.43 | 0.670 | 1.42 | 0.020 |
| Intercept | 1876 | <0.0001 | 4.18 | <0.0001 |
|
| ||||
| Traffic, Background Concentration, Intersections and Vegetation Density | ||||
|
| ||||
| Bike Path (Reference) | 0 | NA | 0 | NA |
| Bike Lane | 521.3 | 0.020 | 1.77 | 0.117 |
| Designated Bike Lane | 52.74 | 0.927 | 6.33 | 0.0052 |
| Traffic Density | −0.018 | 0.188 | −1.2×10⁻⁴ | 0.040 |
| Background Concentration | 0.101 | 0.685 | 0.668 | <0.0001 |
| At Intersection | −76.32 | 0.610 | 1.07 | 0.083 |
| Vegetation Density | −55.77 | 0.638 | −1.73 | 0.0008 |
| Intercept | 1946 | <0.0001 | 7.42 | 0.0001 |
The probability that the estimate equals zero
The differences between bike route types were reduced when adjusting for the covariates in the model. Part of the variation between bike paths and bike lanes was due to variable traffic levels. Traffic density was found to be negative confounder for both pollutants (Table 3). Background concentration acted as a positive confounder; a 1 μg/m3 increase in background BC concentrations resulted in a 0.1 μg/m3 change in the local concentration, and a 1 ppb increase in background NO2 resulted in a 0.68 ppb change in the local NO2. Because of the strong correlation between local and background NO2 concentrations, background concentration picked up a large fraction of the variability that was explained by the intercept in the unadjusted model. In contrast, BC was dominated by local variability, and thus background concentration did not play a significant role in the model predictions. NO2 increased by 1.4 ppb within 50 m of an intersection while BC decreased by 62 μg/m3 near intersections. BC, however, changes on a finer spatial scale than NO2 and thus returns to background levels well within 50 m of an intersection. To avoid non-differential misclassification, the model was run with a 25 m buffer around intersections. A 49.62 μg/m3 increase in BC was predicted within 25 m of an intersection (p-value = 0.74). The strongest correlations were found for background concentration and intersections in the NO2 model (p-values < 0.05).
An additional variable was added to the model to assess the influence of vegetation between vehicle traffic and bicyclists. The presence of vegetation led to reductions in BC and NO2 levels in the bike paths. Since vegetation only occurred along bike paths, the effect of vegetation was picked up by the bike path variable in the previous model. The model with vegetation included had lower effect estimates for bike lanes compared to the model without. A one-unit increase in vegetation density (e.g. from sparse to moderate vegetation) was associated with a 56 μg/m3 (3.4%) decrease in BC and a 1.7 ppb (11.6%) decrease in NO2 (Table 3).
Table 4 shows how different model specifications influenced the differences between bike route types. In both unadjusted and adjusted models, bike paths had statistically significantly lower concentrations of BC and NO2 than bike lanes, with the exception of bike paths and designated bike lanes for BC. Adjusting for traffic, background concentration and intersections did not change the p-values; however, adjusting for vegetation reduced the magnitude of the differences between bike paths and bike lanes.
Table 4.
P-values testing the hypothesis that the mean pollution levels for each route type are equal in adjusted and unadjusted models.
| Route Type | BC
|
NO2
|
||
|---|---|---|---|---|
| Bike Lane | Designated Bike Lane | Bike Lane | Designated Bike Lane | |
| Unadjusted | ||||
|
| ||||
| Bike Path | <0.0001 | 0.837 | <0.0001 | <0.0001 |
| Bike Lane | NA | 0.751 | NA | 0.060 |
|
| ||||
| Traffic, Background Concentration and Intersections | ||||
|
| ||||
| Bike Path | 0.0054 | 0.975 | <0.0001 | <0.0001 |
| Bike Lane | NA | 0.663 | NA | 0.054 |
|
| ||||
| Traffic, Background Concentration, Intersections and Vegetation Density | ||||
|
| ||||
| Bike Path | 0.053 | 0.995 | 0.259 | 0.015 |
| Bike Lane | NA | 0.655 | NA | 0.059 |
4.0 Discussion
This study demonstrates that the type of bike route cyclists use has a significant impact on their exposure to TRAP. Bike paths have lower concentrations of BC and NO2 than bike lanes. The decrease is significant with or without adjusting for confounders; not only do bike paths lead to lower concentrations than bike lanes given a set traffic density, they also have significantly lower concentrations given the much higher traffic densities along the bike paths observed in this study. A cyclist’s exposure to TRAP is likely to be reduced using bike paths regardless of the traffic conditions adjacent to the route.
The physical explanation for this reduction is twofold: 1) bike paths are further removed from the road than bike lanes, which allows for increased dilution, and 2) there may be physical barriers between the cyclist and traffic that interfere with the dispersion of pollutants. When vegetation is added to the model, the reduction in pollution levels that was previously attributed to the bike path is transferred to the vegetation density variable. The beta coefficients (βs) for bike lanes in the previous model approximately equal the βs in the new model minus the βs for vegetation density. The remainder of the difference between bike paths and bike lanes is likely due to the distance between bike paths and vehicle traffic and the reduction in intersections along bike paths.
The Paul Dudley White Bike Path along Storrow Drive and the Charles River, which is the northern bike path in Figure 2, is a good example of these phenomena. This path is separated from the edge of the road by up to 30 m. The edge of the road is lined with trees, which increases the amount of vertical dispersion and thereby reduces the amount of horizontal dispersion off the road. Trees have also been shown to remove TRAP through deposition on leaves. Both of these processes are subject to effect modification by tree species and leaf area (Nowak et al., 2013), which were not measured as part of this study. Although 52% of the time on the Paul Dudley White Bike Path the mobile monitoring platform was within 50 m of an intersection, only 7.7% of the time was it at an intersection where the bike path crossed the intersection. Cyclists are able to bypass busy intersections along this bike path. Lastly, the river to the north of the path allows increased dilution compared to bike paths that are surrounded by buildings. As a result, the NO2 and BC levels are lower here compared to bike lanes and other bike paths despite having some of the highest traffic densities.
The seemingly contradictory observation of low pollution along the heavily trafficked Storrow Drive is so pronounced that the model predicts traffic to be a slight negative confounder. A change in traffic levels across the interquartile range (an increase of 6896 vehicle-km) results in a 117 μg/m3 decrease in BC and a 0.55 ppb decrease in NO2 (Table 3). When the Paul Dudley White Bike Path is removed from the model, the β for traffic density for NO2 becomes positive and the β for BC increases from −0.017 to −0.000008. In all model formulations, the impact of traffic on TRAP is small in comparison to other parameters, suggesting that traffic density may not be a good indicator of pollution levels.
As seen in Figure 2, the local concentrations are spatially episodic in nature and often poorly predicted by the underlying traffic density. In addition to the distance of the bike path from the road and vegetation, traffic density fails to account for spatial variations in atmospheric conditions and traffic congestion. Atmospheric conditions are modified at the local level by urban features including the shape and positioning of buildings. Wind flow patterns and dilution change more rapidly in urban areas than rural ones, which increase the spatial variability of air pollution (Kumar et al., 2011). Traffic density is a measure of average daily traffic levels on each roadway and does not reflect the temporal and spatial variation of traffic flows, let alone the variation in vehicle emissions. Vehicles that frequently accelerate and decelerate have incomplete combustion, resulting in more combustion byproducts in the exhaust. In particular, elevated levels of BC and NO2 are observed at intersections where cars are densely packed and idling.
The impact of traffic congestion is compounded by clustering of cyclists at busy intersections. The more cyclists on the road, the longer it takes for them to pass through the intersection. An additional benefit of bike paths is that their separation from vehicular traffic often makes it possible to circumvent intersections via overpasses or underpasses. Bike paths had 12% fewer intersections along their routes than bike lanes (Table 2). Not only does this design characteristic increase safety and reduce travel times for cyclists, it also allows them to bypass heavily polluted intersections.
The background concentration was derived from a fixed location for all routes and cannot account for spatial variations. Instead, it accounts for much of the temporal variability in pollution levels. Regional changes in atmospheric conditions, traffic patterns (rush hour versus work hours), and other large source contributions all impact the background concentration, which in turn affects the local concentrations. As a result, the local pollution levels represented by the traffic, intersection and vegetation variables are superimposed on the less turbulent background concentration variable.
Studies by Hatzopoulou et al. (2013), Boogaard et al. (2009), and Kendrick et al. (2011) have investigated the relationship between bike route type and exposure to TRAP. All three found reductions in bike paths compared to bike lanes, the size of which varied by type of pollutant and location; however, only Kendrick et al (2011) obtained statistically significant findings by using single fixed location. These studies were limited in their characterization of bike paths. Although Hatzopoulou et al. (2013) investigated the distance of the bike path from the nearest traffic lane and found a 2.5% decrease in BC for every 5 m increase in distance, none of the studies looked at the presence or density of vegetation. This was in part due to the types of bike paths that were included in these studies.
The main limitation of this study is the inability to model completely the complex spatial and temporal variations in BC and NO2. While a significant proportion of the variability in BC and NO2 is explained by the model, additional confounding variables may increase the discrimination of the model. TRAP in urban areas is highly variable and influenced by complex systems. Accurate measurement of weather and source factors is necessary before the presence and extent of confounding and/or effect modification can be determined through modeling.
For example, in this study average daily traffic levels were used in place of real-time measures. One of the largest confounders not adjusted for in the model is proximity in space and time to local mobile sources. BC in particular is sensitive to local emissions. When the mobile monitoring platform was following or being passed by a bus in the designated bike lane, BC was on average 1170 μg/m3 higher than when it was not. The compressed natural gas and diesel-electric hybrid buses along this route led to an overall increase in NO2 compared to other route types, but the concentrations were not influenced by real-time proximity to buses. Given a large enough sample size, the impact of local traffic will normalize; however, this was not achieved for designated bike lanes.
Another limitation is the narrow range of traffic and weather conditions observed in this study. Sampling was conducted in August and September during morning and afternoon commutes. The weather on these days was warmer than other times of the year and did not include inclement conditions. Traffic volumes were higher during sampling periods than would be expected at other times of the day. While the consistency of these parameters improves the model fit, the generalizability of the model to other seasons and traffic conditions is reduced.
Lastly, we did not collect information on health outcomes as part of this study, which limits our ability to predict health risks from this exposure. The detailed information on exposure to TRAP and relevant confounders can be compared to other studies with similar exposures. For example, these results are comparable to high traffic conditions observed by Weichenthal et al. (2011), which were associated with acute increases in heart rate variability.
5.0 Conclusion
Within this study, we have characterized real-time exposure to TRAP for cyclists along multiple bike route types after adjusting for traffic, background concentration, and proximity to intersections. The novel sampling methodology and mobile monitoring platform utilized increased both the mobility and reliability of our monitoring capacity and allowed us to measure air pollutant concentrations directly within bike paths and lanes without relying on surrogate measures. Bike paths were found to have lower concentrations of BC and NO2 than bike lanes in both adjusted and unadjusted models. Cyclists can reduce their exposure to TRAP during their commute by using bike paths preferentially over bike lanes regardless of the potential increase of traffic along these routes. Based on these results and the relevant cyclist safety literature, urban planners should push for the development of bike paths instead of bike lanes whenever possible and should design bike paths with vegetation between the cyclists and vehicle traffic.
Highlights.
We monitored traffic-related air pollutants along different bike routes in Boston
We modeled the impact of route type on BC and NO2 levels
Bike paths were found to have lower levels of BC and NO2 than bike lanes
Vegetation and proximity to intersections influence pollution levels
Acknowledgments
This study was funding by NIEHS Grant 1R44ES018494-01. We acknowledge David Pappas for his efforts operating and towing the mobile monitoring station along the sampling routes. The Aerodyne team was invaluable in providing instrumentation for the mobile monitoring platform. We would also like to acknowledge Jaime Hart for assisting with the SAS analyses.
Footnotes
Conflict of Interest
The authors declare no conflict of interest.
References
- Boogaard H, Borgman F, Kamminga J, Hoek G. Exposure to ultrafine and fine particles and noise during cycling and driving in 11 Dutch cities. Atmospheric Environment. 2009;43:4234–4242. [Google Scholar]
- Boston, City of. Transportation Fact Book and Neighborhood Profiles. 2010 Accessed from City of Boston Website, 2012 http://www.cityofboston.gov/bikes/statistics.asp.
- Federal Highway Adminstration. Bicycle and Pedestrian Provisions of the Federal-aid Program. 2012 http://www.fhwa.dot.gov/environment/bicycle_pedestrian/overview/bp-broch.cfm#funding.
- Gauderman WJ, Avol E, Lurmann F, Kuenzli N, Gilliland F, Peters J, McConnell R. Childhood asthma and exposure to traffic and nitrogen dioxide. Epidemiology. 2005;16(6):737–743. doi: 10.1097/01.ede.0000181308.51440.75. [DOI] [PubMed] [Google Scholar]
- Gee IL, Raper DW. Commuter exposure to respirable particles inside buses and by bicycle. The Science of the Total Environment. 1999;235:403–405. doi: 10.1016/s0048-9697(99)00247-8. [DOI] [PubMed] [Google Scholar]
- Hagler GSW, Yelverton TLB, Vedantham R, Hansen ADA, Turner JR. Post-processing method to reduce noise while preserving high time resolution in aethalometer real-time black carbon data. Aerosol and Air Quality Research. 2011;11:539–546. [Google Scholar]
- Han X, Naeher LP. A review of traffic-related air pollution exposure assessment studies in the developing world. Environment International. 2005;32:106–120. doi: 10.1016/j.envint.2005.05.020. [DOI] [PubMed] [Google Scholar]
- Hatzopoulou M, Weichenthal S, Dugum H, Pickett G, Miranda-Moreno L, Kulka R, Anderson R, Goldberg M. The impact of traffic volume, composition, and road geometry on personal air pollution exposures amoung cyclists in Montreal, Canada. Journal of Exposure Science and Environmental Epidemiology. 2013;23:46–51. doi: 10.1038/jes.2012.85. [DOI] [PubMed] [Google Scholar]
- Hertel O, Hvidberg M, Ketzel M, Storm L, Stausgaard L. A proper choice of route significantly reduces air pollution exposure – A study on bicycle and bus trips in urban streets. Science of the Total Environment. 2008;389:58–70. doi: 10.1016/j.scitotenv.2007.08.058. [DOI] [PubMed] [Google Scholar]
- Hoek G, Krishnan RM, Beelen R, Peters A, Ostro B, Brunekreef B, Kaufman JD. Long-term air pollution exposure and cardio-respiratory mortality: a review. Environmental Health. 2013;12(43) doi: 10.1186/1476-069X-12-43. [DOI] [PMC free article] [PubMed] [Google Scholar]
- Janssen NAH, Hoek G, Simic-Lawson M, Fischer P, Bree L, Brink H, Keuken M, Atkinson RW, Anderson HR, Brunekreef B, Cassee FR. Black carbon as an additional indicator of adverse health effects of airborne particles compared with PM10 and PM2.5. Environmental Health Perspectives. 2011;119(12):1691–1699. doi: 10.1289/ehp.1003369. [DOI] [PMC free article] [PubMed] [Google Scholar]
- Jarjour S, Jerrett M, Westerdahl D, Nazelle AD, Hanning C, Daly L, Lipsitt J, Balmes J. Cyclist route choice, traffic-related air pollution, and lung function: a scripted exposure study. Environmental Health. 2013;12(14) doi: 10.1186/1476-069X-12-14. [DOI] [PMC free article] [PubMed] [Google Scholar]
- Kebabian PL, Herndon SC, Freedman A. Detection of Nitrogen Dioxide by Cavity Attenuated Phase Shift Spectroscopy. Analytical Chemistry. 2005;77:724–728. doi: 10.1021/ac048715y. [DOI] [PubMed] [Google Scholar]
- Kendrick CM, Moore A, Haire A, Bigazzi A, Figliozzi M, Monsera CM, George L. Impact of bicycle lane characteristics on exposure of bicyclists to traffic-related particulate matter. Trans Res Records. 2011;2247:24–32. [Google Scholar]
- Kumar P, Ketzel M, Vardoulakis S, Pirjola L, Britter R. Dynamics and dispersion modelling of nanoparticles from road traffic in urban atmospheric environments–A review. Journal of Aerosol Science. 2011;43:580–603. [Google Scholar]
- Nowak DJ, Hirabayashi S, Bodine A, Hoehn R. Modeled PM2.5 removal by trees in ten U.S. cities and associated health effects. Environmental Pollution. 2013;178:395–402. doi: 10.1016/j.envpol.2013.03.050. [DOI] [PubMed] [Google Scholar]
- Reynolds CCO, Harris MA, Teschke K, Cripton P, Winters M. The impact of transportation infrastructure on bicycling injuries and crashes: a review of the literature. Environmental Health. 2009;8(47) doi: 10.1186/1476-069X-8-47. [DOI] [PMC free article] [PubMed] [Google Scholar]
- Strak M, Boogaard H, Meliefste K, Oldenwening M, Zuurbier M, Brunekreef B, Hoek G. Respiratory health effects of ultrafine and fine particle exposure in cyclists. Occupational and Environmental Medicine. 2011;67:118–124. doi: 10.1136/oem.2009.046847. [DOI] [PubMed] [Google Scholar]
- Weichenthal S, Kulka R, Dubeau A, Martin C, Wang D, Dales R. Traffic-related air pollution and acute changes in heart rate variability and respiratory function in urban cyclists. Environmental Health Perspectives. 2011;119(10):1373–1378. doi: 10.1289/ehp.1003321. [DOI] [PMC free article] [PubMed] [Google Scholar]
- Zuurbier M, Hoek G, Oldenwening M, Lenters V, Meliefste K, Hazel PVD, Brunekreef B. Commuters’ exposure to particulate matter air pollution is affected by mode of transport, fuel type, and route. Environmental Health Perspectives. 2010;118:783–789. doi: 10.1289/ehp.0901622. [DOI] [PMC free article] [PubMed] [Google Scholar]