Abstract
We have constructed a map of the “protein structure space” by using the pairwise structural similarity scores calculated for all nonredundant protein structures determined experimentally. As expected, proteins with similar structures clustered together in the map and the overall distribution of structural classes of this map followed closely that of the map of the “protein fold space” we have reported previously. Consequently, proteins sharing similar molecular functions also were found to colocalize in the protein structure space map, pointing toward a previously undescribed scheme for structure-based functional inference for remote homologues based on the proximity in the map of the protein structure space. We found that this scheme consistently outperformed other predictions made by using either the raw scores or normalized Z-scores of pairwise dali structure alignment.
Keywords: global map of protein universe, multivariate analysis, protein function prediction, protein structure universe
The molecular functions of a protein can be inferred from either its sequence or structure information. Sequence-based function inference methods annotate molecular function of a protein from its sequence homologues. Most genome-wide functional annotations are carried out with this scheme, by using sequence alignment tools such as blast (1), or motif/profile-based search tools such as prosite (2, 3) and pfam (4, 5). However, when two functionally similar proteins do not share detectable sequence homology, molecular function cannot be inferred based solely on sequence information. Low sequence homology results either from an early branching point at the protein evolution (also known as remote homologues) or a convergent evolution. Many studies were focused on the detection of remote homologues (6-8). In general, methods using statistical models extracted from multiply aligned sequences perform better than pairwise sequence comparison methods (9). However, even these improved methods fail to recognize remote homologues with sequence identity <25-30%, which is estimated to be >25% of all sequenced proteins.
Structure-based function inference, however, depends less on sequence information. During protein evolution, homology on sequence level is far less preserved compared with homology on structure level. Because proteins fold into specific structures to perform their molecular functions, structure-based functional inference is able to characterize remote homologous relationships of proteins that are impossible to detect by using sequences. By using different random sampling methods and similarity measuring functions, a large number of structural alignment algorithms have been developed to measure similarity of a pair of protein structures. Among these algorithms, dali (10), ssap (11), ce (12), and vast (13) have been widely used, and their performances have been assessed [see Koehl (14) for a review].
The issue of predicting the function of remote homologues has become more prominent recently: the Structural Genomics initiative (15-19) aims to determine the representative structures of all protein families in cells. To sample the protein structural space more efficiently, Structural Genomics projects employ various “target selection” strategies to filter out proteins that are homologous to the proteins with structures already in the Protein Data Bank (PDB) (20). As a result, the molecular functions of the proteins targeted by Structural Genomics are often unknown. Once having solved the structure of a novel protein, a researcher usually searches the protein structure databases, using software tools such as the dali online server (10), for structurally related proteins and infers the molecular functions based on its structural neighbors. However, when a protein has a novel fold, its function cannot be inferred based on proteins of known structure. This work proposes a method to infer functions of the proteins with new folds based on the map distance of the protein structure space.
In our earlier study (21) of mapping the “protein fold space,” we built a 3D representation of the protein fold space based on the pairwise structural dissimilarities among the 498 most common protein fold domains [Structural Classification of Proteins database (scop); ref. 22] by using a multidimensional scaling (MDS) (23, 24) procedure. Now, we have extended the method to a nonredundant protein structure data set from pdb_select (25, 26) and constructed a “protein structure space” map. We noticed that proteins sharing similar molecular functions are located in the vicinity of each other in the structure space map (SSM). This observation suggests a previously undescribed scheme to infer protein function based on the distances in the SSM, especially for those with new folds.
Because of the high-level abstraction, the distance measure in the protein fold space can capture functional similarity that cannot be detected by the dali structure similarity score when structure alignment is of poor quality or the aligned pair has different fold. To test this hypothesis, we compared the SSM distances, dali similarity scores, and dali Z-scores to test their ability to identify 20 protein families of similar molecular functions. The functional inference scheme based on the SSM distances is shown to outperform the schemes based on other scores.
Methods
pdb_select 25 Data Set. The 498 domain-based data sets in our earlier study (21) was composed of one representative structure from each of 498 scop fold families (22) and thus subject to possible human bias in classification and domain decomposition. In this study, we used the pdb_select 25 data set (released December, 2002), a representative subset of the PDB database. This data set was not domain-delineated and its members were screened by sequence identity and structural quality. The set contained 1,949 protein chains with <25% pairwise sequence identity. Of those, 51 chains were further removed because of low resolution or length requirements of the dalilite program (27) that we used to align protein structures. The remaining data set has 1,898 chains.
Mapping of the Protein Structure Space. Similar to the procedures that we previously used to construct the map of the protein fold space (21), the pairwise structural similarity for the 1,898 protein chains was measured with dalilite (27). The calculation took 25,000 central processing unit hours on the IBM SP RS/6000 from National Energy Research Scientific Computing. The 1898 × 1898 similarity score matrix [sij] (where i = 1,...,1898; j = 1,...,1898) was converted to dissimilarity matrix [dij] by using
 |
where s99.95 is the 99.95th percentile of the distribution of all off-diagonal sij values (i.e., i ≠ j). The dissimilarity matrix then was subjected to classical MDS procedure to project data into lower dimensions. We used s99.95 to normalize the few exceedingly large similarity scores to prevent them from dominating the final structural map.
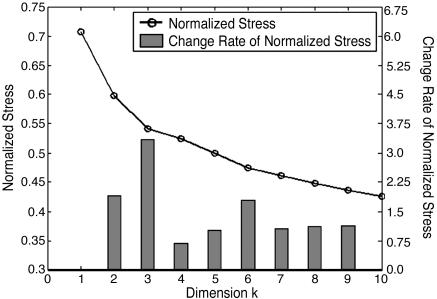
To facilitate a meaningful interpretation of the high-dimensional data using lower-dimension projection, we evaluated the minimum dimensions required to capture the essential features of the data. Specifically, we examined the “normalized stress” of the MDS procedure with a Scree plot (Fig. 1). Normalized stress (NS) (24) is a measure of how well the original dissimilarities dij agree with Euclidean distances d′ij calculated from the map coordinates xim (ith data point in mth dimension, up to the kth dimension), given by
 |
where
 |
As shown by Fig. 1, incremental decrease in NS is small after third dimension.
Fig. 1.
Scree plot of the MDS results. A Scree plot evaluates the number of dimensions most appropriate to represent high-dimensional data in a low-dimensional space by means of MDS. To measure how fast normalized stress (NS) diminishes, an empirical parameter called the change rate (CR) is defined as CRk = (NSk - NSk-1)/(NSk+1 - NSk). The k that gives the largest CR indicates the optimal number of dimensions for data abstraction. Here, the largest CR occurs at k = 3. Therefore, the first three dimensions of the MDS projection are used to represent the protein structure space.
Identification of Functionally Similar Protein Pairs with Gene Ontology (GO) Database. The pdb_select 25 data set contains several groups of remotely homologous proteins that share similar molecular functions. For functional descriptors, we used the GO Consortium (28) descriptors, which provides structured and comprehensive descriptions of protein functions. For the proteins in the pdb_select 25 data set, families with the top 20 most represented GO functions are given in Table 1. For each GO function family, we compiled all pairwise relationships among the members. For a family of size n, there are n(n-1)/2 pairs. The combined list from the 20 families gave 93,052 pairwise relationships. These relationships formed the data set to test a structure-based protein function inference scheme by using the distances in the protein SSM.
Table 1. Top 20 most populated GO function families among the 1,898-chain data set.
| Rank* | GO number | Population | Function |
|---|---|---|---|
| 1 | 0003677 | 252 | DNA binding |
| 2 | 0005515 | 154 | Protein binding |
| 3 | 0016491 | 129 | Oxidoreductase activity |
| 4 | 0005524 | 126 | ATP binding |
| 5 | 0003723 | 94 | RNA binding |
| 6 | 0006118 | 92 | Electron transport |
| 7 | 0003676 | 87 | Nucleic acid binding |
| 8 | 0003824 | 84 | Catalytic activity |
| 9 | 0005198 | 73 | Structural molecule activity |
| 10 | 0005509 | 68 | Calcium ion binding |
| 11 | 0000287 | 67 | Magnesium ion binding |
| 12 | 0008270 | 66 | Zinc ion binding |
| 13 | 0005489 | 65 | Electron transporter activity |
| 14 | 0004872 | 54 | Receptor activity |
| 15 | 0016798 | 46 | Hydrolase activity, acting on glycosyl bonds |
| 16 | 0004519 | 43 | Endonuclease activity |
| 17 | 0004871 | 43 | Signal transducer activity |
| 18 | 0004672 | 40 | Protein kinase activity |
| 19 | 0004518 | 39 | Nuclease activity |
| 20 | 0004867 | 35 | Serine-type endopeptidase inhibitor activity |
Ranked by population size
Structure-Based Inference of Protein Function. First, pairwise Euclidean distances of all 1,898 chain structures were calculated from coordinates of the protein SSM. Two other scores were compared against SSM distances with respect to their performance in inferring protein functional similarities: dali similarity scores (raw scores) and dali Z-scores. The raw scores and Z-scores were extracted from the dalilite structural alignment algorithm.
Function inference was derived by using the same scheme regardless of the scoring method. Taking the SSM distance-based scoring method, for example, all 1,898 × 1,898 pairwise distances were sorted so that small distances indicated functionally similar pairs of proteins. For a given pair of proteins, if their distance in the structure map was less than a certain threshold, we predicted them to be functionally similar or related. The same procedure was applied for the functional inference by using dali similarity scores and Z-scores, although in the case of similarity scores and Z-scores, higher scores indicate better structural similarity.
In addition to the above-mentioned scores, we have included the blast E-values of pairwise sequence alignment and applied them to the same scheme as sequence-based functional inference. We expected that the sequence-based functional inference would perform worse than other scores, providing a negative reference in the performance evaluation.
Performance Evaluation. Predicted functionally similar pairs were evaluated against the true functionally similar pairs identified from GO database. We examined the performance of four different score-based inference methods with the receiver operating characteristic (ROC) plot (29, 30). The ROC curve plots the true positive fraction among predicted positive pairs vs. the true negative fraction among predicted negative pairs by using a continuously varying decision threshold. It depicts both sensitivity and specificity of a prediction method. In a ROC plot, the diagonal line (0, 0)-(1, 1) denotes prediction methods that produce equal numbers of true positives and false positives uniformly, i.e., a totally random method without any predictive power (31). The further the curves are away above the diagonal line, the better the prediction result is.
Other statistics that can be used to evaluate predictive methods are the ROC scores and the median rate of false positives (mRFP) scores (29, 32). A ROC score is the area under the ROC curve, and it approximates the probability of correct prediction. A ROC score of 1 denotes a perfect prediction that distinguishes all positives from negatives, whereas a ROC score of 0 indicates that no positives are found given any threshold value. The mRFP score represents the fraction of functionally unrelated protein pairs that score as high as or better than the median-scoring positive pairs. Small mRFP scores indicate better prediction.
Results
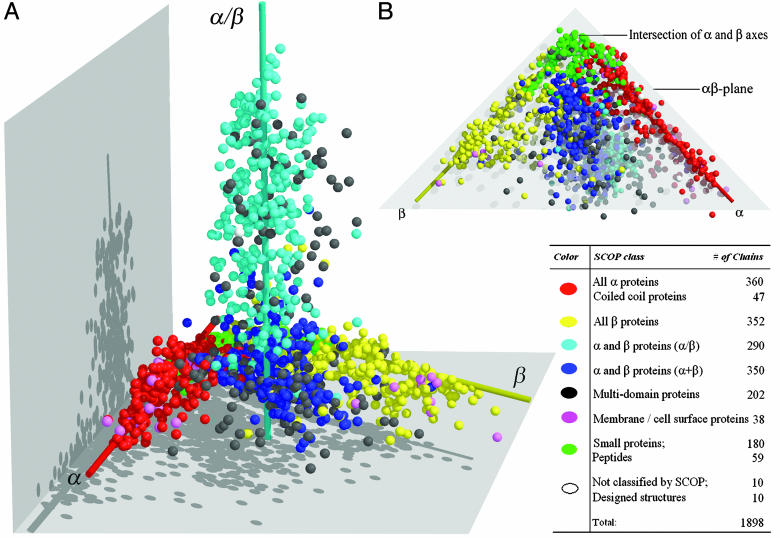
Map of the Protein Structure Space. The structures in the pdb_select 25 data set are based on entire chains and are not subdivided into structural domains, as opposed to the scop database. Of the 1,898 chains, 1,713 have one-to-one correspondence with a specific structure domain in the scop database, and 175 chains are composed of more than one scop domain. In Fig. 2A, each structure is represented by a data point in the protein structure space, colored by seven categories containing one or more scop-defined class. Four scop structure classes were merged into two categories: all α proteins and coiled-coil proteins into one category and small proteins and peptides into another. The 175 chains containing more than one scop domain and 27 structures from scop's multidomain class also were combined to form the “multidomain proteins” category. For convenience, we still refer to these categories as “classes.”
Fig. 2.
Two views of the map of the protein structure space. Each of the 1,898 protein chains is represented by a sphere in the 3D space. (A) α, β, and α/β classes of structures are distributed in three elongated regions centered around three axes, denoted here as the α, β, and α/β axes. The color descriptions and populations for each class category are listed in the lower right. (B) The protein structure space viewed from under the αβ plane. The members from small protein class are represented by green spheres. The intersection of α- and β-class axes is defined as the origin.
The global shape of protein structure space based on the pdb_select 25 data set (Fig. 2 A) appears very similar to the 498-domain fold space (or protein fold space) based on 498 scop domains reported earlier (21). Structures from the α, β, and α/β classes are distributed in three largely nonoverlapping regions, centered around three axes (defined here as the α, β, and α/β axes). The intersection of the α and β axes is defined as the “origin” of the protein structure space (Fig. 2B). As in the fold space, the structures of small protein or peptides are mapped close to the origin. Proteins belonging to five classes (α, β, α+β, small protein, and membrane protein classes) reside in the αβ plane defined by the α and β axes (Fig. 2B). The α/β axis originates from near the geometric center of the αβ plane.
The protein SSM also contains structures of transmembrane proteins that were not represented in the protein fold space map. In Fig. 2, the magenta spheres representing transmembrane proteins scatter around the far ends of both α and β axes away from the origin. This bipartite distribution of the membrane proteins reflects the fact that there are two major types of transmembrane proteins, mainly α and mainly β types.
In addition to transmembrane proteins, the protein structure space also includes multidomain protein structures. Very few multidomain proteins contain structural domains that belong to the same scop classes, and thus most multidomain proteins behave very similarly to single-domain proteins from α/β and α+β classes. They spread over the same area where α/β and α+β classes structures reside.
In Fig. 2B, the protein structures from small protein class (green spheres) populate the region near the origin as we have predicted previously. Note that the same region was scarcely occupied in the protein fold space map because of the exclusion of small protein class. We computationally generated several artificial short stretches of peptides that are randomly structured and incorporated them to the representative data set to map them into the structure space. These random structures mapped very close to the origin (data not shown).
Colocalization of Functionally Similar Proteins in the Protein SSM. A preliminary test was conducted to examine whether SSM distances indicate functional similarity. The members within a superfamily of the scop database share similar structures and related molecular functions (22, 23). Compared with GO function notations, scop superfamily-defined function families have fewer members (among 1,898 chains, the members of the top 10 most populated superfamilies range from 16 to ≈37) and thus more convenient for manual inspection. However, in later experiments that evaluate the performance of function inference methods, the more comprehensive GO-defined functionally similar pairs will be used.
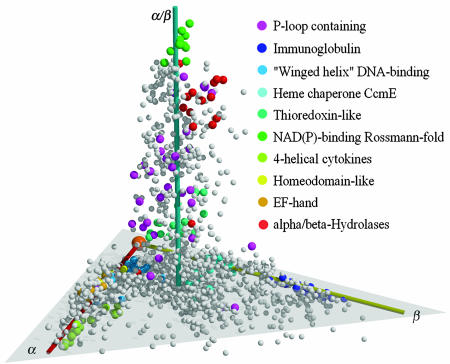
Protein chains that have one-to-one correspondence with scop domains are associated with scop's superfamilies, and the protein structure space is colored by the top 10 most-populated superfamilies. The most populated superfamily is the P-loop containing the nucleoside triphosphate hydrolase superfamily, with a local sequence motif ([AG]-x(4)-G-K-[ST]) for ATP/GTP binding. P-loop-containing proteins share similar molecular functions, but their structures vary extensively and thus fail to cluster. However, the resulting map in Fig. 3 still shows clear colocalization of structures that belong to the same scop superfamilies.
Fig. 3.
The top 10 most populated scop superfamilies. The names for superfamilies and their corresponding colors are indicated. Note that with the exception of P-loop-containing nucleoside triphosphate hydrolases, all superfamilies have their members clustered together. P-loop-containing proteins are more spread out because they are defined by a shared sequence motif rather than global structure similarity.
Structure-Based Function Inference Based on Protein SSM Distances. As mentioned in Methods, SSM distances were compared against three other measures, original dali similarity scores and Z-scores and sequence-based blast scores, for their performance in inferring protein functional similarities. The GO definitions of functions were used to indicate functional similarity between two proteins.
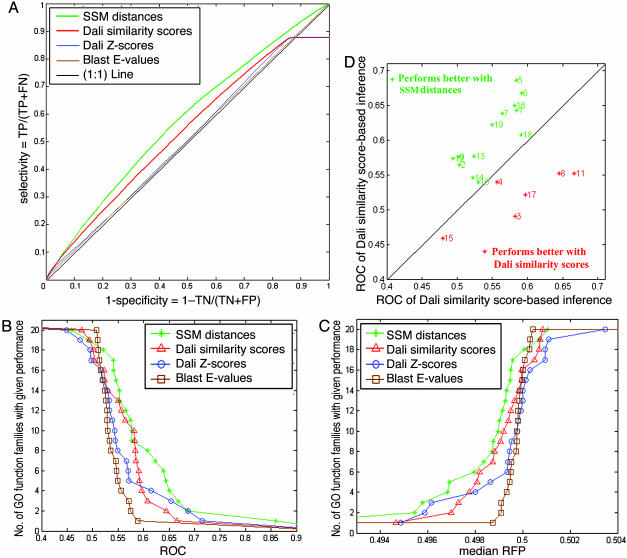
Fig. 4A displays the ROC curves that correspond to the performance of four functional inference methods, based on the SSM distances (green), dali similarity scores (red), dali Z-scores (blue), and blast E-values (brown), respectively. Functional inference made from the SSM distances performed consistently better than those made by other scores.
Fig. 4.
Performance of structure-based function inference. (A) ROC plot of the performance of function inference. TP, true positives; FP, false positives; TN, true negatives; FN, false negatives. The green curve denotes ROC curve of the SSM distance-based function inference. The 1:1 line (black),dali Z-score curve (blue), and blast E-value curve (brown) are close to each other in the x-axis range of 0.2-0.9. Red, dali similarity score. (B and C) Relative performance of functional inference methods. Each graph plots the total number of GO function families for which a given method exceeds a cutoff of ROC (B) or mRFP (C) value (32). Large ROC scores and small mRFP scores indicate better performances of an inference method. (D) GO-family-specific performance of the SSM distance-based functional inference and dali similarity score-based functional inference. The green and red asterisks denote families for which the SSM distances and dali similarity scores performed better, respectively. The number to the right of each asterisk indicates the GO family number as listed in Table 1. The 20th family (ROC value 0.84 for map distance and 0.65 for dali similarity score) is not shown in the plot for presentation purposes.
The blast E-value-based curve roughly coincides with the 1:1 line (black), which indicates very limited predictive power. This result was expected because sequence similarities among the pdb_select entries are very low (<25%). dali Z-score performed modestly better than blast E-values, and the reason for this poor performance is the normalization method used by dali Z-scores. The dali Z-scores are weighted by the lengths of protein chains. When one or both proteins are large, the Z-score becomes comparatively small. Therefore, even if two proteins share considerable local structure similarity (and thereby possible functional similarity), Z-score-based functional inference fails to detect them.
The curves that correspond to dali similarity score- and Z-score-based inference display an unusual platform close to the upper right corner of Fig. 4A. This artifact resulted from the dalilite program, which assigns zero similarity score for a pair of structures with very low structural similarity. In the dali similarity score matrix, ≈10% of all pairwise scores were assigned zeros. Therefore, when specificity is close to zero, (that is, the prediction threshold is very low and almost all pairs are predicted to be functionally similar), the sensitivity (or the fraction of true positives) no longer increases. However, such a low specificity is outside the useful range allowed for practical applications. This artifact does not interfere with the conclusion that SSM distance-based function inference performs best among all four methods.
GO Function Family-Specific Performance. To examine the GO function family-specific performance, the ROC and mRFP scores were further evaluated for each GO function family.
Fig. 4 B and C shows the relative performance of all four functional inference methods ranged over all 20 GO function families. Both ROC and mRFP scores indicate better performance for the SSM distances-based inference method over other methods. The mRFP scores (Fig. 4C) of the SSM distances are better than other methods for almost all GO-function families. These results are consistent with the ROC curve shown in Fig. 4A.
In Fig. 4D, GO-family-specific performances of the SSM distance-based functional inference and dali similarity score-based functional inference are displayed in a scatter-plot with respect to their ROC scores. The SSM distances performed better in 14 of 20 families, whereas dali similarity score did better in 6 families. The scatterplot based on mRFP scores (data not shown) gave similar results.
Discussion
In this study, we constructed a “map” of the protein structure space with 1,898 protein chains from the pdb_select data set. This data set contains 1,898 nonredundant protein chains, a number much larger than the number of representative protein fold domains used to build our previous fold space map (21). Yet, both maps show similar “envelope” and trend of distribution, albeit with different distribution densities. In particular, the protein structures from three additional categories (namely multidomain, membrane, and small protein) are included without bringing distortion to the demographic distribution. We predict that the conceptual SSM that would include all protein structures would have the same essential features.
We also presented a method that used the distances in the protein SSM to predict functionally similar protein pairs, especially for those proteins whose functions are difficult to predict based on sequence or fold similarity. The SSM distances outperformed dali similarity scores in detecting functional similarity between proteins that share limited structural resemblance. It improved functional annotation performance of existing structural alignment programs by emphasizing local structural relationships that often were buried by noises in the global alignment score.
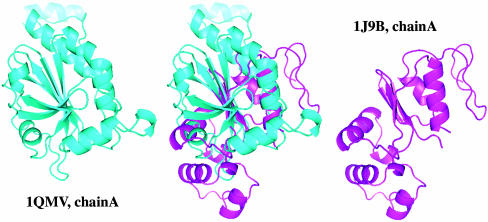
One of the examples that demonstrates the advantage of the SSM distance-based function inference method is the prediction of two proteins of the GO family 0016491, “oxidoreductase activity.” Given a map distance threshold that predicts the top 5% pairs to be functionally similar, chain A of the protein with PDB ID 1qmv and chain A of PDB 1j9b were predicted successfully. However, dali alignment similarity score and Z-score are 242.3 and 1.7, respectively. Therefore, the dali algorithm will assign them as structurally different proteins. Moreover, dali structural similarity matrix fails to rank them within the top 5% most similar pairs. Structural alignment between these two proteins is shown in Fig. 5.
Fig. 5.
Alignment of two structurally dissimilar but functionally similar proteins within the oxidoreductase GO-function family. The SSM distance-based function inference successfully placed this pair among the top 5% of all 1,898 × 1,898 pairs.
When MDS is used to map the protein structure space, the position of a structure in the space is not based on the highest similarity score, but instead based on the similarity and, to some extent, dissimilarity between the structure and every other protein structure in the data set. In other words, a high similarity score alone is not sufficient to put a pair of structures close to each other in the structure space. On the contrary, modest but consistent similarities among a group of structures will place them within the same neighborhood. Therefore, the difference between structural space-based function inference and pairwise structure comparison is analogous to the difference between profile-based homology search and pairwise sequence alignment. This difference underlies the improved performance of the SSM distances over dali similarity scores in the structure-based function prediction.
Acknowledgments
We thank Dr. Liisa Holm for the dalilite workbench and Dr. In-Geol Choi and Greg E. Sims for insights, ideas, suggestions, and numerous discussions. This work was supported by National Science Foundation Grant DBI-0114707 and National Institutes of Health Protein Structure Initiative Grant GM62412.
Author contributions: J.H., C.Z., and S.-H.K. designed research; J.H., S.-R.J., and S.-H.K. performed research; J.H. contributed new reagents/analytic tools; J.H., S.-R.J., C.Z., and S.-H.K. analyzed data; and J.H. and S.-H.K. wrote the paper.
Abbreviations: GO, Gene Ontology; MDS, multidimensional scaling; mRFP, median rate of false positives; ROC, receiver operating characteristic; SCOP, Structural Classification of Proteins database; SSM, structure space map.
References
- 1.Altschul, S. F., Madden, T. L., Schaffer, A. A., Zhang, J., Zhang, Z., Miller, W. & Lipman, D. J. (1997) Nucleic Acids Res. 25, 3389-3402. [DOI] [PMC free article] [PubMed] [Google Scholar]
- 2.Bucher, P. & Bairoch, A. (1994) Proceedings of the Second International Conference on Intelligent Systems for Molecular Biology, eds. Altman, R., Brutlag, D., Karp, P., Lathrop, R. & Searls, D. (AAAI Press, Menlo Park, CA), pp. 53-61.
- 3.Hulo, N., Sigrist, C. J., Le Saux, V., Langendijk-Genevaux, P. S., Bordoli, L., Gattiker, A., De Castro, E., Bucher, P. & Bairoch, A. (2004) Nucleic Acids Res. 32, D134-D137. [DOI] [PMC free article] [PubMed] [Google Scholar]
- 4.Sonnhammer, E. L., Eddy, S. R. & Durbin, R. (1997) Proteins 28, 405-420. [DOI] [PubMed] [Google Scholar]
- 5.Sonnhammer, E. L., Eddy, S. R., Birney, E., Bateman, A. & Durbin, R. (1998) Nucleic Acids Res. 26, 320-322. [DOI] [PMC free article] [PubMed] [Google Scholar]
- 6.Eddy, S. R. (1998) Bioinformatics 14, 755-763. [DOI] [PubMed] [Google Scholar]
- 7.Jaakkola, T., Diekhans, M. & Haussler, D. (1999) in Proceedings of the Seventh International Conference on Intelligent Systems for Molecular Biology, eds. Lengauer, T., Schneider, R., Bork, P., Brutlag, D., Glasgow, J., Mewes, H.-W. & Zimmer, R. (AAAI Press, Menlo Park, CA), pp. 149-159.
- 8.L. Liao & Noble, W. S. (2002) in Proceedings of the Sixth International Conference on Computational Molecular Biology, ed. Lengauer, T. (ACM, New York), pp. 225-232.
- 9.Eddy, S. R. (1995) in Proceedings of the Third International Conference on Intelligent Systems for Molecular Biology, eds. Rawlings, C., Clark, D., Altman, R., Hunter, L., Lengauer, T. & Wodak, S. (AAAI Press, Menlo Park, CA), pp. 114-120.
- 10.Holm, L. & Sander, C. (1993) J. Mol. Biol. 233, 123-138. [DOI] [PubMed] [Google Scholar]
- 11.Orengo, C. A. & Taylor, W. R. (1996) Methods Enzymol. 266, 617-635. [DOI] [PubMed] [Google Scholar]
- 12.Shindyalov, I. N. & Bourne, P. E. (1998) Protein Eng. 11, 739-747. [DOI] [PubMed] [Google Scholar]
- 13.Gibrat, J. F., Madej, T. & Bryant, S. H. (1996) Curr. Opin. Struct. Biol. 6, 377-385. [DOI] [PubMed] [Google Scholar]
- 14.Koehl, P. (2001) Curr. Opin. Struct. Biol. 11, 348-353. [DOI] [PubMed] [Google Scholar]
- 15.Kim, S. H. (1998) Nat. Struct. Biol. 5, Suppl., 643-645. [DOI] [PubMed] [Google Scholar]
- 16.Chothia, C. (1992) Nature 357, 543-544. [DOI] [PubMed] [Google Scholar]
- 17.Zhang, C. & Kim, S. H. (2003) Curr. Opin. Chem. Biol. 7, 28-32. [DOI] [PubMed] [Google Scholar]
- 18.Lattman, E. (2004) Proteins 54, 611-615. [DOI] [PubMed] [Google Scholar]
- 19.Teichmann, S. A., Chothia, C. & Gerstein, M. (1999) Curr. Opin. Struct. Biol. 9, 390-399. [DOI] [PubMed] [Google Scholar]
- 20.Berman, H. M., Battistuz, T., Bhat, T. N., Bluhm, W. F., Bourne, P. E., Burkhardt, K., Feng, Z., Gilliland, G. L., Iype, L., Jain, S., et al. (2002) Acta Crystallogr. D 58, 899-907. [DOI] [PubMed] [Google Scholar]
- 21.Hou, J., Sims, G. E., Zhang, C. & Kim, S. H. (2003) Proc. Natl. Acad. Sci. USA 100, 2386-2390. [DOI] [PMC free article] [PubMed] [Google Scholar]
- 22.Murzin, A. G., Brenner, S. E., Hubbard, T. & Chothia, C. (1995) J. Mol. Biol. 247, 536-540. [DOI] [PubMed] [Google Scholar]
- 23.Hadley, C. & Jones, D. T. (1999) Structure Folding Design 7, 1099-1112. [Google Scholar]
- 24.Williams, C. K. I. (2002) Machine Learning 46, 11-19. [Google Scholar]
- 25.Boberg, J., Salakoski, T. & Vihinen, M. (1992) Proteins 14, 265-276. [DOI] [PubMed] [Google Scholar]
- 26.Hobohm, U. & Sander, C. (1994) Protein Sci. 3, 522-524. [DOI] [PMC free article] [PubMed] [Google Scholar]
- 27.Holm, L. & Park, J. (2000) Bioinformatics 16, 566-567. [DOI] [PubMed] [Google Scholar]
- 28.Harris, M. A., Clark, J., Ireland, A., Lomax, J., Ashburner, M., Foulger, R., Eilbeck, K., Lewis, S., Marshall, B., Mungall, C., et al. (2004) Nucleic Acids Res. 32, D258-D261. [DOI] [PMC free article] [PubMed] [Google Scholar]
- 29.Gribskov, M. & Robinson, N. (1996) Computers Chem. 20, 25-33. [DOI] [PubMed] [Google Scholar]
- 30.Grundy, W. & Bailey, T. (1999) Bioinformatics 15, 463-470. [DOI] [PubMed] [Google Scholar]
- 31.Pazos, F. & Sternberg, M. J. (2004) Proc. Natl. Acad. Sci. USA 101, 14754-14759. [DOI] [PMC free article] [PubMed] [Google Scholar]
- 32.Hou, Y., Hsu, W., Lee, M. L. & Bystroff, C. (2003) Bioinformatics 19, 2294-2301. [DOI] [PubMed] [Google Scholar]


