ABSTRACT
The tumor microenvironment has been identified as a major mediator of immunological processes in solid tumors. In particular, tumor-associated fibroblasts are known to interact with tumor infiltrating immune cells. We describe the influence of fibroblasts and tumor-microenvironment-derived cytokines on the infiltration capacity of CD3+CD8+ cytotoxic T lymphocyte subpopulations using a multicellular 3D co-culture system. 3D tumor microtissues were cultivated using a hanging drop system. Human A549 and Calu-6 cancer cell lines were incubated alone or together with the human fibroblast cell line SV80 for 10 d to form microtissues. On day 10, peripheral blood mononuclear cells (PBMC) were added with or without cytokine stimulation for 24 h. Infiltrating PBMC subpopulations were investigated by flow cytometry. Aggregation of the microtissues and the infiltration of the PBMCs were analyzed by immunohistochemistry, and endogenous cytokine and chemokine expression was analyzed with a multi-cytokine immunoassay. Secretion of chemokines is increased in microtissues consisting of cancer cells and fibroblasts. PBMC infiltrate the whole spheroid in cancer cell monocultures, whereas in co-cultures of cancer cells and fibroblasts, PBMCs are rather localized at the margin. Activated CD69+ and CD49d+ T lymphocytes show an increased microtissue infiltration in the presence of fibroblasts. We demonstrate that the stromal component of cancer microtissues significantly influences immune cell infiltration. The presence of fibroblasts in cancer microtissues induces a shift of T lymphocyte infiltration toward activated T lymphocytes.
KEYWORDS: 3D, biomarker, cancer, co-culture, cytokines, immune cells, infiltration, microenvironment, subpopulation
Introduction
The tumor microenvironment has been identified as a major mediator of immunological processes in solid tumors. Among the various cellular components of the microenvironment, tumor-associated fibroblasts are suspected to interact with tumor infiltrating immune cells.1
These tumor infiltrating leukocytes are deeply involved in immunomodulatory processes.2,3 For instance, subpopulations of tumor-associated macrophages (TAM) can conduct both immune surveillance through interferon-γ activated M1 macrophages and immune escape via transforming growth factor β (TGFβ) induced M2 macrophages. Moreover, an increased number of the CD3+CD8+ cytotoxic T cells within a tumor is associated with a better prognosis and a higher overall survival in cancer patients.4,5
The CD3+CD8+ T lymphocyte population splits up into a lineage descending from naïve T lymphocytes, over memory T lymphocytes to terminally differentiated effector T lymphocytes.6 More differentiated stages of T lymphocytes such as, for example, effector memory T cells are considered to be central mediators of immunological tumor surveillance and infiltration of these subpopulations is known to correlate with a higher benefit due to a decreased risk of early metastasis.7 Currently, the influence of the tumor microenvironment on these CD3+CD8+ subpopulations regarding their tumor infiltration capacity is not satisfactorily understood. Therefore, the identification of factors within the microenvironment interacting with T lymphocytes subpopulations might result in defining potential targets for immunotherapeutic agents.
Specific immune cell subpopulations are regulated by different cytokines. Such soluble factors are often derived from tumor-associated stromal cells such as fibroblasts8,9 and can induce certain immune system-related anticancer effects.10 For example, Interleukin-6 (IL-6), a strong promoter of inflammatory responses in the tumor mediated by the innate immune system in form of neutrophils, and tumor necrosis factor α (TNF-α), a central mediator of various innate and adaptive immunological processes, are known to be descending from cancer-associated stromal cells11 and represent a crucial part of the intercellular communication between stromal cells, immune cells and cancer cells.12 Recent studies also proved the importance of other cytokines such as IL-5, IL-12 or TNF-α for the interaction of the immune system and cancer tissues.13 Moreover, specific chemokines are crucially involved in the interaction of the tumor microenvironment and infiltrating immune cells. Chemokines targeting CD3+C8+ cytotoxic T lymphocytes, such as CX3CL1 or CXCL9, are of interest as these cells are highly involved in tumor surveillance mediated by the immune system.14,15
Therefore, the investigation of the interaction of tumor-associated fibroblasts with immune cells within the tumor microenvironment is expected to provide us with novel insights and may lead to the development of novel therapeutic approaches.
We generated multicellular 3D microtissues to investigate the interaction between cancer cells, stromal cells and immune cells. Microtissues consisting of cancer cells alone or together with fibroblasts were cultivated followed by co-incubation of the preformed microtissues with immune cells to detect immune cell infiltration. With this approach, differences between cancer cell microtissues and cancer cell/fibroblast microtissues regarding the infiltration of lymphocytes subpopulations were analyzed. Furthermore, microtissues were evaluated regarding the presence of specific cytokines and chemokines. Finally, endogenous cytokines were artificially added in higher concentrations to validate the influence of these tumor-microenvironment-derived cytokines on the infiltration of immune cell subpopulations.
Results
Cytokine secretion patterns
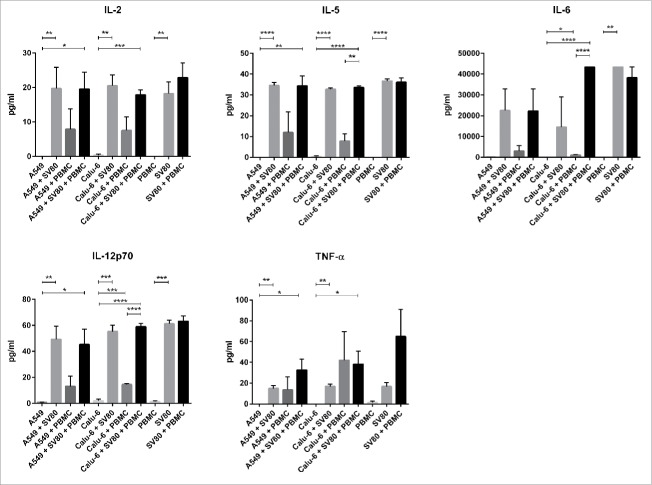
Cytokine expression patterns differed between mono-, co- and tri-cultures regarding TNF-α, IL-2, IL-5, IL-6 and IL-12p70. IFNγ and IL-4 concentrations were below the detection limit in all cultures. The p values for significant results are shown in the supplementary file (Sup. 1).
A549 and Calu-6 monocultures secreted none of the analyzed cytokines and peripheral blood mononuclear cells (PBMC) alone only produced minimal amounts of IL-12 p70 and TNF-α. In contrast, SV80 monocultures expressed TNF-α, IL-2, IL-5, IL-6 and IL-12p70 in detectable amounts (Fig. 1).
Figure 1.
Secretion of cytokines in cancer microtissues. Mono-, co- and tri-culture microtissues of A549 and Calu-6 cancer cells with SV80 fibroblasts and PBMCs were screened for the secretion of IL-2, IL-4, IL-5, IL-6, IL-12p70, IFNγ and TNFα. Therefore, supernatant of the microtissues was analyzed with a multiplex immunoassay. No expression of IL-4 and IFNγ was detected in any approach. IL = Interleukin; IFNγ = Interferonγ; PBMC = peripheral blood mononuclear cells; TNFα = tumor necrosis factor α. (n = 3) (*p < 0.05, **p < 0.005, ***p < 0.0005, ****p < 0.0001).
In both A549/SV80 and Calu-6/SV80 co-cultures, concentrations of the cytokines TNF-α, IL-2, IL-5, IL-6 and IL-12p70 had similar levels as in SV80 monocultures. Also, SV80/PBMC co-cultures showed no increased secretion of cytokines compared to SV80 monocultures. Although monocultures of A549, Calu-6 and PBMCs alone showed no secretion of cytokines, co-cultures of cancer cells and PBMCs displayed detectable levels of cytokines. Secretion of TNF-α, IL-2, IL-5, IL-6 and IL-12p70 was increased in A549/PBMC microtissues, to some extent, although not significantly. In contrast, Calu-6/PBMC co-cultures showed enhanced concentrations of IL-6 and IL-12p70 (Fig. 1, Sup. 1).
Compared to A549 and Calu-6 monocultures, all cytokines except of IL-6 were significantly increased in A549/SV80/PBMC tri-cultures, whereas in Calu-6/SV80/PBMC tri-cultures all cytokines were significantly increased. A549/SV80/PBMC tri-cultures showed no significant difference to A549/PBMC co-cultures, but in Calu-6/SV80/PBMC tri-cultures the concentration of IL-5, IL-6 and IL-12 was significantly increased compared to Calu-6/PBMC microtissues (Fig. 1, Sup. 1).
Chemokine secretion patterns
The chemokines 6Ckine/CCL21, BCA-1/CXCL13, CTACK/CCL27, Fractalkine/CX3CL1, I-TAC/CXCL11, MCP-1/CCL2, MIG/CXCL9, MIP-3ß/CCL19, SDF-1a/ß/CXCL12, TARC/CCL17 and TECK/CCL25 were detected in our experimental approaches (Fig. 2). The p values for significant results are shown in the supplementary file (Sup. 2 and 3).
Figure 2.
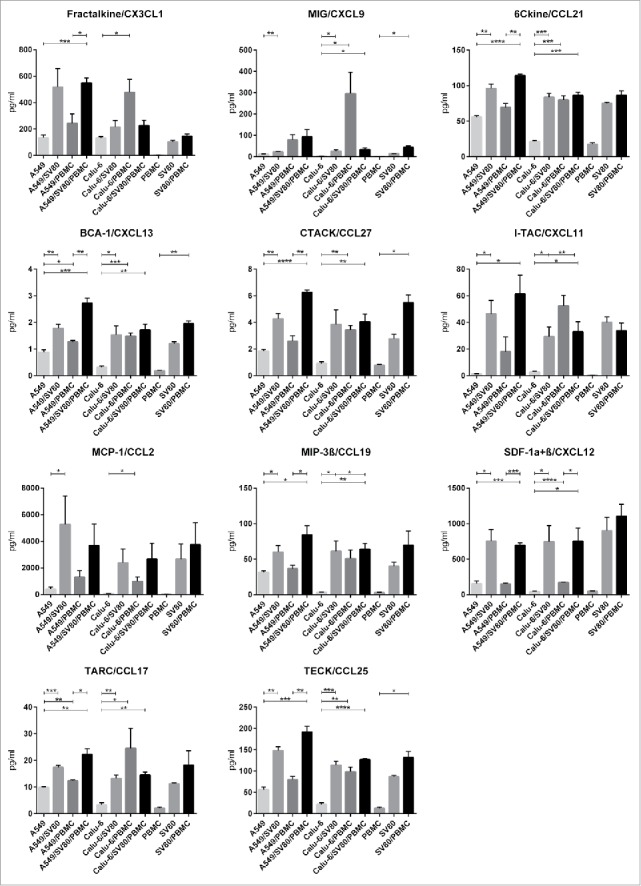
Secretion of chemokines in cancer microtissues. Mono-, co- and tri-culture microtissues of Calu-6 and A549 cancer cells with SV80 fibroblasts and PBMCs were screened for the secretion of Fractalkine/CX3CL1, MIG/CXCL9, 6Ckine/CCL21, BCA-1/CXCL13, CTACK/CCL27, I-TAC/CXCL11, MCP-1/CCL2, MIP-3β/CCL19, SDF-1α+β/CXCL12, TARC/CCL17 and TECK/CCL25. Therefore, supernatant of the microtissues was analyzed with a multiplex immunoassay. (n = 3) (*p < 0.05, **p < 0.005, ***p < 0.0005, ****p < 0.0001).
In PBMC monocultures, hardly any chemokines were secreted, especially CX3CL1, CXCL9 and CCL2 were not detectable. In SV80 monocultures, all chemokines were expressed (Fig 2). With exception of CXCL11, all cytokines were increased in SV80/PBMC co-cultures compared to SV80 monocultures, whereby CXCL9, CXCL13, CCL27 and CCL25 showed significant results (Fig. 2, Sup. 2).
When compared with A549 monocultures, all chemokine except CX3CL1 were significantly increased in A549/SV80 co-cultures. In contrast, only CXCL13 and CCL27 were significantly increased in A549/PBMC co-cultures compared to A549 monocultures (Fig. 2, Sup. 2). Comparing Calu-6 monocultures with Calu6/SV80 co-cultures, secretion of CXCL9, CCL21, CXCL13, CXCL11, CCL19, CXCL12, CCL17 and CCL25 was significantly increased in the co-cultures (Fig. 2, Sup. 3). In Calu6/PBMC co-cultures, all chemokines were significantly increased compared to Calu-6 monocultures (Fig. 2, Sup. 3).
Comparing A549 monocultures with A549/SV80/PBMC tri-cultures, the chemokines CX3CL1, CCL21, CXCL13, CCL27, CXCL11, CCL19, CXCL12, CCL17 and CCL25 were significantly upregulated in the tri-cultures. Finally, by comparing A549/PBMC co-cultures with A549/SV80/PBMC tri-cultures, secretion of all measured chemokines was significantly increased in the tri-cultures with exception of CXL9, CXCL11 and CCL2 (Fig. 2, Sup. 2). Regarding Calu-6/SV80/PBMC tri-cultures, all chemokines except CX3CL1 and CCL2 were significantly increased compared to Calu-6 monocultures. Compared to Calu-6/SV80 co-cultures, only CXCL12 was increased in Calu-6/SV80/PMBC tri-cultures (Fig. 2, Sup. 3).
Immune cell subpopulations in co- and tri-cultures
Lymphocytes and monocytes
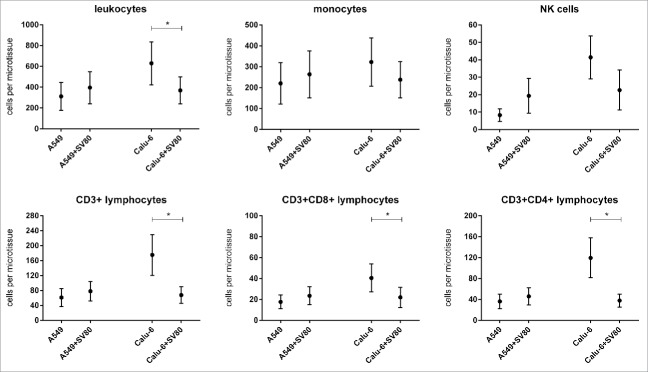
Compared to A549/PBMC co-cultures, no differences of the amount of infiltrating CD14− lymphocytes and CD14+ monocytes were found in A549/SV80/PBMC tri-cultures. In Calu-6/SV80/PBMC tri-cultures, the amount of leukocytes was significantly decreased compared to Calu-6/PBMC co-cultures (p = 0.0298, Fig. 3). No significant changes of B lymphocytes were observed in both cell lines.
Figure 3.
Differences of microtissue infiltrating major PBMC subpopulations in cancer cell monocultures and cancer cell/fibroblast co-cultures. To investigate the influence of tumor associated fibroblasts on immune cell infiltration, microtissue infiltrating major PBMC subpopulations were compared in microtissues consisting of A549 or Calu-6 with or without fibroblasts. Microtissues were co-incubated with PBMCs for 24 h. PMC = peripheral blood mononuclear cells. (n = 4) (*p < 0.05, **p < 0.005, ***p < 0.0005, ****p < 0.0001).
NK cells
Regarding the infiltration of NK cells, no significant differences between co-cultures and tri-cultures were seen in both the A549 and Calu-6 cell line (Fig. 3). Activated CD69+ NK cells were significantly increased in A549/SV80 co-cultures compared to A549 monocultures (p = 0.0335, Fig. 5).
Figure 5.
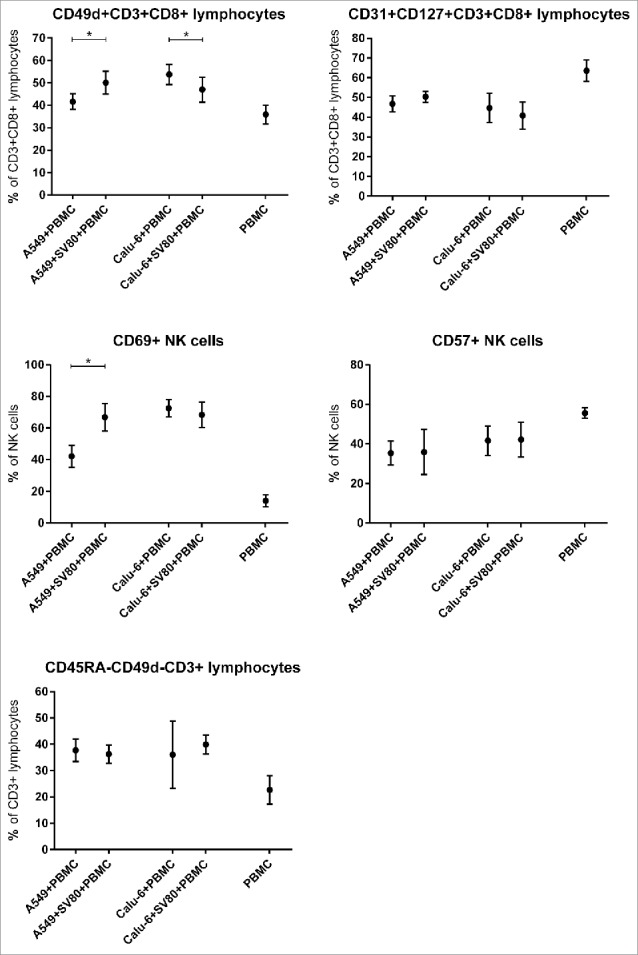
Differences of microtissue infiltrating CD3+CD8+ T lymphocyte and NK cell subpopulations in cancer cell monocultures and cancer cell/fibroblast co-cultures. To investigate the influence of tumor-associated fibroblasts on CD3+CD8+ T lmyphocyte and NK cell supopulations, microtissue infiltrating CD3+CD8+ T lymphocyte and NK cell subpopulations were compared in microtissues consisting of A549 or Calu-6 with or without fibroblasts. Microtissues were co-incubated with PBMCs for 24 h. PMC = peripheral blood mononuclear cells. (n = 4) (*p < 0.05, **p < 0.005, ***p < 0.0005, ****p < 0.0001).
CD3+ T lymphocytes
When compared to A549/PBMC co-cultures, the infiltration of CD3+ lymphocytes in A549/SV80/PBMC tri-cultures showed no difference (Fig. 3). In contrast, Calu-6/SV80/PBMC tri-cultures showed a significantly decrease of infiltrating CD3+ lymphocytes compared to Calu-6/PBMC co-cultures (p = 0.0298; Fig. 3).
CD3+CD4+ and CD3+CD8+ T lymphocytes
The infiltration of CD3+CD8+ lymphocytes in A549/SV80/PBMC tri-cultures showed no difference to A549/PBMC co-cultures (Fig. 3). Also for CD3+CD4+ lymphocytes no differences between A549 co-cultures and tri-cultures were observed. In Calu-6/SV80/PBMC tri-cultures, infiltration of CD3+CD4+ and CD3+CD8+ lymphocytes were decreased compared to Calu-6/PBMC co-cultures (p = 0.0369, p = 0.0224; Fig. 3).
CD8+CD3+ T lymphocyte subpopulations
Regarding the different CD8+CD3+ lymphocytes subpopulations, no significant difference between co-cultures and tri-cultures of both A549 and Calu-6 microtissues were observed for CD45RA+CD3+CD8+ and CD45R0+CD3+CD8+ T lymphocytes (Fig. 4). Also CD57+CD3+CD8+ T lymphocytes occurred in the same percentage in A549/SV80/PBMC and Calu-6/SV80/PBMC tri-cultures compared to A549/PBMC and Calu-6/ PBMC co-cultures (Fig. 4)
Figure 4.
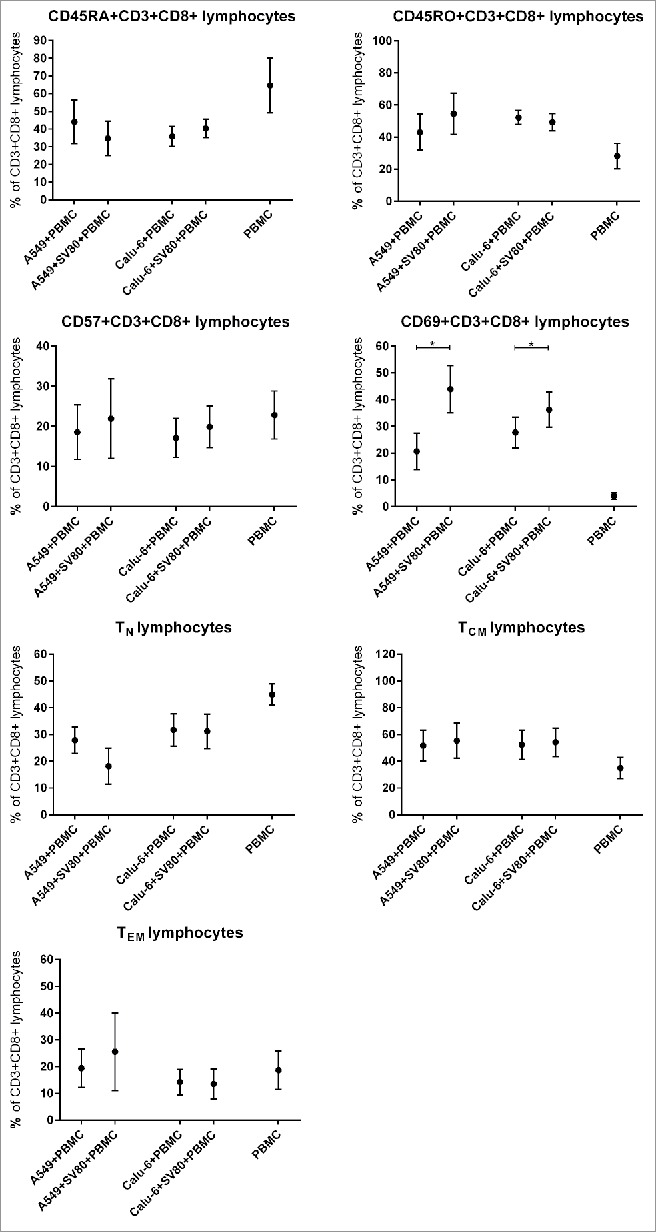
Differences of microtissue infiltrating CD3+CD8+ T lymphocyte subpopulations in cancer cell monocultures and cancer cell/fibroblast co-cultures. To investigate the influence of tumor associated fibroblasts on CD3+CD8+ T lmyphocyte supopulations, microtissue infiltrating CD3+CD8+ T lymphocyte subpopulations were compared in microtissues consisting of A549 or Calu-6 with or without fibroblasts. Microtissues were co-incubated with PBMCs for 24 h. PMC = peripheral blood mononuclear cells, TCM = central memory T cells, TEM = effector memory T cells, TN = naïve T cells. (n = 4) (*p < 0.05, **p < 0.005, ***p < 0.0005, ****p < 0.0001).
Presence of activated CD69+CD3+CD8+ T lymphocytes was significantly increased from 21%, a proportion already much higher than in PBMC not infiltrating the microtissues, to 44% in A549/SV80/PBMC tri-cultures compared to A549/SV80 co-cultures (p = 0.0318). Also in Calu-6/SV80/PBMC tri-cultures, CD69+CD3+CD8+ T lymphocytes were significantly increased from 28% to 36% compared to Calu-6/SV80 co-cultures (p = 0.0321, Fig. 4).
When compared to A549/PBMC co-cultures, the percentage of infiltrating naïve T lymphocytes in A549/SV80/PBMC tri-culture decreased from 27.9% to 18.2%, although the difference were not significant (p = 0.1640; Fig. 4). Regarding the Calu-6 cell line, infiltrating naïve T lymphocytes occurred in the same percentage of CD3+CD8+ lymphocytes in both Calu-6/PBMC co-culture and Calu-6/SV80/PBMC tri-culture (p = 0.8939; Fig. 4).
Regarding the infiltration of TCM and TEM, no significant differences between co-cultures and tri-cultures for both the A549 and Calu-6 cell line were seen (Fig. 4). CD31+CD127+CD3+CD8+ T lymphocytes showed no significant difference between co-cultures and tri-cultures of both cell lines (Fig. 5).
CD49d+CD3+CD8+ T lymphocytes were significantly increased in A549/SV80/PBMC tri-cultures compared to A549/PBMC co-cultures (p = 0.0277), but were decreased in Calu-6/SV80/PBMC tri-cultures compared to Calu-6/ PBMC co-cultures (p = 0.0305, Fig. 5).
No differences in the expression of HLA-DR on CD3+CD8+ T lymphocytes between co-cultures and tri-cultures of both cell lines were observed.
Regulatory T lymphocytes (Treg)
No differences of the infiltration of Treg were observed when co-cultures and tri-cultures were compared (Fig. 6). Regarding the different Treg subpopulations, CD39+CD45RA− Treg and CD49d+ Treg percentages were not altered in tri-cultures compared to the co-cultures (Fig. 6). In contrast, CD45RA+ Treg were significantly increased in Calu-6/SV80/PBMC tri-cultures compared to Calu6/PBMC co-cultures (Fig. 6).
Figure 6.
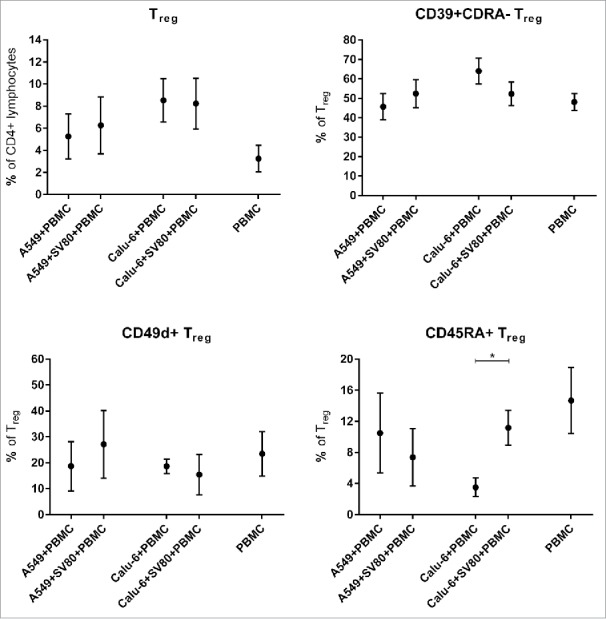
Differences of microtissue infiltrating TReg and TReg subpopulations in cancer cell monocultures and cancer cell/fibroblast co-cultures. To investigate the influence of tumor-associated fibroblasts on TReg and TReg subpopulations, microtissue infiltrating TReg and TReg subpopulations were compared in microtissues consisting of A549 or Calu-6 with or without fibroblasts. Microtissues were co-incubated with PBMCs for 24 h. PMC = peripheral blood mononuclear cells, Treg = regulatory T cells. (n = 4) (*p < 0.05, **p < 0.005, ***p < 0.0005, ****p < 0.0001).
Influence of cytokines on infiltrating PBMC subpopulations
To analyze the effect of TNF-α, IL-2, IL-5 and IL-6 on PBMC subpopulation composition, PBMCs were stimulated with these cytokines for 24 h. The effects on PBMC only approaches are shown in the Fig. 4 of the supplementary file (Sup. 4). No significant alteration of lymphocyte infiltration was observed in both cell lines under stimulation with all cytokines (Fig. 7).
Figure 7.
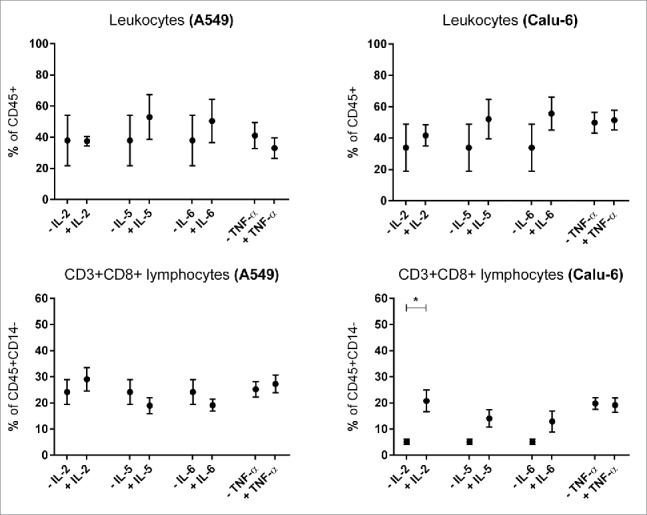
Influence of cytokines on microtissue infiltrating lymhpocytes and CD3+CD8+ T lymphocytes. Fig. 3 shows infiltrating PBMC subpopulations into A549 and Calu-6 microtissues after 24 h. PMC = peripheral blood mononuclear cells. (n = 3) (*p < 0.05, **p < 0.005, ***p < 0.0005, ****p < 0.0001).
Interleukin-2
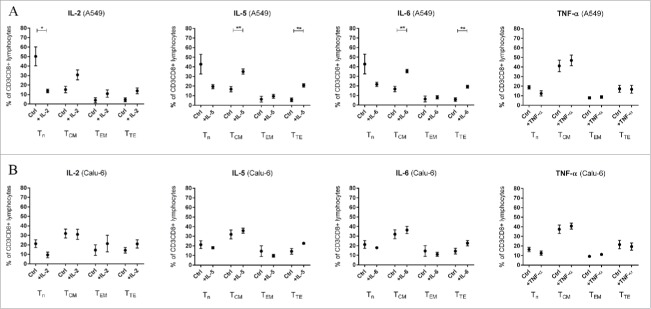
Infiltration of CD3+CD8+ lymphocytes in Calu-6 microtissues was significantly increased under IL-2 stimulation (p = 0.0212, Fig. 7). IL-2 caused a reduced infiltration of naïve T lymphocytes (TN) in A549/PBMC co-cultures. In contrast, effector memory T cells (TEM) and terminal effector T cells (TTE) showed increased percentages, although all results for A549/PBMC co-cultures were not significant (Fig. 8A). In Calu-6/PBMC co-cultures, no difference between the unstimulated control and IL-2 stimulated co-cultures were observed in all subpopulations (Fig. 8B)
Figure 8.
Influence of cytokines on microtissue infiltrating CD3+CD8+ T lymphocyte subpopulations. Fig. 4 shows infiltrating CD3+CD8+ subpopulations into A549 (A) and Calu-6 (B) microtissues after 24 h. PMC = peripheral blood mononuclear cells, TCM = central memory T cells, TEM = effector memory T cells, TN = naïve T cells, TTE = terminal effector T cells. (n = 3) (*p < 0.05, **p < 0.005, ***p < 0.001).
Interleukin-5
Stimulation with IL-5 decreased the amount of TN in A549/PBMC co-cultures although the result was non-significant, whereas the central memory T cells (TCM, p = 0.006) and TTE (p = 0.0024) were significantly increased in IL-5 stimulated A549 co-cultures compared to unstimulated A549/PBMC controls (Fig. 8A). Stimulation with IL-5 caused no significant change of CD3+CD8+ subpopulations in Calu-6/PBMC co-cultures compared to unstimulated controls (Fig. 8B).
Interleukin-6
Similar results as with IL-5 were observed with IL-6 stimulation. IL-6 decreased non-significantly the amount of TN in A549/PBMC compared to unstimulated controls, with a concomitant increase in the percentages of TCM (p = 0.0036) and TTE (p = 0.0031, Fig. 8A). Stimulation with IL-6 caused no significant change in Calu-6/PBMC co-cultures (Fig. 8B).
Tumor necrosis factor-α
Stimulation with TNF-α caused no alteration of CD3+CD8+ subpopulations in both A549/PBMC and Calu-6/PBMC co-cultures (Fig. 8A/8B).
Microtissue architecture
A549/PBMC co-cultures displayed compact tissue architecture with tight cell–cell contacts, although these microtissues possessed a rather asymmetric shape. In contrast, A549/SV80/PBMC tri-cultures showed an almost spherical structure, where E-cadherin positive A549 cancer cells were located at the margin and in the inner core of the microtissue. E-cadherin negative SV80 fibroblasts formed a stromal backbone. A549/PBMC co-cultures revealed infiltration of single PBMCs into the tumor tissue, which were even distributed over the whole spheroid. In A549/SV80/PBMC tri-cultures, PBMCs were concentrated at the margin of the microtissue, in the contact area between the cancer cells and the fibroblasts. Moreover, PBMCs hardly migrated into the core of the microtissue (Fig. 9).
Figure 9.
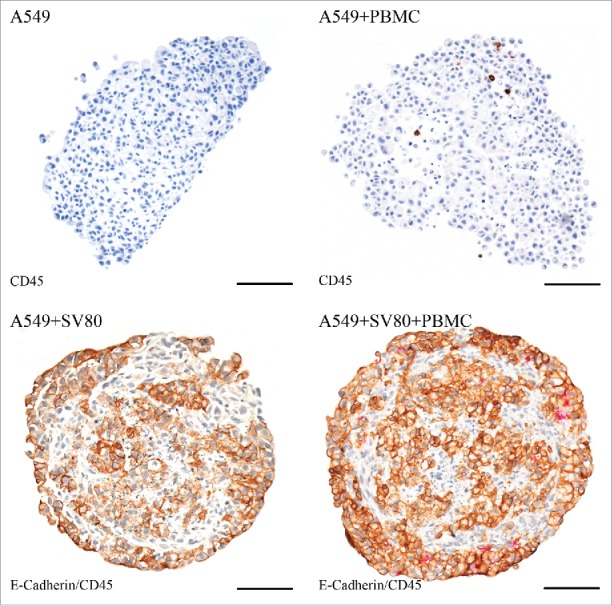
Immunohistochemical staining – A549. Tissue sections were stained on CD45 (red) to visualize infiltrating CD45+ PBMCs in cancer cell and cancer cell/fibroblast microtissues. To discriminate between cancer cells and fibroblasts, a staining on E-cadherin (E-cad, brown) was used to visualize E-cad positive A549 cells (bar = 100 µm).
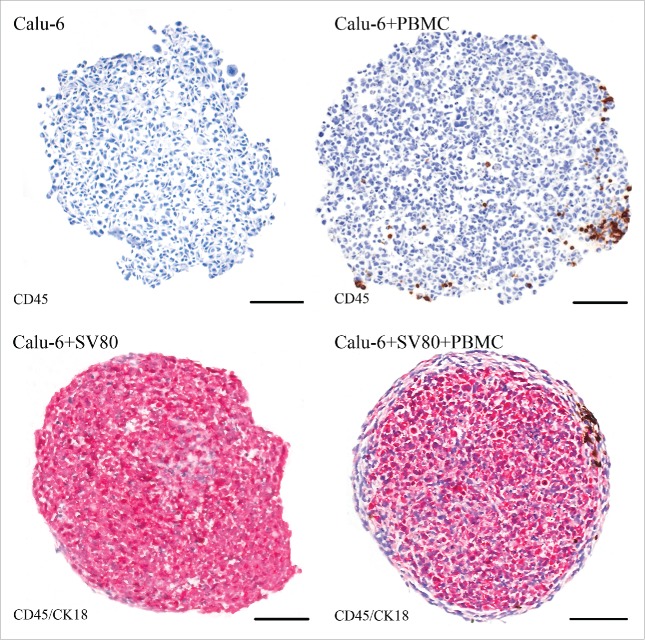
Calu-6/PBMC co-cultures showed compact tissue architecture although with a loose margin and an asymmetric shape. In contrast, Calu-6/SV80/PBMC tri-cultures showed a roundish configuration, where CK18 positive Calu-6 cancer cells were located in the core of the microtissues. CK18 negative SV80 fibroblasts formed an envelope-like fringe around the tumor cells. In Calu-6/PBMC co-cultures, PBMCs were distributed over the whole microtissue. In contrast, Calu-6/SV80/PBMC tri-cultures showed that PBMCs were clustered at the margin of the microtissue in the fibroblasts envelope (Fig. 10).
Figure 10.
Immunohistochemical staining – Calu-6. Tissue sections were stained on CD45 (red) to visualize infiltrating CD45+ PBMCs in cancer cell and cancer cell/fibroblast microtissues. To discriminate between cancer cells and fibroblasts, a staining on cytokeratin 18 (CK18, brown) was used to visualize CK18 positive Calu-6 cells (bar = 100 µm).
To further evaluate the infiltration capacity of CD3+ T lymphocytes and CD8+ T cytotoxic lymphocytes, staining with the respective antibodies was performed. In A549/PBMC co-cultures, only scattered infiltrating CD3+ and CD8+ cells were observed, while in A549/SV80/PBMC tri-cultures an increased amount of CD3+ and CD8+ cells were seen compared to the co-cultures. In both the A549 co- and tri-culture, these cells were located within the center of the microtissue (Fig. 11).
Figure 11.
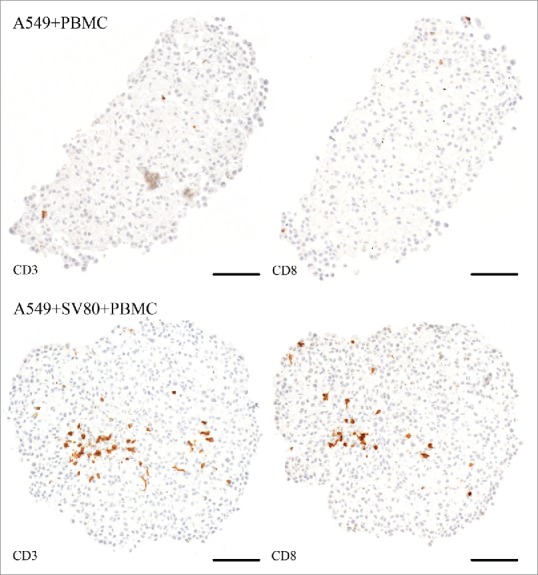
Immunohistochemical staining – CD3 and CD8+ (A549). Tissue sections were stained on CD3 or CD8+ (brown) to visualize infiltrating CD3+ and CD8+ lymphocytes in cancer cell and cancer cell/fibroblast microtissues (bar = 100 µm).
In Calu-6/PBMC co-cultures, CD3+ and CD8+ PBMCs were disseminated over the whole microtissue, whereas in Calu-6/SV80/PBMC tri-culture, CD3+ and CD8+ lymphocytes where rather concentrated at the peripheral area of the microtissue at the contact area between fibroblasts and cancer cells (Fig. 12)
Figure 12.
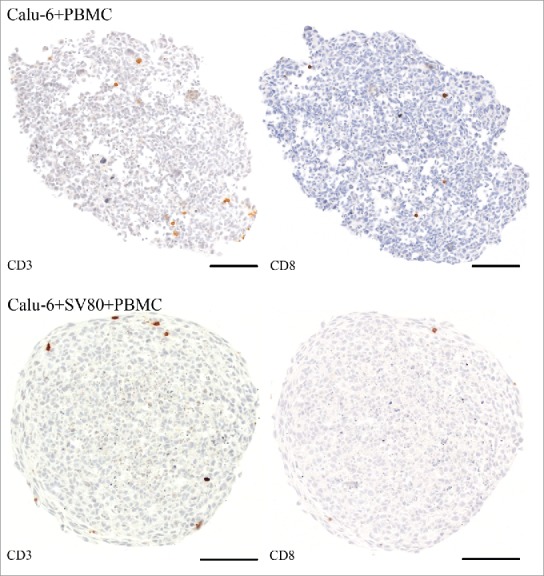
Immunohistochemical staining – CD3 and CD8+ (Calu-6). Tissue sections were stained on CD3 or CD8+ (brown) to visualize infiltrating CD3+ and CD8+ lymphocytes in cancer cell and cancer cell/fibroblast microtissues (bar = 100 µm).
Discussion
Recent studies have proven the increasing prognostic impact of cancer infiltrating lymphocytes16 and represent a new field of cancer treatment which is based on the interaction between cancer tissues and infiltrating immune cells.
As carcinomas such as lung cancer are not a homogenous cluster of cancer cells, but also resemble healthy tissues by consisting of a stromal backbone and a highly active tumor microenvironment, these components contribute to immunological processes within the tumor such as immune cell infiltration. Hereof, a central mechanism in cancer development and progression is the so-called epithelial-to-mesenchymal transition (EMT), which causes epithelial carcinoma cell to obtain a mesenchymal phenotype, what is accompanied by an increased metastatic potential, altered chemosensitivity and changes regarding the interaction with the immune system.17 EMT can be caused by the interaction of the tumor stroma such as mesenchymal fibroblasts with the epithelial-like cancer cells.18 Recent studies showed that EMT causes an altered immune response in cancer tissues by enhancing the expression of markers such as CTLA-4 or PD-L1 and increasing the infiltration of specific CD3+ lymphocyte subpopulations.19 Regarding the EMT, based on our previously published data, an innovative 3D cell culture system was used to generate microtissues consisting of cancer and stromal cells,20 which were then incubated with PBMCs to simulate an in vivo-like tumor infiltration of immune cells.21
Analysis of cytokine expression revealed the SV80 fibroblasts as a primary origin of cytokines, which were constitutively expressed in the co-cultures of cancer cells and tumor cells. These results are supported by recent literature.22 Application of IL-5 and IL-6 reveals a significant increase of TCM and TTE lymphocytes. These data suggest that these cytokines are key mediators of differentiated T lymphocyte infiltration in our model.
Moreover, cancer microtissues comprising a tumor stroma show an increased secretion of chemokines enhancing the migration of T lymphocytes compared to cancer tissues without a stromal backbone. These data indicate that the tumor stroma and its interaction with cancer cells might be crucial for immune cell infiltration in general and particularly for T lymphocytes.
In summary, we demonstrate that our multicellular cell culture system has a viable tumor microenvironment with a functioning intercellular communication via cytokines and chemokines. Therefore, our model system is an adequate model to study the interaction of the tumor microenvironment and infiltrating immune cells.
Differences between solid tumors with high and low stromal components are of major interest, although our understanding of the in vitro and in vivo conditions still remains insufficient. Previous data already suggest that stromal cells modulate T cell behavior in cancer tissues.24
We demonstrate that the presence of fibroblasts within in the tumor microenvironment causes an increased infiltration of activated CD69+CD8+ T lymphocytes. Recent studies already showed that differentiated T lymphocytes such effector memory T cells are the main responsible subpopulations for tumor surveillance.7,22 We provide evidence that the stromal backbone of cancer tissues supports also the infiltration of activated T lymphocytes. Thus, cancer entities consisting of a high stromal component might be more susceptible to antitumor effects mediated by the immune system due to increased infiltration of activated T lymphocytes subpopulations.
Further analysis of specific surface markers on CD3+CD8+ lymphocytes revealed an altered infiltration of CD49d+ cytotoxic T lymphocytes in cancer microtissues consisting of stromal cells and cancer cells. As CD49d, also called Integrin α-4, represents a crucial surface protein for the trans-endothelial invasion and tissue migration mechanism of immune cells, our data suggest that the tumor stroma contributes to the migration process of T lymphocytes into cancer tissues. Compared with cancer microtissues without fibroblasts, microtissues consisting of cancer cells and fibroblasts show an increased secretion of fractalkine (CX3CL1), an interaction partner of the dimeric surface protein complex integrin-α4β1 involving CD49d (integrin-α4).23
These results provide evidence that stromal components of solid tumors actively contribute to cancer immunological processes and support the migration process of CD8+ lymphocytes as well as the infiltration of activated CD8+ T lymphocyte subpopulations. Furthermore, our data suggest that these processes are mediated by the secretion of specific T lymphocyte targeting chemokines, which are increased in the tumor microenvironment due to an intense interaction between cancer cells and fibroblasts.
Cancer tissue architecture represents a crucial element in the pathophysiology of disease progression. Beneath specific aspects such as aberrant blood vessel configuration, the localization of cancer cells and stromal cells in the cancer tissue contribute to altered immune cells infiltration.24 Our data show that fibroblasts within cancer microtissues prevent immune cells from infiltrating into the core of the microtissue. Instead, the majority of immune cells are restrained around the contact zone between cancer cells and fibroblasts, the so-called invasive margin. These findings are in accordance with recent in vivo studies,25,26 although further evaluation is essential for a deeper understanding. By comparing microtissues with different stroma/cancer cell structures, our work provides evidence that beneath the influence of cytokines and chemokines, the mechanical tissue configuration of the invasive margin seems to contribute to immune cell restraint.
Chemotaxis conducted by the secretion activity of fibroblasts might explain such observations.28,29,30 To analyze whether this effect is caused by the interaction of cancer cells with fibroblasts or just evoked by the fibroblasts at the margin of the co-culture microtissues, further experiments have to be performed involving additional cancer and fibroblast cell lines.
Our 3D model system has been proven to be effective for infiltration studies under allogenic conditions.21 Thus, it represents a promising tool for further evaluation of immunomodulatory drugs, which target immune cell homing and infiltration of cancer tissues as well as the identification of biomarkers based on specific infiltrating lymphocyte subpopulations.
Further investigations will focus on the involvement of primary cancer material to obtain an autologous setting. This setting will have specific advantages compared to the present allogeneic model, as it would enable not only the investigation of the infiltration of immune cells, but also their cytotoxic effects on the cancer microtissue under MHC matched conditions.
Although further validation is required, we describe for the first time a multicellular 3D culture system that reflects in vivo conditions of immunological processes within the tumor microenvironment.
Conclusion
In summary, this work highlights the influence of the stromal component of the tumor on immune cells infiltration. We are able to show that cancer microtissues comprising cancer-associated fibroblasts are infiltrated by activated CD69+ and CD49d+ cytotoxic T lymphocyte subpopulations compared to cancer microtissues without fibroblasts. Moreover, we show that the tumor stroma supports the tissue migration of CD3+CD8+ T lymphocytes. These effects seem to be triggered by an enhanced secretion of T lymphocyte targeting chemokines caused by the interaction of the stromal backbone with the cancer cells. Moreover, the interaction of the invasive margin of cancer tissues with infiltrating immune cells is influenced by specific chemokine patterns and the configuration of the stroma-cancer cell architecture. Whether these findings can contribute to the development of novel biomarkers and immunotherapeutic agents is evaluated in ongoing studies.
Material & methods
Cell lines
The human NSCLC cell lines A549 and Calu-6 (Deutsche Sammlung von Mikroorganismen und Zellkulturen (DSMZ), Germany: ACC107, ACC196 and ACC734) and the human fibroblasts cell line SV80 (Cell line services, Germany: 300345) were cultured in DMEM (PAA, Pasching, Austria) supplemented with 10% fetal bovine serum (FBS) (Sigma-Aldrich, Munich, Germany, Lot 010M3396) and 100 U/mL penicillin, 100 µg/mL streptomycin and 2 mM L-Glutamine (PAA). Cells were incubated at 37 °C and 5% CO2.
3D cell culture
3D cell culture was performed as in our previously described protocol.15 The “GravityPLUS™” microtissue culture system (InSphero AG, Zürich, Switzerland) was used for the production of 3D microtissues.
Cell lines were cultivated as conventional 2D monolayer in cell culture plates (Falcon) until they reached subconfluency. Cells were then washed once with PBS and detached with 1x Accutase (PAA) for 10 min at 37 °C. Enzymatic reaction was stopped by adding 20 mL cell culture medium. Afterwards, cells were counted and 40 µL of cell suspension were seeded per well in the hanging drop plate. Medium exchange was performed every four days by removing 20 µL medium and adding the same volume of fresh medium was added.
Microtissues were harvested by flushing the microcapillaries of each well with 65 µL PBS. The obtained microtissues were collected in a 96-well harvesting plate (InSphero) placed underneath the culture plate.
Isolation of PBMC
Anonymized leftover specimens of blood donations were provided by the blood bank of the Medical University of Innsbruck. Utilization of these specimens had been approved by the ethics committee of the Medical University of Innsbruck (AN2014-0353 345/4.1 – 3673a) and was conducted in accordance with the principles of the Declaration of Helsinki.
Leftover specimens of blood donors were rapidly processed within 1 d after they were removed from the storage incubator. PBMCs were isolated via Ficoll density gradient centrifugation. Therefore, fresh blood was diluted 1:1 with physiological sodium chloride solution. 30 mL of the diluted blood were gently pipetted over a 15 mL Lymphoprep™ phase in a 50 mL Falcon tube. The blood sample was then centrifuged at 800 g for 20 min at room temperature in a swing-out rotor. After centrifugation, the interface containing PBMC was aspirated and pooled in a 50 mL Falcon. PBMCs were then washed twice with MACS Buffer (PBS containing 2 mM EDTA and 0.5% human serum albumin (HSA)) and centrifuged at 400 g for 5 min at room temperature.
For PBMC, RPMI medium supplemented with 10% FBS (Sigma-Aldrich) and 100 U/mL penicillin, 100 µg/mL streptomycin and 2 mM L-Glutamine (PAA) was used.
For cryopreservation, PBMCs were centrifuged and diluted in “Cryo-SFM” freezing medium (PromoCell, Heidelberg, Germany). Afterwards, cells were stored at −80 °C until usage. If needed, PBMCs were thawed quickly in a 37 °C water bath and then diluted in pre-warmed complete medium (RPMI containing 10% FBS)
Multicellular cultivation
Microtissues were cultivated in the hanging drops system for 10 d as described above to generate microtissues. For monocultures of A549 and Calu-6 cells, 2,500 cells per well were seeded. For co-cultures of A549 or Calu-6 cells with SV80 fibroblasts, 2,500 cancer cells (A549 or Calu-6) together with 5,000 SV80 cells were seed. On day 10, 20 µL medium (DMEM) were removed and 20 µL RPMI with 25,000 isolated PBMCs were added per well. The tumor cell/PBMC co-cultures were then incubated for 24 h at 37 °C and 5% CO2. Cytokines were added to obtain concentrations as described below.
Within one experiment both cancer cell lines were incubated with PBMCs of the same donor. Different PBMC samples were used for each repetition. To identify changes of infiltrating PBMC subpopulation due to co-cultivation with tumor microtissues, a control with PBMCs alone was performed.
Cytokine and chemokine profiling of supernatants
To determine concentrations of cytokines and chemokines involved in the development and trafficking of immune cells, in supernatants of cancer microtissues, the ProcartaPlex™ Essential Human Th1/Th2 immunoassay (Affymetrix, eBioscience) and the Bio-Plex ProTM Human Chemokine Assay (Bio-Rad, USA) were used according to manufacturers' instructions. In brief, supernatants of 24 single spheroids per approach were harvested and pooled on day 11 after starting 3D cell cultures. To remove remaining cells, pooled supernatants were centrifuged at 1,000 g at 4 °C for 15 min. Subsequently, a second centrifugation step was performed at 10,000 g at 4 °C for 10 min to remove cell debris. All samples were then snap-frozen in liquid nitrogen and stored at −80 °C until use. After thawing the samples on ice, further sample preparation was performed according to the instructions of manufacturer
Samples were measured using a Magpix (Luminex) and data were analyzed by the “xPONENT 4.2” software (Luminex). For this study, we analyzed TNF-α, IL-2, IL-5, IL-6, IL-12p70 from the ProcartaPlexTM-assay and Fractalkine/CX3CL1, MIG/CXCL9, 6Ckine/CCL21, BCA-1/CXCL13, CTACK/CCL27, I-TAC/CXCL11, MCP-1/CCL2, MIP-3β/CCL19, SDF-1α+β/CXCL12, TARC/CCL17 and TECK/CCL25 from the Bio-Plex ProTM-assay. Calculated means represents data from three independent experiments. For each single experiment, PBMCs from a different donor were used and measurements were done in duplicates. The upper limit of quantitation (ULOQ) and lower limit of quantitation (LLOQ) are specified in the supplementary file (Sup. 5).
Cytokine stimulation
The cytokines IL-2 (#200–02), Il-5 (#200–05), IL-6 (#200–06) and TNFα (#300-01A-50) were purchased from PeproTech (Rocky Hill, New Jersey, USA). Stock solution of the cytokines were dissolved in distilled water and stored at −20 °C prior to usage. IL-2 was used in a final concentration of 100 U/ml, IL-5, IL-6 and TNFα were used in a final working concentration of 5 ng/mL. Microtissues were cultivated for 10 days and cytokines were added together with PBMCs for 24 h of co-incubation. Analysis of infiltrating PBMC subpopulations was performed with flow cytometry as described above.
Analysis of immune markers
Subpopulations of infiltrating PBMC in co-culture microtissues were investigated with flow cytometry in our 3D cell culture. CD3 (BD, #5566166), CD4+ (BioLegend, USA, #5317439), CD8+ (BD, USA, #5557834), CD14 (BD, #5550787), CD25 (BD, #5557741), CD19 (BioLegend, #5353419), CD19 (BD, #5348814), CD27 (BD, #5337169), CD28 (eBioscience, USA, #517-0289-102), CD39 (Miltenyi Biotec 130-099-383), CD31 (BioLegend, #5303122), CD45 (BD, #5566041), CD45R0 (BioLegend, #5304223), CD45RA (BioLegend, #5304135), CD49d (BD, #555503), CD56 (BD, #5564058), CD57 (BD, 333169), CD69 (BioLegend, #310906), CD95 (eBioscience, #525-0959-42), CD127 (BD, #5562436) and HLA-DR (BD, #5564041) were used.
Microtissues were cultivated as described above. Afterwards, 25–75 microtissues were pooled from each approach. Subsequently, supernatant was withdrawn after the microtissues had sedimented to the bottom of the tube. Then, microtissues were washed twice with PBS and centrifuged, followed by enzymatic disaggregation of the microtissues in 100 µL of collagenase from clostridium histolyticum at a concentration of 1 mg/mL (Sigma-Aldrich, USA) for 15 min at 37 °C and 5% CO2. Enzymatic reaction was stopped with 500 µL medium and single cell suspensions were washed twice with PBS containing 1% BSA. Cells were then incubated with 1 µL of each antibody in 100 µL PBS containing 1% BSA (dilution 1:100) for 30 min at 4 °C. Finally, cells were washed with PBS/1% BSA and analyzed by a FACS Canto II device.
CD45 positivity was used to define PBMCs. Regarding the different PBMC subpopulations, monocytes are defined as CD45+CD14+ cells and lymphocytes as CD45+CD14−CD3+ cells and T lymphocytes as CD45+CD14−CD3+ cells. Cytotoxic T lymphocytes are identified as CD45+CD14−CD3+CD8+ PBMCs. T helper cells are specified by CD45+CD14−CD3+CD4+ positivity. NK cells are determined as CD45+CD14−CD56+ cells. Regarding the different CD3+CD8+ T lymphocyte subpopulations, naïve T lymphocytes are defined as CD3+CD8+CD28+CD95low cells, central memory T lymphocytes as CD3+CD8+CD28+CD95high cells, and effector memory T lymphocytes as CD3+CD8+CD28−CD95intermediate cells. In cytokine stimulation experiments, an additional subpopulation of terminal effector T lymphocytes is defined as CD3+CD8+CD28−CD45RO+CD95+ cells.6 Regulatory T cells are defined as CD45+CD3+CD4+CD127−CD25high cells.
PBMC subpopulations infiltrating the microtissues were analyzed by flow cytometry and quantified in absolute numbers with the help of truecount™ beads (BD) for leukocytes, monocytes, NK cells, CD3+ lymphocytes, CD3+CD8+ lymphocytes and CD3+CD4+ lymphocytes. Absolute numbers for each approach were measured and then divided by the number of pooled microtissues to obtain the absolute number per microtissue. Regarding the lymphocyte subpopulations, results were calculated as percentages of the parental population.
Immunohistochemistry
Microtissue preparation and immunohistochemical staining was performed as previously described.15
Immunocytochemistry was performed on 4 µm sections of paraffin-embedded microtissues using a Ventana Roche Discovery Immunostainer (Mannheim, Germany) in accordance to the DAB MAP discovery research standard procedure. If required, antigen retrieval was initiated by heat-induced unmasking of the epitopes while the slides were immersed in accordance with the manufacturer's instructions (short, mild or standard for different incubation times) in Citrate buffer (Cell Conditioning Solution CC2, Ventana 760–107) or in EDTA buffer (Cell Conditioning Solution CC1, Ventana 950–124). After incubation of the sections with an anti-CD3 (Ventana, #7904341), anti-CD8+ (Ventana, #7904460), anti-CD45 (Ventana, #5266912001), anti-E-cadherin (Leica Biosystems, Wetzlar, Germany, #PA0387) or anti-Cytokeratin 18 (Linaris Biologische Produkte, Dossenheim, Germany, #E041) primary antibody at 37° C, a biotinylated immunoglobulin cocktail of goat anti-mouse IgG, goat anti-mouse IgM, goat anti-rabbit IgG and protein block (Discovery Universal Antibody, Ventana) was added for 30 min at room temperature. The detection was achieved using the DAB-MAP Detection Kit (Ventana) and the RED-MAP Detection Kit (Ventana). Sections were finally counterstained with hematoxylin (Ventana) for 4 min. Denaturation between single immunostainings was done by heat treatment at 85° C for 8 min.
Subsequently, sections were manually dehydrated in downgraded alcohol series, cleared in xylene and coverslipped permanently with Entellan™ (Merck, Darmstadt, Germany). Digital images immuno-stained slides were acquired in AxioVision microscope software linked to an AxioCam HR color camera and an AxioPlan 2 microscope (Zeiss, Jena, Germany).
Statistical analysis
For statistical analysis of the experiments, mean value and the standard error of the mean (SEM) are specified. Data were analyzed by the ratio paired Student's-t-test (two-tailed) for statistical significance with GraphPad PRISM (GraphPad Software Inc., USA). Significant differences were defined as p values < 0.05 (*p < 0.05, **p < 0.005, ***p < 0.0005, ****p < 0.0001).
Supplementary Material
Ethical approval
Utilization of these specimens had been approved by the ethics committee of the Medical University of Innsbruck (approval number: AN2014-0353 345/4.1 - 3673a) and was conducted in accordance with the principles of the Declaration of Helsinki.
Disclosure of potential conflicts of interest
No potential conflicts of interest were disclosed.
Funding
This work was funded by means of a Ph.D. grant of the Austrian Society of Haematology and Oncology (OeGHO, www.oegho.at) for SK. The funders had no role in study design, data collection and analysis, decision to publish or preparation of the manuscript.
Author contributions
Conceived and designed experiments: SK, JK, HZ, AA and SS. Performed experiments: SK, MZ, JK, EL and AA. Analyzed data: SK, JK, GG and AA. Wrote paper: SK, HZ and JK.
References
- 1.Gajewski TF, Schreiber H, Fu YX. Innate and adaptive immune cells in the tumor microenvironment. Nat Immunol 2013; 14(10):1014-22; PMID:24048123; https://doi.org/ 10.1038/ni.2703 [DOI] [PMC free article] [PubMed] [Google Scholar]
- 2.Kobayashi S, Boggon TJ, Dayaram T, Jänne PA, Kocher O, Meyerson M, Johnson BE, Eck MJ, Tenen DG, Halmos B. EGFR mutation and resistance of non-small-cell lung cancer to gefitinib. N Engl J Med 2005; 352(8):786-92; PMID:15728811; https://doi.org/ 10.1056/NEJMoa044238 [DOI] [PubMed] [Google Scholar]
- 3.Shepherd FA, Rodrigues Pereira J, Ciuleanu T, Tan EH, Hirsh V, Thongprasert S, Campos D, Maoleekoonpiroj S, Smylie M, Martins R et al.. Erlotinib in previously treated non-small-cell lung cancer. N Engl J Med 2005; 353(2):123-32; PMID:16014882; https://doi.org/ 10.1056/NEJMoa050753 [DOI] [PubMed] [Google Scholar]
- 4.Ma PC. Personalized targeted therapy in advanced non-small cell lung cancer. Cleve Clin J Med 2012; 79(Electronic Suppl 1):eS56-60; PMID:22614968; https://doi.org/ 10.3949/ccjm.79.s2.12 [DOI] [PubMed] [Google Scholar]
- 5.Weiner LM, Dhodapkar MV, Ferrone S. Monoclonal antibodies for cancer immunotherapy. Lancet 2009; 373(9668):1033-40; PMID:19304016; https://doi.org/ 10.1016/S0140-6736(09)60251-8 [DOI] [PMC free article] [PubMed] [Google Scholar]
- 6.Mahnke YD, Brodie TM, Sallusto F, Roederer M, Lugli E. The who's who of T-cell differentiation: Human memory T-cell subsets. Eur J Immunol 2013; 43(11):2797-809. Epub 2013 Oct 30; PMID:24258910; https://doi.org/ 10.1002/eji.201343751 [DOI] [PubMed] [Google Scholar]
- 7.Pagès F, Berger A, Camus M, Sanchez-Cabo F, Costes A, Molidor R, Mlecnik B, Kirilovsky A, Nilsson M, Damotte D et al.. Effector memory T cells, early metastasis, and survival in colorectal cancer. N Engl J Med 2005; 353(25):2654-66; PMID:16371631; https://doi.org/ 10.1056/NEJMoa051424 [DOI] [PubMed] [Google Scholar]
- 8.Allinen M, Beroukhim R, Cai L, Brennan C, Lahti-Domenici J, Huang H, Porter D, Hu M, Chin L, Richardson A et al.. Molecular characterization of the tumor microenvironment in breast cancer. Cancer Cell 2004; 6(1):17-32; PMID:15261139; https://doi.org/ 10.1016/j.ccr.2004.06.010 [DOI] [PubMed] [Google Scholar]
- 9.Giannoni E, Bianchini F, Masieri L, Serni S, Torre E, Calorini L, Chiarugi P. Reciprocal activation of prostate cancer cells and cancer-associated fibroblasts stimulates epithelial-mesenchymal transition and cancer stemness. Cancer Res 2010; 70(17):6945-56. Epub 2010 Aug 10; PMID:20699369; https://doi.org/ 10.1158/0008-5472.CAN-10-0785 [DOI] [PubMed] [Google Scholar]
- 10.Soon PS, Kim E, Pon CK, Gill AJ, Moore K, Spillane AJ, Benn DE, Baxter RC. Breast cancer-associated fibroblasts induce epithelial-to-mesenchymal transition in breast cancer cells. Endocr Relat Cancer 2013; 20(1):1-12. Print 2013 Feb; PMID:23111755; https://doi.org/ 10.1530/ERC-12-0227 [DOI] [PubMed] [Google Scholar]
- 11.Kunz-Schughart LA, Knuechel R. Tumor-associated fibroblasts (part II): Functional impact on tumor tissue. Histol Histopathol 2002; 17(2):623-37; PMID:11962762. [DOI] [PubMed] [Google Scholar]
- 12.Karagiannis GS, Poutahidis T, Erdman SE, Kirsch R, Riddell RH, Diamandis EP. Cancer-associated fibroblasts drive the progression of metastasis through both paracrine and mechanical pressure on cancer tissue. Mol Cancer Res 2012; 10(11):1403-18; PMID:23024188; https://doi.org/ 10.1158/1541-7786.MCR-12-0307 Epub 2012 Sep 28. [DOI] [PMC free article] [PubMed] [Google Scholar]
- 13.Dranoff G. Cytokines in cancer pathogenesis and cancer therapy. Nat Rev Cancer 2004; 4(1):11-22; PMID:14708024; https://doi.org/ 10.1038/nrc1252 [DOI] [PubMed] [Google Scholar]
- 14.Nolz JC, Starbeck-Miller GR, Harty JT. Naive, effector and memory CD8 T-cell trafficking: Parallels and distinctions. Immunotherapy 2011; 3(10):1223-33; PMID:21995573; https://doi.org/ 10.2217/imt.11.100 [DOI] [PMC free article] [PubMed] [Google Scholar]
- 15.Stein JV, Nombela-Arrieta C. Chemokine control of lymphocyte trafficking: A general overview. Immunology 2005; 116(1):1-12; PMID:16108812; https://doi.org/ 10.1111/j.1365-2567.2005.02183.x [DOI] [PMC free article] [PubMed] [Google Scholar]
- 16.Galon J, Costes A, Sanchez-Cabo F, Kirilovsky A, Mlecnik B, Lagorce-Pagès C, Tosolini M, Camus M, Berger A, Wind P et al.. Type, density, and location of immune cells within human colorectal tumors predict clinical outcome. Science 2006; 313(5795):1960-4; PMID:17008531; https://doi.org/ 10.1126/science.1129139 [DOI] [PubMed] [Google Scholar]
- 17.Chockley PJ, Keshamouni VG. Immunological consequences of epithelial–mesenchymal transition in tumor progression. J Immunol 2016; 197(3):691-8; PMID:27431984; https://doi.org/ 10.4049/jimmunol.1600458 [DOI] [PMC free article] [PubMed] [Google Scholar]
- 18.Mele V, Muraro MG, Calabrese D, Pfaff D, Amatruda N, Amicarella F, Kvinlaug B, Bocelli-Tyndall C, Martin I, Resink TJ et al.. Mesenchymal stromal cells induce epithelial-to-mesenchymal transition in human colorectal cancer cells through the expression of surface-bound TGF-β. Int J Cancer 2014; 134(11):2583-94; PMID:24214914; https://doi.org/ 10.1002/ijc.28598 [DOI] [PMC free article] [PubMed] [Google Scholar]
- 19.Lou Y, Diao L, Cuentas ER, Denning WL, Chen L, Fan YH, Byers LA, Wang J, Papadimitrakopoulou VA, Behrens C et al.. Epithelial-mesenchymal transition is associated with a distinct tumor microenvironment including elevation of inflammatory signals and multiple immune checkpoints in lung adenocarcinoma. Clin Cancer Res 2016; 22(14):3630-42; PMID:26851185; https://doi.org/ 10.1158/1078-0432.CCR-15-1434 [DOI] [PMC free article] [PubMed] [Google Scholar]
- 20.Amann A, Zwierzina M, Gamerith G, Bitsche M, Huber JM, Vogel GF, Blumer M, Koeck S, Pechriggl EJ, Kelm JM et al.. Development of an innovative 3D cell culture system to study tumour–stroma interactions in non-small cell lung cancer cells. PLoS One 2014; 9(3):e92511. eCollection 2014; PMID:24663399; https://doi.org/ 10.1371/journal.pone.0092511 [DOI] [PMC free article] [PubMed] [Google Scholar]
- 21.Koeck S, Zwierzina M, Huber JM, Bitsche M, Lorenz E, Gamerith G, Dudas J, Kelm JM, Zwierzina H, Amann A. Infiltration of lymphocyte subpopulations into cancer microtissues as a tool for the exploration of immunomodulatory agents and biomarkers. Immunobiology 2016; 221(5):604-17. Epub 2016 Feb 1; PMID:26876590; https://doi.org/ 10.1016/j.imbio.2015.12.010 [DOI] [PubMed] [Google Scholar]
- 22.Klebanoff CA, Gattinoni L, Restifo NP. CD8+ T-cell memory in tumor immunology and immunotherapy. Immunol Rev 2006; 211:214-24; PMID:16824130; https://doi.org/ 10.1111/j.0105-2896.2006.00391.x [DOI] [PMC free article] [PubMed] [Google Scholar]
- 23.Fujita M, Takada YK, Takada Y. Integrins αvβ3 and α4β1 act as co-receptors for fractalkine and the integrin-binding defective mutant of fractalkine is an antagonist of CX3CR1. J Immunol 2012; 189(12):5809-5819; PMID:23125415; https://doi.org/ 10.4049/jimmunol.1200889 [DOI] [PMC free article] [PubMed] [Google Scholar]
- 24.Tan KW, Evrard M, Tham M, Hong M, Huang C, Kato M, Prevost-Blondel A, Donnadieu E, Ng LG, Abastado JP. Tumor stroma and chemokines control T-cell migration into melanoma following Temozolomide treatment. Oncoimmunology 2015; 4(2):e978709. eCollection 2015; PMID:25949877; https://doi.org/ 10.4161/2162402X.2014.978709 [DOI] [PMC free article] [PubMed] [Google Scholar]
- 25.Clemente CG, Jr Mihm MC, Bufalino R, Zurrida S, Collini P, Cascinelli N. Prognostic value of tumor infiltrating lymphocytes in the vertical growth phase of primary cutaneous melanoma. Cancer 1996; 77(7):1303-10; PMID:8608507; https://doi.org/ 10.1002/(SICI)1097-0142(19960401)77:7%3c1303::AID-CNCR12%3e3.0.CO;2-5 [DOI] [PubMed] [Google Scholar]
- 26.Dieu-Nosjean MC, Antoine M, Danel C, Heudes D, Wislez M, Poulot V, Rabbe N, Laurans L, Tartour E, de Chaisemartin L et al.. Long-term survival for patients with non-small-cell lung cancer with intratumoral lymphoid structures. J Clin Oncol 2008; 26(27):4410-7; PMID:18802153; https://doi.org/ 10.1200/JCO.2007.15.0284 [DOI] [PubMed] [Google Scholar]
- 27.Silzle T, Randolph GJ, Kreutz M, Kunz-Schughart LA. The fibroblast: Sentinel cell and local immune modulator in tumor tissue. Int J Cancer 2004; 108(2):173-80; PMID:14639599; https://doi.org/ 10.1002/ijc.11542 [DOI] [PubMed] [Google Scholar]
- 28.Comito G, Giannoni E, Segura CP, Barcellos-de-Souza P, Raspollini MR, Baroni G, Lanciotti M, Serni S, Chiarugi P. Cancer-associated fibroblasts and M2-polarized macrophages synergize during prostate carcinoma progression. Oncogene 2014; 33(19):2423-31. Epub 2013 Jun 3; PMID:23728338; https://doi.org/ 10.1038/onc.2013.191 [DOI] [PubMed] [Google Scholar]
- 29.Harper J, Sainson RC. Regulation of the anti-tumour immune response by cancer associated fibroblasts. Semin Cancer Biol 2014; 25:69-77. Epub 2014 Jan 7; PMID:24406209; https://doi.org/ 10.1016/j.semcancer.2013.12.005 [DOI] [PubMed] [Google Scholar]
Associated Data
This section collects any data citations, data availability statements, or supplementary materials included in this article.


