

ABSTRACT
The essential trace element selenium (Se) might play a role in cancer prevention as well as for cancer therapy. Its metabolite methylselenol is able to kill cells through distinct mechanisms including induction of reactive oxygen species, DNA damage and apoptosis. Since methylselenol affects innate immune responses by modulating the expression of NKG2D ligands, the aim of this study was to determine whether the methylselenol generating compound methylseleninic acid (MSA) influences the expression of the MHC class I surface antigens and growth properties thereby reverting immune escape.
Treatment of B16F10 melanoma cells expressing low basal MHC class I surface antigens with dimethyldiselenide (DMDSe) and MSA, but not with selenomethionine and selenite resulted in a dose-dependent upregulation of MHC class I cell surface antigens. This was due to a transcriptional upregulation of some major components of the antigen processing machinery (APM) and the interferon (IFN) signaling pathway and accompanied by a reduced migration of B16F10 melanoma cells in the presence of MSA. Comparative “ome”-based profilings of untreated and MSA-treated melanoma cells linked the anti-oxidative response system with MHC class I antigen processing. Since MSA treatment enhanced MHC class I surface expression also on different human tumors cell lines, MSA might affect the malignant phenotype of various tumor cells by restoring MHC class I APM component expression due to an altered redox status and by partially mimicking IFN-gamma signaling thereby providing a novel mechanism for the chemotherapeutic potential of methylselenol generating Se compounds.
KEYWORDS: 2D-DIGE, anti-tumoral immune response, APM components, methylseleninic acid, MHC class I, selenium
Abbreviations
- 2D-DIGE
two-dimensional differential gel electrophoresis
- APM
antigen processing machinery
- CALR
calreticulin
- CMV
cytomegalovirus
- CTL
cytotoxic T lymphocytes
- DMDSe
dimethyldiselenide
- DNTB
5,5′-dithiobis 2-nitrobenzoic acid
- ER
endoplasmic reticulum
- EstD/estD
esterase D
- G6PD/G6pd
glucose 6-phosphate dehydrogenase
- GAPDH
glyceraldehyde-3-phosphate dehydrogenase
- GO
gene ontology
- GSH
glutathione
- Gsta4
glutathione S-transferase a4
- HDAC
histone deacetylase
- hnRNPA2/B1/Hnrnpa2b1
heterogeneous ribonucleoprotein family A2/B1
- IFN
interferon
- IRF
interferon-regulated factor
- JAK-1/Jak1
janus kinase 1
- LMP
low molecular weight protein
- mAb
monoclonal antibody
- MHC
major histocompatibility complex
- MIC
MHC class I polypeptide-related sequences
- MSC
methylselenocysteine
- NKG2D
natural killer group 2 member D
- Nqo1
NAD(P)H dehydrogenase (quinone) 1
- Nrf2
nuclear factor (erythroid-derived 2) like 2
- PDI
protein disulfide isomerase
- PD-L1
programmed death ligand 1
- PRXD1/Prdx1
peroxiredoxin 1
- ROS
reactive oxygen species
- Se
Selenium
- SeMet
selenomethionine
- STAT1/Stat1
signal transducer and activator of transcription 1
- TNBC
triple negative breast cancer cells
- TAP
transporter-associated with antigen processing
- TPN/Tapbp
tapasin
- ULBP
UL-16 binding protein
Introduction
Selenium (Se), an essential trace element, is metabolized to a variety of low molecular weight compounds and selenoproteins. While inorganic Se is mainly represented by selenate and selenite, members of the organic Se forms are selenomethionine (SeMet) and methylselenocysteine (MSC).1 In contrast, methylseleninic acid (MSA) is a synthetic Se compound, which has been implemented in a number of in vitro and in vivo experimental studies.2 The metabolism of the different Se compounds is complex and closely regulated. The two key metabolites selenide and methylselenol have been shown to be crucial for the biological function of these substances. In addition, the cellular thioredoxin (TRX) and glutaredoxin systems known to play an important role in the maintenance of the intracellular redox balance are involved in the reduction of various Se compounds.
Furthermore, Se has been suggested to be chemopreventive and to exert anti-carcinogenic effects on many solid and haematopoietic tumors such as bladder, prostate and breast cancer as well as lymphoma.3,4 The functional activity of selenoproteins might be due to their anti-oxidative effects or to an altered expression pattern of genes involved in cancer initiation and progression.5,6 This was further strengthened by epidemiologic studies revealing an inverse correlation of the Se status and cancer incidence as well as cancer mortality.7 Furthermore, Se is one of the few trace elements, for which anti-carcinogenic effects have been proven in a randomized, double blinded, placebo controlled study.8 Clinical interventional studies demonstrated that a supra-nutritive intake of Se has positive effects in the prevention of several tumor types, which were also confirmed by in vivo and in vitro experiments.9 In contrast, the SELECT study studying the chemopreventive potential of Se within a heterogeneous group of healthy man failed to reduce the risk for prostate cancer.10 These controversial data might be due to the different Se compounds used in these trials. Several lines of evidence have implicated that the Se metabolite methylselenol is the active Se compound for anti-carcinogenic effects.11,12 Se compounds directly entering the monomethylated pool of Se compounds are more effective in reducing tumorigenesis than those preferentially metabolized to hydrogen selenide.13,14 Methylselenol induces in combination with intracellular thiols reactive oxygen species (ROS).15 MSA, a proximal precursor of the redox active Se metabolite methylselenol, is intracellularly reduced to methylselenol by several non-enzymatic steps 14 and exhibits cytotoxic potential in different tumor entities, e.g., colon,16 melanoma17 and mammary carcinoma.4 Furthermore, MSA has both anti-carcinogenic and anti-metastatic potential in vivo without affecting the general behavior of animals. The combined treatment of triple negative breast cancer cells (TNBC) with MSA and paclitaxel upon xenoengraftment in mice reduced tumor growth more than paclitaxel alone,18 which might be due to induction of apoptosis and/or cell cycle arrest. The chemopreventive/chemotherapeutic effects of MSA might be associated with an inhibition of histone deacetylases (HDACs). HDACs are involved in the regulation of the gene expression pattern and often overexpressed in tumor cells. In B cell lymphoma and esophageal cancer, MSA reduces HDAC activity19,20 by modulation of conserved cysteine residues in the catalytic center of HDACs.21
Different models of tumor-initiation showed that natural killer (NK) cells and the interferon (IFN) system are involved in the immunity of tumors. The NK-mediated anti-tumoral responses require the expression of the activating receptor NKG2D (natural killer group 2 member D).22 NKG2D recognizes infected or abnormal cells by binding to ligands, which are induced on stressed or transformed cells thereby leading to their elimination.22 Recently, Hagemann-Jensen and coworkers showed that the selenocompound MSA affects the immunogenicity of tumors by modulating different ligands of the NKG2D receptor, like the MHC class I polypeptide-related molecules (MICA, B) leading to enhanced NK cell responses.23 Since NKG2D expression is not only limited to NK cells, but also found on human CD8+ T cells24,25 it plays a key role in both NK and T cell-mediated tumor elimination.26
The human major histocompatibility complex (MHC) class I molecules are subdivided into classical HLA-A, -B and -C (MHC class Ia) and non-classical HLA-E, -F and -G (MHC class Ib) antigens and are expressed on the cell surface in association with ß2-microglobulin. While the expression of HLA-A, -B and -C antigens are frequently lost or downregulated on tumor cells, HLA-G and/or HLA-E antigens are often overexpressed in tumors of distinct origin, e.g., ovarian carcinoma, colon carcinoma and melanoma.27-29 Since HLA-E can bind to the inhibitory CD94/NKG2A receptors expressed on NK cells and a subset of T cells, HLA-E expression could lead to an escape of tumor cells from immune surveillance.30 Interestingly, the selenocompound selenite is able to reduce HLA-E antigen expression in different tumor cells, which was accompanied by an enhanced NK cell-mediated killing31 suggesting that selenite might be able to potentiate the antitumor cytotoxicity in settings of NK cell-based immunotherapies.
In contrast, for proper T-cell responses MHC class Ia surface expression is required, which is controlled by different components of the MHC class I antigen processing machinery (APM). MHC class I molecules present antigenic peptides on the surface of cells, which are predominantly generated by proteasomal degradation of intracellular proteins. The generated peptides are translocated by the transporter-associated with antigen processing (TAP) from the cytosol into the lumen of the endoplasmic reticulum (ER) and there loaded onto MHC class I molecules, which is facilitated by different chaperones, e.g., tapasin (TPN), ERp58, protein disulfide isomerase (PDI). Subsequently, the loaded MHC class Ia molecules are transported via the trans-Golgi apparatus to the cell surface and there presented to CD8+ cytotoxic T lymphocytes (CTL). However, total, partial loss or downregulation of MHC class I surface expression or APM components were found in many tumors of distinct origin thereby limiting the respective antitumor immune responses,32,33 which were often associated with disease progression and reduced patients’ survival.34-36 The underlying molecular mechanisms of MHC class I abnormalities are diverse and include either irreversible structural alterations or reversible deregulatory processes of APM components. While mutations, deletions and/or loss of heterozygosity rather occur rarely, the expression of APM components in tumors is frequently regulated by transcriptional, epigenetic or post-transcriptional control mechanisms.32,37,38 Moreover, the expression pattern of MHC class I APM components seems to be linked to changes in the cellular or environmental metabolism. Recently, oxidative stress has been shown to alter cellular glutathione levels, which is associated with changes in the MHC class Ia dimer formation on the cell surface.39 The impact of changes in the cellular redox status on the modulation of the MHC class Ia expression level is further supported by the role of the oxidizing enzyme ER oxidoreductase α (ERO-1a), which is controlled by oxidative folding.40
Since one major goal in the field of tumor immunology is to re-establish and to maintain/bolster MHC class Ia surface expression in tumors thereby increasing their immunogenicity the identification of key molecules or substances overriding tumor intrinsic escape routes, such as the downregulation of MHC class Ia surface expression used by tumor cells will help to improve durable tumor rejection. In order to get better insights into the role of redox processes on the immunogenicity of tumor cells, B16F10 melanoma cells were treated with various concentrations of selenocompounds including MSA and their influence on the regulation of MHC class I surface expression level and/or the expression pattern of APM components were determined. The MSA-mediated altered redox metabolism caused a transcriptional upregulation of APM components leading to increased levels of MHC class I cell surface antigens. In addition, MSA mimics interferon-gamma (IFNγ) signaling by also upregulating members of IFNγ responsive genes.
Results
Effects of MSA treatment on cell viability
A prerequisite for the analyses of the immunogenic phenotype of tumors and of their proteome expression profiles in the presence of MSA is to determine the effects of MSA treatment on cell viability. Therefore, B16F10 melanoma cells were treated with different concentrations of MSA for 24 and 48 h, respectively. While lactate dehydrogenase (LDH) activity in the supernatants of B16F10 cells did not differ between the untreated and MSA-treated groups indicating that the viability of these cells was not compromised, XTT assays revealed more metabolic active cells under MSA treatment in comparison to the control group indicating that other enzymes catalyzing the formation of formazan might be upregulated. As formazan is also metabolized by NAD(P)H, the transcription of the NAD(P)H producing enzymes was determined. As shown in Fig. S1, the expression level of both glucose-6-phosphate dehydrogenase and 6-phospho-gluconate dehydrogenase were upregulated in response to MSA treatment. Furthermore, wound healing (Fig. 1A) as well as migration assays (Fig. 1B) support a decreased migration rate of B16F10 cells in the presence of MSA.
Figure 1.
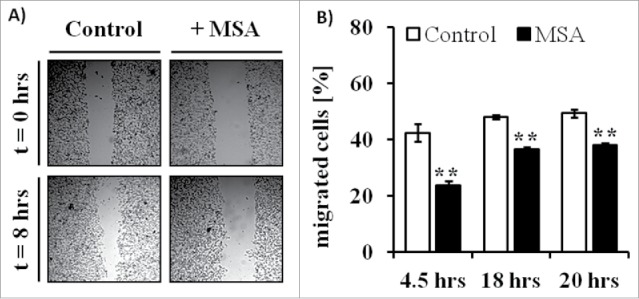
Altered wound healing and migration of B16F10 melanoma cells in response to MSA treatment. (A) To investigate wound-healing processes scratch assays were performed. Therefore, confluent monolayers of B16F10 cells cultured in complete media supplemented with 10% FCS were mechanically disrupted with a sterile pipette tip, left untreated (control) or treated with 2.5 µM MSA and then photographed immediately (0 h) and 8 h after scratching. The assays were performed in triplicates. (B) For migration assays B16F10 cells either left untreated or treated with MSA for 24 h were seeded into trans-well chambers. All assays were independently performed at least three times as described in the Material and Method section. **p < 0.01 (Student's t-test).
Association of the MSA-induced decreased migration of melanoma cells with reduced AKT phosphorylation
Since protein kinase B (AKT) is one of the key regulators of proliferation, cell survival and migration,41 the phosphorylation status of AKT as well of its negative regulator PTEN were investigated in untreated (control) and MSA-treated B16F10 cells by Western blot analysis. When compare with the control cells MSA treatment resulted in a decreased phosphorylation rate of AKT at serine residue 473, whereas the phosphorylation status at position threonine 308 as well as of the total AKT protein expression level remained unaffected by this treatment (Figs. 2A and B). In contrast, the phosphorylation rate as well as the protein expression level of PTEN increased in response to MSA treatment. Since AKT phosphorylation might also regulate the glucose metabolism, the glucose uptake rates were determined in untreated and MSA-treated B16F10 cells by flow cytometry. As shown in Figs. 2C and D, the glucose uptake rate of MSA-treated cells was slightly reduced, which is in accordance with the reduced AKT phosphorylation rate.
Figure 2.
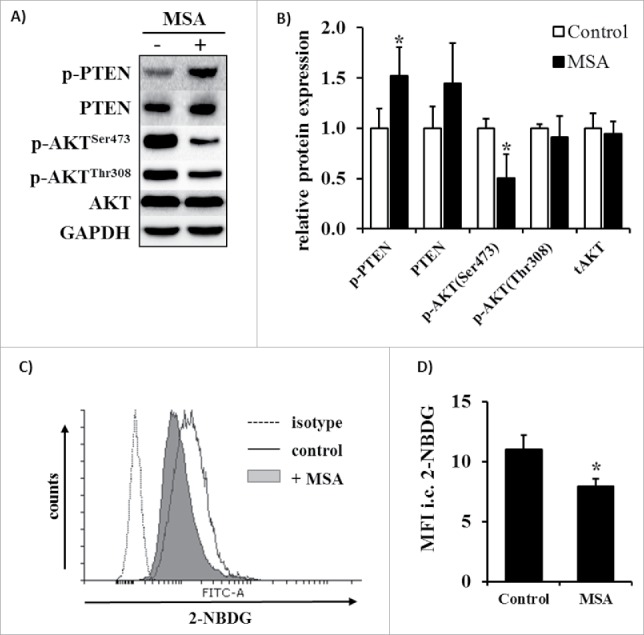
Changes in the phosphorylation pattern of AKT and glucose uptake after MSA exposure of B16F10 melanoma cells. (A) Representative phosphorylation states and expression levels of AKT and PTEN in B16F10 cells following treatment with 2.5 µM MSA for 24 h were determined by Western blot analyses as described in the method section. (B) Relative quantification of p-AKTSer473, p-AKTThr308, total AKT, p-PTENSer380/Thr382/383 and total PTEN expression levels normalized to GAPDH and thereafter set in relation to the control group. (C) Glucose uptake of B16F10 cells after treatment with 2.5 µM MSA was measured using the fluorescent glucose analog 2-NBDG, which was determined by flow cytometry as described in the Material and methods section. (D) 2-NBDG fluorescent intensities were normalized to the respective unstained control. All assays were independently performed at least three times. *p < 0.05 (Student's t-test). 2-NBDG, 2-(N-(7-Nitrobenz-2-oxa-1,3-diazol-4-yl)Amino)-2-Deoxyglucose.
MSA-mediated changes in the protein expression pattern of B16F10 melanoma cells
To gain further insights into the anti-carcinogenic potential of MSA, 2D-DIGE analysis of untreated (control) and MSA-treated B16F10 cells was performed in an untargeted approach (Fig. 3, Table 1). The consensus map across all experimental samples (three biological replicates/group, n = 6) was comprised of 872 distinct spots. In total, 33 differentially expressed protein spots could be identified, by subjecting them to MALDI-TOF-MS analyses resulting in the identification of 14 unique protein species. The identified proteins were grouped according to their biological function(s) (Fig. 3C). The expression pattern of three of the upregulated proteins are controlled by the transcription factor Nrf2.42 These include glucose 6-phosphate dehydrogenase (G6PD), peroxiredoxin 1 (PRXD1) and S-formylglutathione hydrolase (ESTD), all involved in mounting/maintaining the anti-oxidative defense. In addition, two ER-resident enzymes named protein disulfide isomerase (PDI) and calreticulin (CALR) were upregulated in response to MSA treatment. PDI exhibits oxidoreductase functions and together with CALR is involved in the MHC class I assembly pathway.43,44 In contrast, the heterogeneous ribonucleoprotein A2B1 (hnRNPA2B1), which is involved in splicing processes, was downregulated in the presence of MSA.
Figure 3.

Differential protein expression pattern of untreated and MSA-treated B16F10 melanoma cells. (A) A representative preparative protein expression pattern of B16F10 melanoma cells following two-dimensional gel electrophoresis (2-DE) is shown as described in Materials and methods sections. Differentially expressed proteins as defined by 2D-DIGE were identified by MALDI-TOF-MS analyses as described in the material section and are indicated by their protein IDs (see also Table 1). (B) Representative heat map and cluster analysis for the panel of identified differentially expressed proteins was done using the software TM4 MeV4.9 (http://www.tm4.org/). (C) Classification analysis of the differentially expressed proteins according to their biological processes was performed using the Panther gene ontology (GO) software (http://pantherdb.org/).
Table 1.
Differentially expressed proteins in response to MSA treatment
| Theoretical |
|||||||
|---|---|---|---|---|---|---|---|
| Protein | Uniprot ID | Score MS | Sequence Coverage (%) |
No. of matched peptides | Mass (kDa) | pI | Ratio MSA/C |
| Peroxiredoxin-1 (PRDX1) | P35700 | 268 | 78 | 25 | 22.39 | 8.26 | 2.57 ↑ |
| Calreticulin (CALR) | P14211 | 158 | 44 | 21 | 48.136 | 4.33 | 1.96 ↑ |
| Creatine kinase B-type (KCRB) | Q04447 | 235 | 75 | 30 | 42.971 | 5.40 | 1.88 ↑ |
| S-formylglutathione hydrolase (ESTD) | Q9R0P3 | 116 | 47 | 14 | 31.87 | 6.7 | 1.69 ↑ |
| Fructose-bisphosphate aldolase A (ALDOA) | P05064 | 266 | 85 | 27 | 39.787 | 8.31 | 1.64 ↑ |
| Protein disulfide-isomerase (PDIA1) | P09103 | 262 | 48 | 33 | 57.422 | 4.77 | 1.58 ↑ |
| Glucose-6-phosphate 1-dehydrogenase X (G6PD1) | Q00612 | 407 | 66 | 49 | 59.681 | 6.06 | 1.52 ↑ |
| Galectin-1 (LEG1) | P16045 | 118 | 61 | 11 | 15.198 | 5.32 | 1.52 ↑ |
| Eukaryotic translation initiation factor 3 subunit A (EIF3A) | P23116 | 100 | 21 | 28 | 162.237 | 6.38 | 0.38 ↓ |
| Protein CDV3 (CDV3) | Q4VAA2 | 70 | 54 | 9 | 29.711 | 5.84 | 0.38 ↓ |
| Ribose-phosphate pyrophosphokinase 2 (PRPS2) | Q9CS42 | 57 | 37 | 9 | 35.163 | 6.15 | 0.37 ↓ |
| Heterogeneous nuclear ribonucleoproteins A2/B1 (hnRNPA2/B1) | O88569 | 179 | 52 | 25 | 37.437 | 8.97 | 0.33 ↓ |
| Fermitin family homolog 3 (URP2) | Q8K1B8 | 59 | 24 | 11 | 76.157 | 6.60 | 0.32 ↓ |
| Programmed cell death 1 ligand 2 (PD1L2) | Q9WUL5 | 56 | 19 | 5 | 28.201 | 8.46 | 0.28 ↓ |
Values are given as means (n = 3) in relation to the untreated control group. ↑ indicate significantly upregulated proteins, ↓ indicate significantly downregulated proteins (p < 0.05, Student´s t-test).
Validation of representative differentially expressed proteins in response to MSA treatment
The upregulation of the PRXD1, G6PDH, ESTD, PDI and the downregulation of hnRNPA2/B1 were validated by RT-PCR in untreated (control) and MSA-treated B16F10 cells (Fig. 4A). The mRNA and protein expression levels of PDI were enhanced in the presence of MSA (Fig. 4B). Since PRDX1 and G6PDH are both regulated by Nrf2,42 the expression level of the latter was determined by Western blot analysis. As shown in Fig. 4C, no nuclear Nrf2 accumulation was detected in untreated B16F10 melanoma cells, whereas MSA treatment strongly enhanced Nrf2 accumulation in the nucleus. Furthermore, the transcriptomic profiling of additional Nrf2 targets revealed an enhanced Nrf2 activity in response to MSA treatment. Since Nrf2 activation in combination with the transcriptional induction of Nrf2 target genes could be mediated by enhanced ROS levels, intracellular ROS levels were analyzed using a ROS-sensitive reporter dye. As shown in Figs. 5A and B, increased ROS levels were detected within 4 h after MSA treatment. Furthermore, total glutathione (GSH) levels were approximately 2-fold increased in B16F10 cells after 24 h MSA treatment (Fig. 5C) suggesting that MSA might interrupt/interfere with the cellular redox homeostasis.
Figure 4.
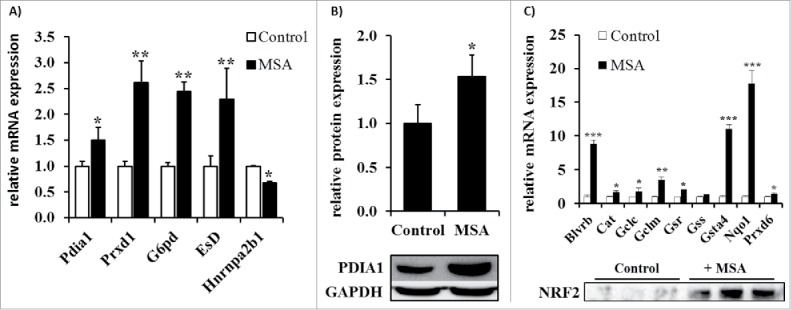
Validation of selected MSA targets obtained by proteomic analysis. (A) mRNA expression levels of differentially expressed proteins were determined by qPCR analyses as described in the Materials and methods section. The relative mRNA expression levels were normalized to the reference genes RPL13a, GAPDH and ß-actin and subsequently defined in relation to the control group. (B) Densitometric analysis of the relative PDI1A expression levels based on the Western blot analysis as representatively shown in the lower panel. (C) mRNA analysis of different Nrf2 target genes determined by qPCR (upper panel) and nuclear Nrf2 content of B16F10 cells left untreated or treated with 2.5 µM MSA was determined by Western blot analysis (lower panel). All experiments were independently performed at least three times. *p < 0.05, **p < 0.01, ***p < 0.001 (Student's t-test).
Figure 5.

Changes of the intracellular ROS and GSH levels upon MSA treatment of B16F10 cells. B16F10 cells were left untreated or treated with MSA for 4 h. Intracellular ROS concentrations in these cells were determined using the fluorescent reporter dye DCF by flow cytometry as described in the material and method section. (A) Representative dot blots and (B) MFI of DCF normalized to unstained cells. (C) Intracellular levels of total GSH were measured spectrophotometrically as described in the method section. All experiments were performed at least three times. *p < 0.05 (Student's t-test). DCF, 2′,7′-Dichlorfluorescein.
Identification of MSA-induced alterations in the redox status of proteins and their correlation with MHC class I APM components
In order to determine the MSA-mediated changes in the redox status, redox proteome analysis using iodoTMT tags, which target free cysteine residues, were employed. This led to the identification of proteins with an altered redox status including several ER-resident proteins, which are directly involved in the MHC class I assembly, such as e.g., ERO1a, PDIA1, PDIA3, PDIA4 and CALR. In addition, TRIM28 showed an altered redox-status in response to MSA treatment (personal communications).
By employing the R2: Genomics Analysis and Visualization Platform (http://hgserver1.amc.nl/cgi-bin/r2/main.cgi) correlations between the expression rates of hnRNPa2/b1, TRIM28 and selected components of the MHC class I APM in melanoma were determined (Fig. 6). With this approach, inverse associations of hnRNPa2/b1 to the MHC class I APM component TPN (PC: −0.222, p = 1.1 × 10⁻⁶) and the interferon regulatory factors IRF5 (PC: −0.282, p = 4.7 × 10⁻¹⁰) and IRF9 (PC: −0.221, p = 1.3 × 10⁻⁶) were found. In addition, inverse correlations of TRIM28 with STAT1 (PC: −0.405, p = 5.8 × 10⁻²⁰), STAT2 (PC: −0.232; p = 3.5 × 10⁻⁷), STAT3 (PC: −0.243; p = 9.5 × 10⁻⁸) and with NLRC5 (PC: −2.89; p = 1.7 × 10⁻⁹) were detected, whereas the Nrf2 target NQO1 positively correlated with HLA-A (PC: 0.230; p = 2.4 × 10⁻⁶).
Figure 6.
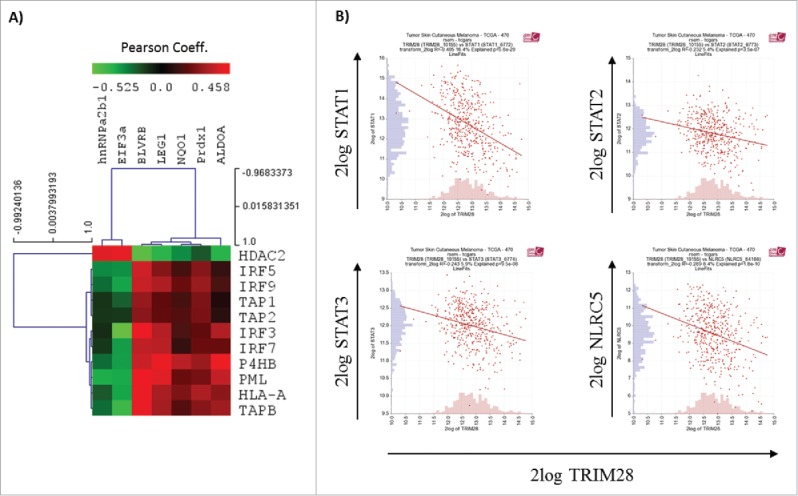
Correlation analysis. Correlation analysis of selected differentially expressed (A) or redox-modified (B) proteins were performed by employing the R2: Genomics Analysis and Visualization Platform (http://hgserver1.amc.nl/cgi-bin/r2/main.cgi).
Enhanced MHC class I surface antigens of B16F10 cells after MSA treatment
Since Nrf2 has been shown to induce the expression of proteasomal subunits necessary for the generation of peptides45 and MSA mediated an altered expression or redox status of CALR, PDI, ERO1a and TRIM28, respectively, it was postulated that MSA upregulates the expression of MHC class I antigen molecules in B16F10 cells, which are per se characterized by low MHC class I cell surface expression levels due to the impaired expression of several APM components. This immune escape phenotype of B16F10 could be restored by IFNγ treatment.46 As shown in Fig. 7, a dose-dependent approximately 2- to 4-fold increase of the MHC class I surface expression level in B16F10 melanoma cells treated for 24 h with MSA was detected, which was stable for at least 48 h (Figs. 7A and B). In addition, treatment with DMDSe also resulted in an upregulation of the MHC class I surface expression level comparable to that of MSA. In contrast, treatment with selenite showed no effect, whereas SeMet treatment at least for the higher doses even resulted in a downregulation of the MHC class I surface expression level (Figs. 7C–E).
Figure 7.
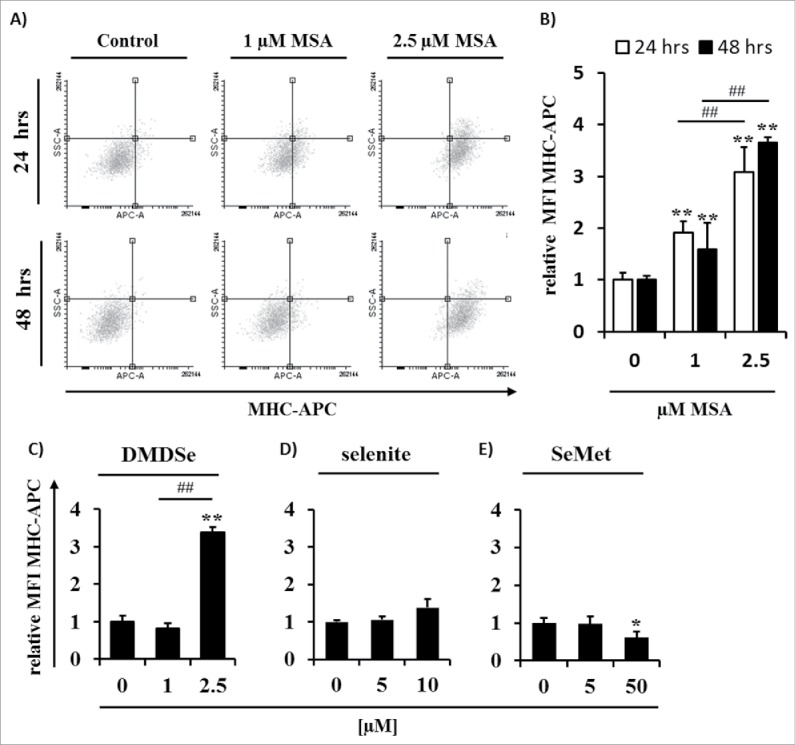
Effects of MSA on the MHC class I surface expression of B16F10 melanoma cells. (A) Dot blots of SSC versus anti-MHC class I staining of B16F10 cells treated with different concentrations of MSA (0–2.5 µM) for 24 and 48 h, respectively, are shown. Analyses were performed by flow cytometry as described in Materials and methods. The fluorescence intensity of (B) MSA, (C) DMDSe, (D) selenite and (E) selenomethionine (SeMet) treated cells were normalized to the respective isotype controls. Data represent means ± SD and are expressed in relation to the untreated (0 µM MSA) group. All experiments were performed at least three times. ** indicate significant differences (p < 0.01, Student's t-test) of the treated vs. control group. ## indicate significant differences (p < 0.01, Student's t-test) within the MSA-treated groups. SSC, sideward scatter.
General effects of MSA treatment on the MHC class I expression level of tumor cells
To study whether the effects observed in B16F10 cells in response to treatment with the compound MSA could be also extended to other tumor cells, three human melanoma cell lines (WM1552c, UKRV, Colo875), two human mammary carcinoma cell lines (SK-BR-3 and BT-474) and the human colon carcinoma cell line SW480 were left untreated and treated with MSA as described for B16F10 cells, before their MHC class I expression levels were determined by flow cytometry. As shown in Figs. 8A–F, treatment with MSA increased the MHC class I surface expression levels in all the tested tumor cell lines.
Figure 8.
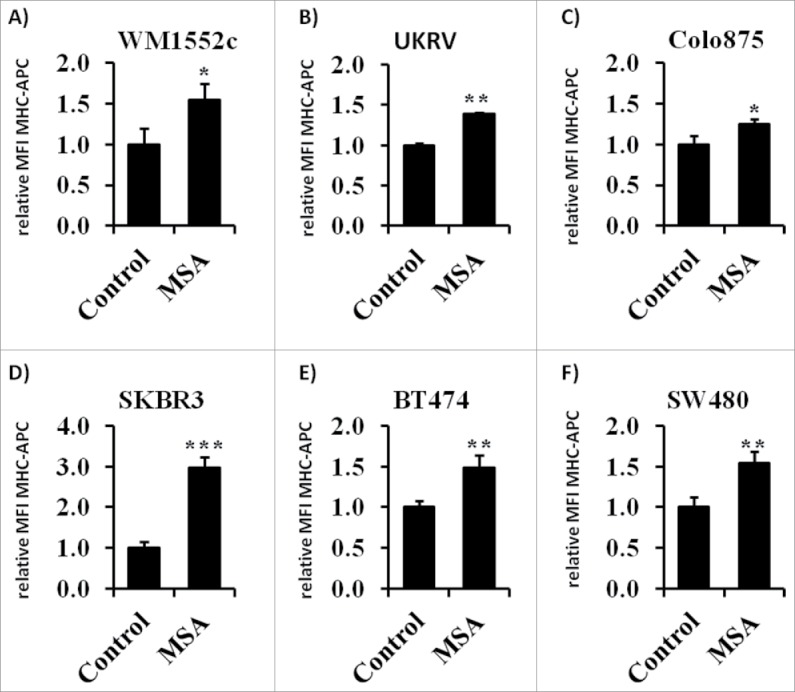
MHC class I surface expression of tumor cell lines following treatment with 2.5 µM MSA for 24 h as analyzed by flow cytometry. One representative experiment of three independent experiments is shown. Bars represent mean fluorescence intensity (MFI) of MHC-APC normalized to the isotype control within the given independent experiments. ** indicate significant differences (p < 0.01, Student's t-test).
Transcriptional upregulation of MHC class I APM components by MSA
In order to define the underlying molecular mechanism which leads to the observed upregulation of the MHC class I surface expression levels in response to treatment with MSA, the mRNA and protein expression pattern of selected APM components were determined. As shown in Fig. 9A MSA increased the transcript levels of a panel of APM components including the IFNγ-inducible proteasomal subunits low molecular weight protein (LMP)2 and LMP7, TAP1, TAP2, TPN, β2-m, H-2D and H-2K, yet for LMP10 rather a downregulation of the corresponding transcript level was observed. In addition, the mRNA levels of NLRC5, a critical co-activator of genes of the MHC class I presentation pathway,47 were upregulated. To understand the molecular mechanisms of the MSA-mediated regulation mechanism, also the promoter activities of TAP1, TAP2, TPN and LMP2 were determined in response to treatment with MSA and revealed enhanced activation states (Fig. 9B). Furthermore, the protein expression levels of LMP2 and LMP7 were analyzed by Western blot supporting the coordinated expression both at the mRNA and protein levels for these APM components. Moreover, MSA treatment resulted in an enhanced transcript level of signal transducer (STAT)1 and in a shift of STAT1ß toward STAT1α expression at the protein level. In addition, the phosphorylation states of STAT1 and JAK1 were increased following MSA treatment suggesting that MSA enhances the expression of MHC class I surface antigens by inducing APM components and by mimicking IFNγ signaling (Figs. 9C and D).
Figure 9.
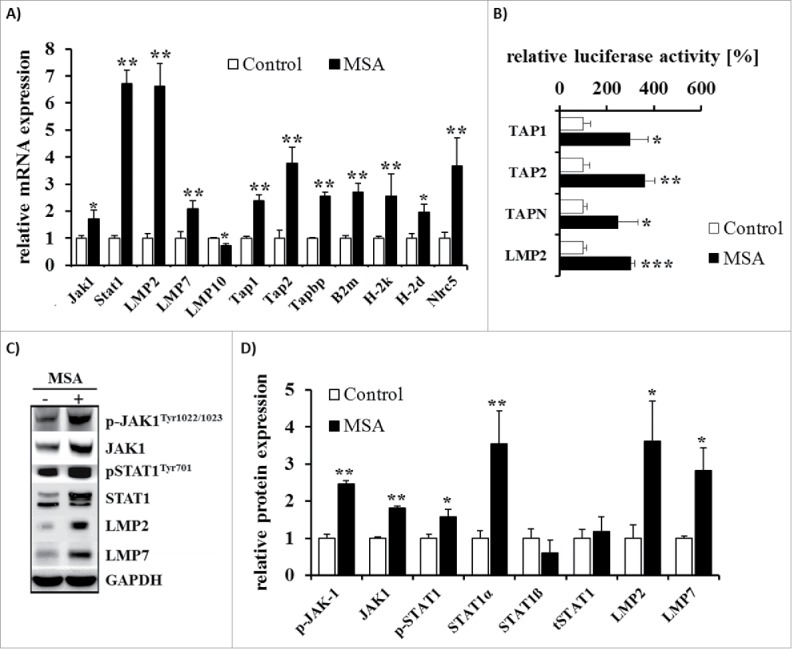
Analysis of APM component expression in B16F10 cells after treatment with MSA. (A) mRNA expression levels of APM components were determined by qPCR analyses normalized to the set of reference genes RPL13a, GAPDH and ß-actin as well as in relation to the control group. (B) Different wild-type (WT) APM-luc promoters and the ß-gal promoter were transiently co-transfected into B16F10 cells 24 h prior treatment with MSA for 24 h. Luc activity was determined as described in Materials and methods and normalized to ß-gal activity. Data are expressed in relation to untreated controls. (C) Representative Western blots of APM components and (D) their quantification by measuring the OD normalized to GAPDH in relation to the control group are shown. Data represent means ± SD of at least three independent experiments. *p < 0.05, **p < 0.01, ***p < 0.001 (Student's t-test).
Effect of MSA on the IFNγ signal transduction in B16F10 cells
In addition to components of the MHC class I APM the transcript levels of components of the IFNγ signaling pathway were analyzed in response to treatment with either MSA or IFNγ alone as well as to treatment with a combination of both substances (Fig. 10). MSA and IFNγ treatment alone increased the transcript levels of IRF1, IRF5, IRF7 and IRF9, whereas IRF4 was downregulated by MSA and upregulated by IFNγ. Combination of both substances resulted in a further increase of IRF5, STAT1 and STAT2 transcript levels.
Figure 10.
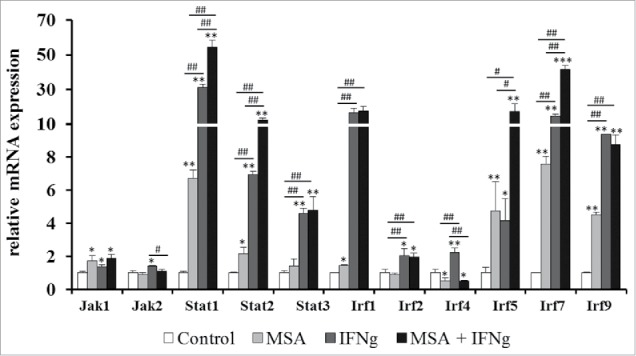
Changes in the mRNA expression levels of the IFNγ signaling pathway in response to MSA and IFNγ treatment. B16F10 cells were treated with 2.5 µM MSA and 200 U/mL IFNγ alone or in combination for 24 h. The mRNA expression levels were determined by qPCR analyses, normalized to the reference genes RPL13a, GAPDH and ß-actin and subsequently defined in relation to untreated control group. Data represent the mean of at least three independent experiments. * indicate significant differences between the treated and control groups (*p < 0.05, **p < 0.01, Student's t-test). # indicate significant differences within the different treatment groups (#p < 0.05, ##p < 0.01, Student's t-test).
Discussion
The trace element Se has been discussed to exhibit chemo-preventive potential. Furthermore, newer studies reveal also chemo-therapeutic effects of Se.3,4 However, the mechanisms, by which Se exerts those beneficial effects are largely unknown, but include their anti-oxidative properties, the induction of apoptosis and inhibition of cell proliferation. There exist two key metabolites of Se, which are critical for chemoprevention/chemotherapy.48 Hydrogen selenide necessary for the formation of selenoproteins results mainly from inorganic selenocompounds such as selenate or selenite, respectively, and methylselenol, which is generated from organic selenocompounds. In this study, the pro-oxidant MSA, a synthetic selenocompound and precursor of methylselenol, induced MHC class I surface expression not only in B16F10 melanoma cells, but also on several other tumor cell lines, including human cancer cells. These data were in line with the effects of the pro-oxidative selenocompound DMDSe, which also induces MHC class I surface expression. In contrast, the selenocompounds selenite and SeMet known to produce less amounts of ROS and methylselenol during their metabolic processing/turnover failed to increase MHC class I surface expression. These results indicate that the effects on the MHC class I expression pattern are rather mediated by the formation of ROS or methylated selenocompounds, such as methylselenol, as by Se itself. This hypothesis is in accordance to results by Hagemann-Jensen and coworkers demonstrating a MSA- and DMDSe-mediated upregulation of NKG2D receptor ligands, whereas selenite, selenate, SeMet and SeCys did not influence MICA and MICB expression.23 In accordance to our study, Enqvist and co-authors31 described no effect of selenite on the expression of MHC class Ia molecules, but detected a strong post-transcriptional downregulation of HLA-E antigens, which was associated with an enhanced NK cell-based tumor killing. HLA-E antigens act as both inhibitory and activating ligands for CD94/NKG2 receptors depending on the antigen load: Upon loading with a peptide derived from an HLA-Ia leader sequence, HLA-E can interact with the inhibitory receptor CD94/NKG2A, while upon loading with a HLA-G leader sequence HLA-E can interact with the activating receptor NKG2C.49 In contrast to this important role of HLA-E in the innate immunity, only few experiments revealed that MHC class Ib molecules could interact with T cells.30,50 It could be shown that HLA-E+ targets loaded with peptides derived from splice variants of the stress inducible anti-oxidant enzyme peroxiredoxin 5 (Prdx5) are recognized by HLA-E-restricted CD8+ T cells.51 In contrast, complexes composed of HLA-E and Prdx5 did not interact with NKG2A and therefore did not downregulate NK cell function.51 HLA-E might be upregulated in response to cytokines like IFNγ52 suggesting that an upregulation of HLA-E in response to MSA cannot be excluded. Thus, further analyses are required to determine the impact of MSA treatment on the expression of MHC class Ib molecules.
In our study, the induction of MHC class Ia was caused by a transcriptional upregulation of components of the APM, including proteasomal subunits and components of the peptide loading complex. Furthermore, MSA partially mimics IFNγ signaling, such as the upregulation of STAT1, JAK1, IRF1, IRF5, IRF7 and IRF9 on the mRNA and/or protein expression levels. In addition, MSA treatment leads to activation of the transcription factor Nrf2, thus resulting in the initiation of the upregulation of genes involved in the anti-oxidant defense. The observed enhanced Nrf2 accumulation in the nucleus could be mediated by the formation of ROS in response to treatment with MSA. Under normal conditions, Nrf2 is bound to its inhibitor protein Keap1 and marked for proteasomal degradation. ROS or electrophilic agents modify redox-sensitive cysteine residues of Keap1, leading to conformational changes and the release of Nrf2, which in turn could translocate into the nucleus and initiate the transcriptional induction of its target proteins.42 In our study, a strong upregulation of Nrf2 targets was observed, such as NQO1. Next to its role in the anti-oxidative defense, NQO1 is described to stabilize p53 and thus prevents its proteasomal degradation.53 Concerning the peptide transporter subunit TAP1, it has been described that p53 regulates its expression and enhances the peptide transport as well as the expression of MHC class I peptides on the cell surface.54 This might be a link, given that MSA enhances p53 protein levels as well as its activity.55,56
It is noteworthy that IFNγ is an important inducer of ROS, via NOX enzymes, that causes oxidative stress and an enhanced formation of oxidative damaged proteins.57,58 Furthermore, it could be shown that the upregulation of subunits of the so-called immuno-proteasome (LMP2, LMP7, LMP10) might rather be an mechanism to degrade oxidative-damaged proteins.59 Also, in our study an upregulation of proteasomal subunits after treatment with MSA could be shown, which might be attributed to the enhanced activity of the transcription factor Nrf2 mediated in response to MSA treatment, which has been found to induce the transcriptional upregulation of LMP2 and LMP7.45
Despite the clear association between the observed induction of ROS along with the increased expression of Nrf2 (oxidative stress response) and the elevated MHC class I surface expression levels, which are associated with an upregulation of APM components, the exact molecular mechanisms of the observed effects in response to treatment with MSA have not yet been identified. One explanation might be that MSA has been suggested to inhibit HDACs.20 In line with this hypothesis, HDAC inhibitors have been described to upregulate both MHC class I and class II molecules at the cell surface.60 In addition, MSA has been shown to induce the expression of MICA and MICB in Jurkat cells to the same extent as HDAC inhibitors.23 Therefore, further analysis are required to test whether the modulation of the expression pattern of MHC class I molecules by MSA is indeed mediated at least in part by decreased HDAC activities.
In conclusion, our data provide a new molecular mechanism which might explain the potential anti-carcinogenic properties of Se. As MHC class I molecules are often downregulated in tumor cells and thus regarded as one of the key mechanism by which tumor cells might escape from immune surveillance, treatment with MSA might be in particular beneficial for the treatment of tumors exhibiting low MHC class I surface expression levels, thereby improving and likely reshaping the mounting of an immune response.
Material and methods
Cell culture
The murine melanoma cell line B16F10 and human cell lines WM1552c, UKRV, Colo875, BT474 and SK-BR-3 were routinely cultured in RPMI media supplemented with 10% FCS, 100 U/mL penicillin and 100 µg/mL streptomycin, whereas the human colon carcinoma cell line SW480 was maintained in complete DMEM media. All cells were cultured at 37°C in 5% (v/v) CO2 humidified air.
Reagents and treatment of cells
MSA, dimethyldiselenide, sodium selenite and SeMet were all purchased from Sigma-Aldrich. IFNγ was purchased from Immunotools (#12343534). Stock solutions were prepared in either water (MSA, selenite, SeMet) or DMSO (DMDSe). Cells were seeded and incubated to reach adherence. After 24 h, cells were supplemented with the indicated concentrations of Se compounds and/or 200 U/mL IFNγ and incubated as indicated prior to the respective analyses. Non-supplemented and DMSO treated cells served as controls.
Cytotoxicity assay
Cytotoxicity was determined by measurement of LDH release using the CytoTox 96® Non-Radioactive Cytotoxicity Assay (#G1781, Promega) according to the manufactures instructions. In brief, 5 × 10³ cells were seeded per 96-well. After 24 h, total media was removed and replaced by media containing different concentrations of MSA for additional 24 h. LDH release was measured at 490 nm using the infinite M200 pro plate reader (Tecan, Germany).
Cell viability assay
To asses cell viability in response to MSA treatment the CellTiter-Glo® Luminescent Cell Viability Assay (#G7571, Promega) was used according to the manufactures instructions. In brief, 5 × 10³ cells were seeded per 96-well. After 24 h, total media was removed and replaced by media containing different concentrations of MSA (0–10 µM) for additional 24 h. Luminescence measurement was done using the luminometer MicroLumatPlus LB96V (EG&G Berthold Technology, Germany).
Wound healing and migration
For monolayer wound-healing assay, cells were seeded in 12-well plates. At a 100% confluence wounds were made using a sterile pipette tip. Wound size was measured after 8 h as described previously.61 For determination of the cell migration, 1 × 10⁵ of 24 h treated or untreated cells, respectively, cells were seeded into the upper well of the Transwell chamber system (Corning), with medium containing 0.5% FBS. At the lower chamber, 10% FKS was added as an attractant. After incubation at 37°C for 4.5, 18 and 20 h, respectively, the non-migrated cells of the top insert were completely removed, and the cells on the bottom insert surface were lysed with CellTiter-Glo (Promega) before the ATP content was measured in the luminometer (EG&G Berthold Technology, Germany).
2D DIGE analysis
Three biological replicates per sample representing either the control group or the MSA-treated group were subjected to undergo proteomic profiling. DIGE analysis was performed using the minimal labeling approach according to the manufacturer´s instructions (NH DyeAGNOSTICS, Halle, Germany) with the exception that 25 µg of the respective protein lysates as well as the internal protein standard were labeled with 100 pmol of the given G-dye. 2D gel electrophoresis and subsequent MALDI-TOF MS analysis were performed as described previously.62 Differentially expressed proteins were clustered according to their functions using the Panther gene ontology (GO) software (http://pantherdb.org/).63
Flow cytometry
Flow cytometric analysis was performed as previously described.64 Briefly, cells were stained with following monoclonal antibodies (mAb): APC-conjugated anti-mouse MHC class I (H-2Db) (#17–5999, ebioscience), APC-conjugated mouse IgG2a (#400222, Biolegend), APC-conjugated anti-human HLA-ABC (#555555, BD biosciences), APC-conjugated mouse IgG2B (# IC00417, RD systems), before fluorescence was determined on a BD LSRFortessa cytometer (BD Biosciences). Data were analyzed on a free tool “Flowing software” (http://www.uskonaskel.fi/flowingsoftware/).
Determination of intracellular ROS and GSH levels
For determination of ROS levels, 2×10⁵ cells were transferred into a FACS analysis tube, washed with PBS and re-suspended in 1 mL PBS containing 1 µM DCFH-DA (AAT Bioquest®, Inc., CA). After 30 min of incubation at 37°C, cells were centrifuged, supernatant discarded and the cell pellet re-suspended in RPMI media supplemented with or without MSA followed by an incubation of 4 h. After washing the cells with PBS analysis was performed in FL channel of the BD LSRFortessa™ cytometer.
Total GSH (reduced and oxidized) concentrations were determined in plasma and liver homogenates according to a standard procedure coupled to GSH reductase and DTNB.65 The concentrations were calculated using a GSSG standard curve ranging from 1 to 10 nM GSH equivalent/mL.
Determination of glucose uptake
5 × 10⁵ untreated or MSA-treated cells were re-suspended in 2-NBDG solution (0.1 mM in PBS) and incubated for 20 min at RT prior to analysis by flow cytometry (BD LSRFortessa cytometer).
RT-PCR
Total RNA was extracted using the NucleoSpin RNA extraction kit (MACHEREY-NAGEL) according to the manufactures instructions and converted to cDNA using the cDNA synthesis kit and Oligo dT primer from Thermo Scientific. Amplification of the cDNA was performed using the GoTaq® Real-Time qPCR system (Promega) and SybrGreen as a fluorescent reporter. Target specific primers were conducted using the program Primer366 and listed in Table S1. Analysis of amplification data were performed with the Rotor-Gene 6000TM series software (Qiagen, Hilden, Germany) using the method according to Pfaffl.67 Amplifications of GAPDH, RPL13a and ß-Actin were used for normalization. The data are represented as relative mRNA expression levels as x-fold of the control group of at least three separate experiments.
Determination of promoter activity of TAP1, TAP2, TPN and LMP2
Constructs and procedure are described elsewhere.68 In brief, 5×10³ cells were seeded into 96-well plates. After 24 h, cells were co-transfected with 0.3 µg pAPM-luc and pSV-galactosidase vector (Promega), which served as transfection control, using Lipofectamine in OptiMEM (Invitrogen) according to the manufacturers’ instructions. After 6 h, cells were washed and cultured in complete media for further 24 h, before treatment with 2.5 µM MSA. Untreated cells served as the control. After 24 h, cells were lysed and Luc activity was determined using the Luc-assay system (Promega) according to the manufactures instructions. The transfection efficiency was determined by measuring ß-gal activity. Relative luc activity was calculated as (luc activity/ß-gal activity)−(mean pGL3 – mean b-gal activity).
Western blot analysis
For Western Blot analysis, cells were washed in 0.1 M sodium phosphate buffer containing 5 mM EDTA and protease as well as phosphatase inhibitors (Halt™, Thermo Scientific) and lysed using a TissueLyser (Qiagen, Germany). After centrifugation (13.000 x g, 30 min, 4°C) the supernatants were collected and stored at −80°C until further analysis. Determination of protein content was performed according to the method described by Bradford69 modified for a 96-well plate. Western blot analysis was performed as described previously.70 The following primary antibodies were purchases from Cell Signaling Technology and used for immune detection: anti-JAK1 (CST #3332), anti-phospho-JAK1 (CST #3331), anti-phospho-STAT1 (CST #9167), anti-STAT1 (CST #9172), anti-LMP2 (biotrend #PW8205), anti-LMP7 (biotrend #PW8200), anti-PDI1A (CST #3501), anti-phospho-PTEN (CST #9549), anti-PTEN (CST #9556), anti-AKT (CST #9916), anti-phopsho-AKTSer473 (CST #9271), anti-phospho-AKTThr308 (CST #2965), anti-GAPDH (CST #2218). The anti-Nrf2 antibody (Santa Cruz Biotechnology, sc-722) was kindly provided by the group of Prof. Lillig (University of Greifswald).
The secondary HRP-coupled anti-rabbit/anti-mouse Abs were purchased from cell signaling technology and DakoAgilent, respectively.
Statistical analysis
Mean values were calculated from results of at least three independent experiments and given as means ± their standard deprivation (SD). SPSS 20 software was used to analyze significant differences within the groups, therefore Student's t-test was implemented after analyzing variance homogeneity. Differences between the groups were considered to be significantly different at p < 0.05.
Supplementary Material
Disclosure of potential conflicts of interest
No potential conflicts of interest were disclosed.
Financial disclosure
The authors would like to state that they have no financial disclosures to report.
Acknowledgements
We thank Manuela Gellert and Christopher Lillig for providing the Nrf2 antibody.
Funding
This work was supported by an interdisciplinary DFG grant (grant numbers: LI1527/3–1, WE1467/13–1 and MU3275/3–1).
References
- 1.Lunøe K, Gabel-Jensen C, Stürup S, Andresen L, Skov S, Gammelgaard B. Investigation of the selenium metabolism in cancer cell lines. Metallomics 2011; 3:162-8; PMID:21161099; https://doi.org/ 10.1039/C0MT00091D [DOI] [PubMed] [Google Scholar]
- 2.Yan L, DeMars LC. Dietary supplementation with methylseleninic acid, but not selenomethionine, reduces spontaneous metastasis of Lewis lung carcinoma in mice. Int J Cancer 2012; 131:1260-6; PMID:22095442; https://doi.org/ 10.1002/ijc.27355 [DOI] [PubMed] [Google Scholar]
- 3.Chen YC, Prabhu KS, Mastro AM. Is selenium a potential treatment for cancer metastasis? Nutrients 2013; 5:1149-68; PMID:23567478; https://doi.org/ 10.3390/nu5041149 [DOI] [PMC free article] [PubMed] [Google Scholar]
- 4.Chen YC, Prabhu KS, Das A, Mastro AM. Dietary selenium supplementation modifies breast tumor growth and metastasis. Int J cancer 2013; 133:2054-64; PMID:23613334; https://doi.org/ 10.1002/ijc.28224 [DOI] [PubMed] [Google Scholar]
- 5.Labunskyy VM, Hatfield DL, Gladyshev VN. Selenoproteins: molecular pathways and physiological roles. Physiol Rev 2014; 94:739-77; PMID:24987004; https://doi.org/ 10.1152/physrev.00039.2013 [DOI] [PMC free article] [PubMed] [Google Scholar]
- 6.El-Bayoumy K, Sinha R. Molecular chemoprevention by selenium: a genomic approach. Mutat Res 2005; 591:224-36; PMID:16099479; https://doi.org/ 10.1016/j.mrfmmm.2005.04.021 [DOI] [PubMed] [Google Scholar]
- 7.Schrauzer GN, White DA, Schneider CJ. Cancer mortality correlation studies–III: statistical associations with dietary selenium intakes. Bioinorg Chem 1977; 7:23-31; PMID:856291; https://doi.org/ 10.1016/S0006-3061(00)80126-X [DOI] [PubMed] [Google Scholar]
- 8.Clark LC, Combs GF, Turnbull BW, Slate EH, Chalker DK, Chow J, Davis LS, Glover RA, Graham GF, Gross EG et al.. Effects of selenium supplementation for cancer prevention in patients with carcinoma of the skin. A randomized controlled trial. Nutritional Prevention of Cancer Study Group. JAMA 1996; 276:1957-63; PMID:8971064; https://doi.org/ 10.1001/jama.1996.03540240035027 [DOI] [PubMed] [Google Scholar]
- 9.Ip C. Lessons from basic research in selenium and cancer prevention. J Nutr 1998; 128:1845-54; PMID:9808633 [DOI] [PubMed] [Google Scholar]
- 10.Lippman SM, Klein EA, Goodman PJ, Lucia MS, Thompson IM, Ford LG, Parnes HL, Minasian LM, Gaziano JM, Hartline JA et al.. Effect of selenium and vitamin E on risk of prostate cancer and other cancers: the Selenium and Vitamin E Cancer Prevention Trial (SELECT). JAMA 2009; 301:39-51; PMID:19066370; https://doi.org/ 10.1001/jama.2008.864 [DOI] [PMC free article] [PubMed] [Google Scholar]
- 11.Whanger PD. Selenium and its relationship to cancer: an update. Br J Nutr 2004; 91:11-28; PMID:14748935; https://doi.org/ 10.1079/BJN20031015 [DOI] [PubMed] [Google Scholar]
- 12.Rayman MP. Selenium in cancer prevention: a review of the evidence and mechanism of action. Proc Nutr Soc 2005; 64:527-42; PMID:16313696; https://doi.org/ 10.1079/PNS2005467 [DOI] [PubMed] [Google Scholar]
- 13.Ip C, Ganther HE. Activity of methylated forms of selenium in cancer prevention. Cancer Res 1990; 50:1206-11; PMID:2105164 [PubMed] [Google Scholar]
- 14.Ip C, Thompson HJ, Zhu Z, Ganther HE. In vitro and in vivo studies of methylseleninic acid: evidence that a monomethylated selenium metabolite is critical for cancer chemoprevention. Cancer Res 2000; 60:2882-6; PMID:10850432 [PubMed] [Google Scholar]
- 15.Fernandes AP, Wallenberg M, Gandin V, Misra S, Tisato F, Marzano C, Rigobello MP, Kumar S, Björnstedt M. Methylselenol formed by spontaneous methylation of selenide is a superior selenium substrate to the thioredoxin and glutaredoxin systems. PLoS One 2012; 7:e50727; PMID:23226364; https://doi.org/ 10.1371/journal.pone.0050727 [DOI] [PMC free article] [PubMed] [Google Scholar]
- 16.Zeng H, Wu M. The Inhibitory Efficacy of Methylseleninic Acid Against Colon Cancer Xenografts in C57BL/6 Mice. Nutr Cancer 2015; 67:831-8; PMID:26011019; https://doi.org/ 10.1080/01635581.2015.1042547 [DOI] [PubMed] [Google Scholar]
- 17.Cassidy PB, Fain HD, Cassidy JP, Tran SM, Moos PJ, Boucher KM, Gerads R, Florell SR, Grossman D, Leachman SA. Selenium for the prevention of cutaneous melanoma. Nutrients 2013; 5:725-49; PMID:23470450; https://doi.org/ 10.3390/nu5030725 [DOI] [PMC free article] [PubMed] [Google Scholar]
- 18.Qi Y, Fu X, Xiong Z, Zhang H, Hill SM, Rowan BG, Dong Y. Methylseleninic acid enhances paclitaxel efficacy for the treatment of triple-negative breast cancer. PLoS One 2012; 7:e31539; PMID:22348099; https://doi.org/ 10.1371/journal.pone.0031539 [DOI] [PMC free article] [PubMed] [Google Scholar]
- 19.Hu C, Liu M, Zhang W, Xu Q, Ma K, Chen L, Wang Z, He S, Zhu H, Xu N. Upregulation of KLF4 by methylseleninic acid in human esophageal squamous cell carcinoma cells: Modification of histone H3 acetylation through HAT/HDAC interplay. Mol Carcinog 2015; 54:1051-9; PMID:24789055; https://doi.org/ 10.1002/mc.22174 [DOI] [PubMed] [Google Scholar]
- 20.Kassam S, Goenaga-Infante H, Maharaj L, Hiley CT, Juliger S, Joel SP. Methylseleninic acid inhibits HDAC activity in diffuse large B-cell lymphoma cell lines. Cancer Chemother Pharmacol 2011; 68:815-21; PMID:21519842; https://doi.org/ 10.1007/s00280-011-1649-1 [DOI] [PubMed] [Google Scholar]
- 21.Doyle K, Fitzpatrick FA. Redox signaling, alkylation (carbonylation) of conserved cysteines inactivates class I histone deacetylases 1, 2, and 3 and antagonizes their transcriptional repressor function. J Biol Chem 2010; 285:17417-24; PMID:20385560; https://doi.org/ 10.1074/jbc.M109.089250 [DOI] [PMC free article] [PubMed] [Google Scholar]
- 22.Zhang J, Basher F, Wu JD. NKG2D Ligands in Tumor Immunity: Two Sides of a Coin. Front Immunol 2015; 6:97; PMID:25788898; https://doi.org/ 10.3389/fimmu.2015.00097 [DOI] [PMC free article] [PubMed] [Google Scholar]
- 23.Hagemann-Jensen M, Uhlenbrock F, Kehlet S, Andresen L, Gabel-Jensen C, Ellgaard L, Gammelgaard B, Skov S. The selenium metabolite methylselenol regulates the expression of ligands that trigger immune activation through the lymphocyte receptor NKG2D. J Biol Chem 2014; 289:31576-90; PMID:25258323; https://doi.org/ 10.1074/jbc.M114.591537 [DOI] [PMC free article] [PubMed] [Google Scholar]
- 24.Bauer S, Groh V, Wu J, Steinle A, Phillips JH, Lanier LL, Spies T. Activation of NK cells and T cells by NKG2D, a receptor for stress-inducible MICA. Science 1999; 285:727-9; PMID:10426993; https://doi.org/ 10.1126/science.285.5428.727 [DOI] [PubMed] [Google Scholar]
- 25.Groh V, Smythe K, Dai Z, Spies T. Fas-ligand-mediated paracrine T cell regulation by the receptor NKG2D in tumor immunity. Nat Immunol 2006; 7:755-62; PMID:16732291; https://doi.org/ 10.1038/ni1350 [DOI] [PubMed] [Google Scholar]
- 26.Jamieson AM, Diefenbach A, McMahon CW, Xiong N, Carlyle JR, Raulet DH. The role of the NKG2D immunoreceptor in immune cell activation and natural killing. Immunity 2002; 17:19-29; PMID:12150888; https://doi.org/ 10.1016/S1074-7613(02)00333-3 [DOI] [PubMed] [Google Scholar]
- 27.Guo ZY, Lv YG, Wang L, Shi SJ, Yang F, Zheng GX, Wen WH, Yang AG.. Predictive value of HLA-G and HLA-E in the prognosis of colorectal cancer patients. Cell Immunol 2015; 293:10-6; PMID:25461612; https://doi.org/ 10.1016/j.cellimm.2014.10.003 [DOI] [PubMed] [Google Scholar]
- 28.Andersson E, Poschke I, Villabona L, Carlson JW, Lundqvist A, Kiessling R, Seliger B, Masucci GV. Non-classical HLA-class I expression in serous ovarian carcinoma: Correlation with the HLA-genotype, tumor infiltrating immune cells and prognosis. Oncoimmunology 5:e1052213; PMID:26942060; https://doi.org/ 10.1080/2162402X.2015.1052213 [DOI] [PMC free article] [PubMed] [Google Scholar]
- 29.Tremante E, Ginebri A, Lo Monaco E, Benassi B, Frascione P, Grammatico P, Cappellacci S, C Catricalà, Arcelli D, Natali PG et al.. A melanoma immune response signature including Human Leukocyte Antigen-E. Pigment Cell Melanoma Res 2014; 27:103-12; PMID:24011128; https://doi.org/ 10.1111/pcmr.12164 [DOI] [PubMed] [Google Scholar]
- 30.Pietra G, Romagnani C, Manzini C, Moretta L, Mingari MC. The emerging role of HLA-E-restricted CD8+ T lymphocytes in the adaptive immune response to pathogens and tumors. J Biomed Biotechnol 2010; 2010:907092; PMID:20634877; https://doi.org/ 10.1155/2010/907092 [DOI] [PMC free article] [PubMed] [Google Scholar]
- 31.Enqvist M, Nilsonne G, Hammarfjord O, Wallin RP, Björkström NK, Björnstedt M, Hjerpe A, Ljunggren HG, Dobra K, Malmberg KJ et al.. Selenite induces posttranscriptional blockade of HLA-E expression and sensitizes tumor cells to CD94/NKG2A-positive NK cells. J Immunol 2011; 187:3546-54; PMID:21890659; https://doi.org/ 10.4049/jimmunol.1100610 [DOI] [PubMed] [Google Scholar]
- 32.Seliger B. The link between MHC class I abnormalities of tumors, oncogenes, tumor suppressor genes, and transcription factors. J Immunotoxicol 2014; 11:308-10; PMID:24479372; https://doi.org/ 10.3109/1547691X.2013.875084 [DOI] [PubMed] [Google Scholar]
- 33.Garrido F, Aptsiauri N, Doorduijn EM, Garcia Lora AM, van Hall T. The urgent need to recover MHC class I in cancers for effective immunotherapy. Curr Opin Immunol 2016; 39:44-51; PMID:26796069; https://doi.org/ 10.1016/j.coi.2015.12.007 [DOI] [PMC free article] [PubMed] [Google Scholar]
- 34.Khong HT, Restifo NP. Natural selection of tumor variants in the generation of "tumor escape" phenotypes. Nat Immunol 2002; 3:999-1005; PMID:12407407; https://doi.org/ 10.1038/ni1102-999 [DOI] [PMC free article] [PubMed] [Google Scholar]
- 35.Algarra I, García-Lora A, Cabrera T, Ruiz-Cabello F, Garrido F. The selection of tumor variants with altered expression of classical and nonclassical MHC class I molecules: implications for tumor immune escape. Cancer Immunol Immunother 2004; 53:904-10; PMID:15069585; https://doi.org/ 10.1007/s00262-004-0517-9 [DOI] [PMC free article] [PubMed] [Google Scholar]
- 36.García-Lora A, Algarra I, Collado A, Garrido F. Tumour immunology, vaccination and escape strategies. Eur J Immunogenet 2003; 30:177-83; PMID:12786993; https://doi.org/26097483 10.1046/j.1365-2370.2003.00384.x [DOI] [PubMed] [Google Scholar]
- 37.Oliveira CC, van Hall T. Alternative antigen processing for MHC class I: Multiple roads lead to Rome. Front Immunol 2015; 6:298; PMID:26097483; https://doi.org/ 10.3389/fimmu.2015.00298 [DOI] [PMC free article] [PubMed] [Google Scholar]
- 38.Garrido F, Romero I, Aptsiauri N, Garcia-Lora AM. Generation of MHC class I diversity in primary tumors and selection of the malignant phenotype. Int J cancer 2016; 138:271-80; PMID:25471439; https://doi.org/ 10.1002/ijc.29375 [DOI] [PubMed] [Google Scholar]
- 39.Makhadiyeva D, Lam L, Moatari M, Vallance J, Zheng Y, Campbell EC, Powis SJ. MHC class I dimer formation by alteration of the cellular redox environment and induction of apoptosis. Immunology 2012; 135:133-9; PMID:22044191; https://doi.org/ 10.1111/j.1365-2567.2011.03518.x [DOI] [PMC free article] [PubMed] [Google Scholar]
- 40.Kukita K, Tamura Y, Tanaka T, Kajiwara T, Kutomi G, Saito K, Okuya K, Takaya A, Kanaseki T, Tsukahara T et al.. Cancer-associated oxidase ERO1-α regulates the expression of MHC class I molecule via oxidative folding. J Immunol 2015; 194:4988-96; PMID:25870246; https://doi.org/ 10.4049/jimmunol.1303228 [DOI] [PubMed] [Google Scholar]
- 41.Toker A, Marmiroli S. Signaling specificity in the Akt pathway in biology and disease. Adv Biol Regul 2014; 55:28-38; PMID:24794538; https://doi.org/ 10.1016/j.jbior.2014.04.001 [DOI] [PMC free article] [PubMed] [Google Scholar]
- 42.Lennicke C, Rahn J, Lichtenfels R, Wessjohann LA, Seliger B. Hydrogen peroxide - Production, fate and role in redox signaling of tumor cells. Cell Commun Signal 2015; 13; PMID:26369938; https://doi.org/26913609 10.1186/s12964-015-0118-6 [DOI] [PMC free article] [PubMed] [Google Scholar]
- 43.Colangelo T, Polcaro G, Ziccardi P, Pucci B, Muccillo L, Galgani M, Fucci A, Milone MR, Budillon A, Santopaolo M et al.. Proteomic screening identifies calreticulin as a miR-27a direct target repressing MHC class I cell surface exposure in colorectal cancer. Cell Death Dis 2016; 7:e2120; PMID:26913609; https://doi.org/ 10.1038/cddis.2016.28 [DOI] [PMC free article] [PubMed] [Google Scholar]
- 44.Kang K, Park B, Oh C, Cho K, Ahn K. A role for protein disulfide isomerase in the early folding and assembly of MHC class I molecules. Antioxid Redox Signal 2009; 11:2553-61; PMID:19388826; https://doi.org/ 10.1089/ars.2009.2465 [DOI] [PubMed] [Google Scholar]
- 45.Kwak MK, Wakabayashi N, Greenlaw JL, Yamamoto M, Kensler TW. Antioxidants enhance mammalian proteasome expression through the Keap1-Nrf2 signaling pathway. Mol Cell Biol 2003; 23:8786-94; PMID:14612418; https://doi.org/ 10.1128/MCB.23.23.8786-8794.2003 [DOI] [PMC free article] [PubMed] [Google Scholar]
- 46.Seliger B, Wollscheid U, Momburg F, Blankenstein T, Huber C. Characterization of the major histocompatibility complex class I deficiencies in B16 melanoma cells. Cancer Res 2001; 61:1095-9; PMID:11221838 [PubMed] [Google Scholar]
- 47.Yoshihama S, Roszik J, Downs I, Meissner TB, Vijayan S, Chapuy B, Sidiq T, Shipp MA, Lizee GA, Kobayashi KS. NLRC5/MHC class I transactivator is a target for immune evasion in cancer. Proc Natl Acad Sci U S A 2016; 113:5999-6004; PMID:27162338; https://doi.org/ 10.1073/pnas.1602069113 [DOI] [PMC free article] [PubMed] [Google Scholar]
- 48.Misra S, Boylan M, Selvam A, Spallholz JE, Björnstedt M. Redox-active selenium compounds - from toxicity and cell death to cancer treatment. Nutrients 2015; 7:3536-56; PMID:25984742; https://doi.org/ 10.3390/nu7053536 [DOI] [PMC free article] [PubMed] [Google Scholar]
- 49.Jucaud V, Ravindranath MH, Terasaki PI. Immunobiology of HLA Class-Ib Molecules in Transplantation. SOJ Immunol 2015; 3:1-15; https://doi.org/ 10.15226/2372-0948/3/4/00137 [DOI] [Google Scholar]
- 50.Pietra G, Romagnani C, Moretta L, Mingari MC. HLA-E and HLA-E-bound peptides: recognition by subsets of NK and T cells. Curr Pharm Des 2009; 15:3336-44; PMID:19860683; https://doi.org/ 10.2174/138161209789105207 [DOI] [PubMed] [Google Scholar]
- 51.Sensi M, Pietra G, Molla A, Nicolini G, Vegetti C, Bersani I, Millo E, Weiss E, Moretta L, Mingari MC et al.. Peptides with dual binding specificity for HLA-A2 and HLA-E are encoded by alternatively spliced isoforms of the antioxidant enzyme peroxiredoxin 5. Int Immunol 2009; 21:257-68; PMID:19181932; https://doi.org/ 10.1093/intimm/dxn141 [DOI] [PubMed] [Google Scholar]
- 52.Seliger B, Jasinski-Bergner S, Quandt D, Stoehr C, Bukur J, Wach S, Legal W, Taubert H, Wullich B, Hartmann A. HLA-E expression and its clinical relevance in human renal cell carcinoma. Oncotarget 2016; 7:7-22; PMID:27589686; https://doi.org/19557012 10.18632/oncotarget.11744 [DOI] [PMC free article] [PubMed] [Google Scholar]
- 53.Tsvetkov P, Reuven N, Shaul Y. Ubiquitin-independent p53 proteasomal degradation. Cell Death Differ 2010; 17:103-8; PMID:19557012; https://doi.org/ 10.1038/cdd.2009.67 [DOI] [PubMed] [Google Scholar]
- 54.Zhu K, Wang J, Zhu J, Jiang J, Shou J, Chen X. p53 induces TAP1 and enhances the transport of MHC class I peptides. Oncogene 1999; 18:7740-7; PMID:10618714; https://doi.org/ 10.1038/sj.onc.1203235 [DOI] [PubMed] [Google Scholar]
- 55.Wang L, Guo X, Wang J, Jiang C, Bosland MC, J Lü, Deng Y. Methylseleninic acid superactivates p53-senescence cancer progression barrier in prostate lesions of pten-knockout mouse. Cancer Prev Res (Phila) 2016; 9:35-42; PMID:26511486; https://doi.org/ 10.1158/1940-6207.CAPR-15-0236 [DOI] [PMC free article] [PubMed] [Google Scholar]
- 56.Zhang Y, Zheng S, Zheng JS, Wong KH, Huang Z, Ngai SM, Zheng W, Wong YS, Chen T. Synergistic induction of apoptosis by methylseleninic acid and cisplatin, the role of ROS-ERK/AKT-p53 pathway. Mol Pharm 2014; 11:1282-93; PMID:24555485; https://doi.org/ 10.1021/mp400749f [DOI] [PubMed] [Google Scholar]
- 57.Hubackova S, Kucerova A, Michlits G, Kyjacova L, Reinis M, Korolov O, Bartek J, Hodny Z. IFNγ induces oxidative stress, DNA damage and tumor cell senescence via TGFβ/SMAD signaling-dependent induction of Nox4 and suppression of ANT2. Oncogene 2016; 35:1236-49; PMID:25982278; https://doi.org/ 10.1038/onc.2015.162 [DOI] [PubMed] [Google Scholar]
- 58.Manea A, Tanase LI, Raicu M, Simionescu M. Jak/STAT signaling pathway regulates nox1 and nox4-based NADPH oxidase in human aortic smooth muscle cells. Arterioscler Thromb Vasc Biol 2010; 30:105-12; PMID:19834108; https://doi.org/ 10.1161/ATVBAHA.109.193896 [DOI] [PubMed] [Google Scholar]
- 59.Seifert U, Bialy LP, Ebstein F, Bech-Otschir D, Voigt A, Schröter F, Prozorovski T, Lange N, Steffen J, Rieger M et al.. Immunoproteasomes preserve protein homeostasis upon interferon-induced oxidative stress. Cell 2010; 142:613-24; PMID:20723761; https://doi.org/ 10.1016/j.cell.2010.07.036 [DOI] [PubMed] [Google Scholar]
- 60.Woan KV, Lienlaf M, Perez-Villaroel P, Lee C, Cheng F, Knox T, Woods DM, Barrios K, Powers J, Sahakian E et al.. Targeting histone deacetylase 6 mediates a dual anti-melanoma effect: Enhanced antitumor immunity and impaired cell proliferation. Mol Oncol 2015; 9:1447-57; PMID:25957812; https://doi.org/ 10.1016/j.molonc.2015.04.002 [DOI] [PMC free article] [PubMed] [Google Scholar]
- 61.Steven A, Heiduk M, Recktenwald CV, Hiebl B, Wickenhauser C, Massa C, Seliger B. Colorectal Carcinogenesis: Connecting K-RAS-Induced Transformation and CREB Activity In Vitro and In Vivo. Mol Cancer Res 2015; 13:1248-62; PMID:25934695; https://doi.org/ 10.1158/1541-7786.MCR-14-0590 [DOI] [PubMed] [Google Scholar]
- 62.Lennicke C, Rahn J, Kipp AP, Dojčinović BP, Müller A, Wessjohann LA,Lichtenfels R, Seliger B. Individual effects of different selenocompounds on the hepatic proteome and energy metabolism. BBA - Gen Subj 2016; 30304-X; PMID:27565357; https://doi.org/26578592 10.1016/j.bbagen.2016.08.015 [DOI] [PubMed] [Google Scholar]
- 63.Mi H, Poudel S, Muruganujan A, Casagrande JT, Thomas PD. PANTHER version 10: expanded protein families and functions, and analysis tools. Nucleic Acids Res 2016; 44:D336-42; PMID:26578592; https://doi.org/ 10.1093/nar/gkv1194 [DOI] [PMC free article] [PubMed] [Google Scholar]
- 64.Jasinski-Bergner S, Stehle F, Gonschorek E, Kalich J, Schulz K, Huettelmaier S, Braun J, Seliger B. Identification of 14-3-3β gene as a novel miR-152 target using a proteome-based approach. J Biol Chem 2014; 289:31121-35; PMID:25228695; https://doi.org/ 10.1074/jbc.M114.556290 [DOI] [PMC free article] [PubMed] [Google Scholar]
- 65.Tipple TE, Rogers LK. Methods for the determination of plasma or tissue glutathione levels. Methods Mol Biol 2012; 889:1-8; PMID:22669655; https://doi.org/ 10.1007/978-1-61779-867-2_1 [DOI] [PMC free article] [PubMed] [Google Scholar]
- 66.Untergasser A, Cutcutache I, Koressaar T, Ye J, Faircloth BC, Remm M, Rozen SG. Primer3-new capabilities and interfaces. Nucleic Acids Res 2012; 40:e115; PMID:22730293; https://doi.org/ 10.1093/nar/gks596 [DOI] [PMC free article] [PubMed] [Google Scholar]
- 67.Pfaffl MW. A new mathematical model for relative quantification in real-time RT-PCR. Nucleic Acids Res 2001; 29:e45; PMID:11328886; https://doi.org/ 10.1093/nar/29.9.e45 [DOI] [PMC free article] [PubMed] [Google Scholar]
- 68.Bukur J, Herrmann F, Handke D, Recktenwald C, Seliger B. Identification of E2F1 as an important transcription factor for the regulation of tapasin expression. J Biol Chem 2010; 285:30419-26; PMID:20663889; https://doi.org/ 10.1074/jbc.M109.094284 [DOI] [PMC free article] [PubMed] [Google Scholar]
- 69.Bradford MM. A rapid and sensitive method for the quantitation of microgram quantities of protein utilizing the principle of protein-dye binding. Anal Biochem 1976; 72:248-54; PMID:942051; https://doi.org/ 10.1016/0003-2697(76)90527-3 [DOI] [PubMed] [Google Scholar]
- 70.Steven A, Leisz S, Massa C, Iezzi M, Lattanzio R, Lamolinara A, Bukur J, Müller A, Hiebl B, Holzhausen HJ et al.. HER-2/neu mediates oncogenic transformation via altered CREB expression and function. Mol Cancer Res 2013; 11:1462-77; PMID:24025972; https://doi.org/ 10.1158/1541-7786.MCR-13-0125 [DOI] [PubMed] [Google Scholar]
Associated Data
This section collects any data citations, data availability statements, or supplementary materials included in this article.