Abstract
Biologic treatment of T1D typically results in transient stabilization of C-peptide levels (a surrogate for endogenous insulin secretion) in some patients, followed by progression at the same rate as in untreated control groups. Here, we used integrated systems biology and flow cytometry approaches with clinical trial blood samples to elucidate pathways associated with C-peptide stabilization in T1D subjects treated with the anti-CD3 monoclonal antibody teplizumab. We identified a population of CD8 T cells that accumulated in subjects with the best response to treatment (responders) and showed that these cells phenotypically resembled exhausted T cells by expressing high levels of the transcription factor EOMES, effector molecules, and multiple inhibitory receptors (IRs), including TIGIT and KLRG1. These cells expanded after treatment, with levels peaking after 3–6 months. To functionally characterize these exhausted-like T cells, we isolated memory CD8 TIGIT+KLRG1+ T cells from responders and showed that they exhibited expanded TCR clonotypes, indicative of prior in vivo expansion; recognized a broad-based spectrum expressed of environmental and auto-antigens; and were hypo-proliferative during polyclonal stimulation, increasing expression of IR genes and decreasing cell cycle genes. Triggering these cells with a recombinant ligand for TIGIT during polyclonal stimulation further downregulated their activation, demonstrating their exhausted phenotype was not terminal. These findings identify and functionally characterize a partially exhausted cell type associated with response to teplizumab therapy and suggest that pathways regulating T cell exhaustion may play a role in successful immune interventions for T1D.
Introduction
The therapeutic goal for type 1 diabetes (T1D) is to preserve β-cell function, commonly monitored by measuring C-peptide levels. Biologic therapies with distinct immunologic mechanisms of action, including anti-CD3 (otelixizumab and teplizumab), anti-CD20 (rituximab), and costimulation blockade (abatacept), are partially effective in individuals newly diagnosed with T1D (1, 2). Since T cells play a key role in the pathophysiology of T1D (3), much of the effort in finding new therapies has been directed towards inducing T cell unresponsiveness (tolerance) (1). Multiple mechanisms have been associated with T cell tolerance in research settings (4, 5), but this knowledge has not yet led to long term therapeutic benefit in T1D (1). One mechanism that can lead to T cell unresponsiveness in vivo is T cell exhaustion (8, 11, 42). Exhausted T cells are characterized by loss of effector functions (cytokine production and proliferation); expression of multiple inhibitory receptors (IRs); differential connectivity of transcription factors; low metabolic activity, and dependence on continuous presence of antigen (4, 6–9). Recently, T cell exhaustion was identified as a beneficial prognostic indicator in several autoimmune diseases (10).
Transcriptomic measurements are widely used for unbiased mechanistic studies and for biomarker identification. These studies have been particularly successful with cancer, where large data sets comprising hundreds to thousands of samples, are freely available to the research community (11). These big data approaches have been more challenging in T1D studies, in part because of difficulties accessing the primary diseased tissue. Instead, since blood collection is more practical, numerous investigators have focused on classification of T1D patients using transcriptome profiling of whole blood and leukocyte populations. While whole blood signatures have been identified in subjects with T1D relative to controls (12), little is known of transcript signatures associated with response to therapy.
To identify mechanisms involved in preservation of beta cell function, we used a systems biology approach to interrogate samples from the AbATE study, a randomized controlled clinical trial of teplizumab treatment in new onset T1D (13). Importantly, this was a longitudinal study with samples collected from the same individual at multiple time points. Furthermore, individuals were synchronized in time relative to the onset of T1D and clinical phenotypes such as C-peptide levels were measured at each collection time point. In this study, we used unbiased whole blood transcriptomic approaches to identify cellular and molecular markers that accompanied successful treatment with a non-Fc binding anti-CD3 monoclonal antibody (teplizumab) (13).We describe an EOMES-associated transcriptional signature that is associated with maintenance of C-peptide, and is expressed by memory CD8 T cells that phenotypically and functionally resemble partially exhausted T cells, suggesting their role in tolerance induction.
Results
Expression of EOMES-associated genes is correlated with C-peptide levels
AbATE was a randomized controlled trial designed (Figure S1) to determine whether two 14-day courses of treatment with teplizumab a year apart would reduce the decline in C-peptide levels in T1D patients two years after disease onset (13). The study included 25 untreated control subjects, all of whom showed ≥40% loss of baseline C-peptide levels, measured as mean area under the curve (AUC) in a 4-hr mixed meal tolerance test. The teplizumab-treated group (N=49 subjects who could be evaluated of the 52 total subjects) comprised 27 subjects (55%) whose C-peptide also declined by ≥40% (termed non-responders), and 22 subjects (44%) who lost <40% of baseline AUC (termed responders). Here we use the abbreviations R, NR and C to refer to responders, non-responders, and untreated controls, respectively. The numbers and characteristics of samples used for each of the approaches utilized are described in Table S1.
We first tested the feasibility of systems approaches to this problem by conducting microarray analysis on whole blood samples of subjects from the 12-month visit when C-peptide differences between the groups were the greatest, but prior to treatment with the second course of teplizumab. To search for differences at the level of biological processes associated with networks of genes, we monitored levels of immune cells and pathways using predefined sets (modules) of co-regulated immune genes (14) using modular approaches. Since C-peptide AUC is commonly used as a marker of T1D progression (2), we reasoned that genes and pathways whose expression was most correlated with AUC would include genes involved in beta cell preservation. Our experimental approach to test this hypothesis is outlined in Figure S2.
We ranked all genes by correlation with AUC, then tested for pathways over-represented in the most-highly correlated genes testing for gene overlap with predefined gene modules (14, 15). We first tested AUC correlated genes for overlap with a set of modules defined by expression in different hematopoietic cell types (15). This analysis revealed a single module of NK/T cell genes (previously termed “module 559” (15)) that overlapped significantly with a range of set sizes for AUC-correlated genes (Figure S3). A plot from one representative set size is shown in Figure 1A. Overlapping genes included cytotoxic genes (GZMA, GZMH, GZMK) and cell surface markers common to both CD8 T cells and NK cells (CD160, NKG7). When an equivalent set size of genes arranged in random order was used (Figure 1A), none of the modules showed significant overlap. Thus, CD8 T cell and NK cell genes were most strongly associated with C-peptide levels.
Figure 1. An NK/T cell, EOMES-associated gene signature was detected in whole blood of teplizumab R subjects.
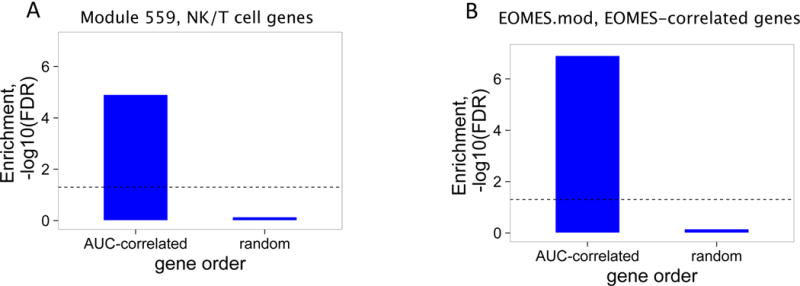
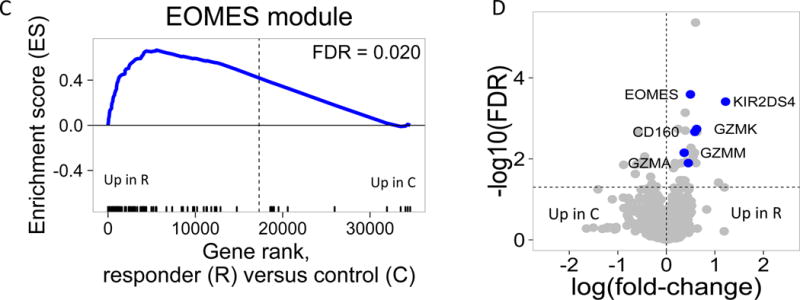
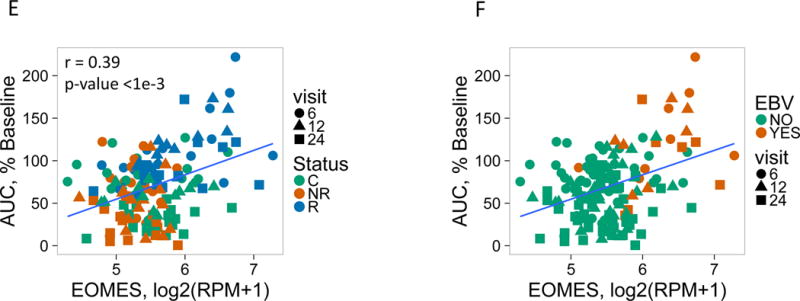
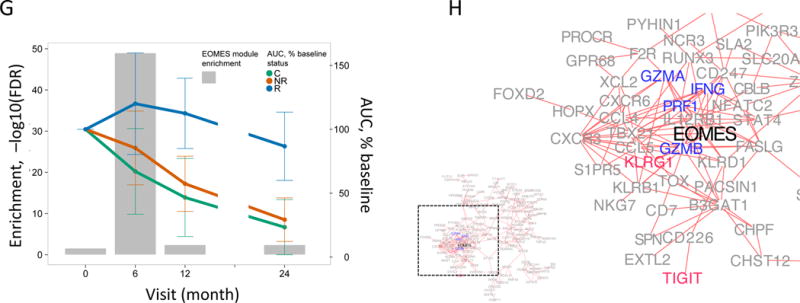
(A) and (B) Bar plots of the overlap between module 559 (A) or EOMES.mod (B) and the 400 top C-peptide-correlated or randomly ordered genes. Dashed line, FDR = 0.05. (C) Blue line, enrichment score for overrepresentation of EOMES.mod genes in a list of all genes ranked by expression in R versus C samples. Solid vertical black lines, positions of EOMES.mod genes in the ranked list. Dashed vertical line, median number of genes. (D) Differential gene expression for R versus C subjects. Blue dots, selected NK/CD8 T cell genes; grey dots, all other genes. Horizontal dashed line, FDR = 0.05; vertical dashed line, log2(fold-change) = 0. (E) EOMES gene expression versus AUC. The p-value was calculated using independent permutation analysis of samples from each visit. (F) EOMES expression versus AUC, colored by EBV reactivation. (G) Overlap of AUC correlated genes (N = 300, Table S2) with the top 300 EOMES-associated genes. The right Y axis shows C-peptide AUC levels (mean + SD). (H) Left, a protein-protein interaction network of the 300 genes most highly correlated with EOMES expression. Right, expanded view of the boxed area.
To further characterize pathways, processes and cell types correlated with C-peptide levels, we extended the analysis of AUC-correlated genes to a second set of immune modules, termed immune marker modules (14). This set of modules comprised the top genes correlated with various hematopoietic cell CD molecules, cytokines and transcription factors in an immune cell gene expression atlas (14). Importantly, genes in each module were not necessarily unique and many of the modules shared genes (14). When tested against AUC-correlated genes, numerous modules showed significant overlap (Figure S3). The most significant overlap was seen with a module of genes associated with the transcription factor EOMES (EOMES.mod, Figure 1B); and with other gene modules (N=12) that shared significant numbers of genes (Figure S3) with EOMES.mod (all showed >~5% overlap, hypergeometric p-values ≤ 1.5e-7). Modules not significantly overlapping with EOMES.mod (N=98) did not show significant overlap with AUC-correlated genes (Figure S3). Moreover, none of the modules showed coherent and significant overlap with randomly ranked genes (Figure S3, Figure 1B). Together these findings indicate that several modules sharing significant numbers of genes with EOMES.mod were enriched in AUC-correlated genes. Since EOMES and EOMES-associated genes consistently scored near the top in many different analyses in our studies (Figure 1), we selected EOMES-correlated genes (Table S2) as a prototype gene set to use in subsequent studies, focusing on the top 100–300 EOMES-associated genes.
EOMES-associated gene levels correlate with the R phenotype
After identifying an EOMES-associated signature across all samples, we tested for association of the signature with the different subject groups using Gene Set Enrichment Analysis (GSEA) (16). We quantified enrichment of immune molecular modules (14) in gene lists ranked by expression in R versus C or R versus NR. EOMES.mod, and other modules sharing significant numbers of genes were found to have high enrichment scores (ES) coupled with high −log10 FDR, or lowest corrected – p-values, indicating preferential association with R versus C samples (Figure S4). EOMES.mod genes were significantly associated with R, as compared with C (Figure 1C). These findings indicate that elevated levels of EOMES-associated genes were associated with the R phenotype.
EOMES-associated gene expression correlates with C-peptide kinetics
To determine temporal changes in EOMES-associated gene expression, we expanded our analysis to include all available whole blood RNA samples in the AbATE study (0, 6, 12, and 24 month visits, Table S1). For these expanded studies, we utilized RNA sequencing (RNA-seq) technology which is rapidly supplanting microarray analysis as the method of choice for transcriptomic analysis (17). Consistent with the microarray analysis, we detected increased expression of EOMES and several other CD8 T cell/NK cell genes in R samples (Figure 1D). Comparing EOMES transcript to clinical outcomes, we found that levels of EOMES transcript were significantly correlated with AUC across all samples (Figure 1E) most strongly in R samples. We also found that levels of EOMES transcript and AUC were significantly correlated with Epstein-Barr virus (EBV) reactivation, indicating that failure to control EBV is associated with increased expression of EOMES (Figure 1F).
The kinetics of the EOMES-associated gene up-regulation was examined by detecting their enrichment in AUC-correlated genes at each individual timed visit (Figure 1G). Enrichment of EOMES-associated genes following the first course of treatment was greatest at the 6-month visit, and decreased at the 12- and 24-month visits. Since RNA samples from the 18-month visit were not available, we were unable to determine how gene expression levels were affected by the second course of therapy. Changes in expression of EOMES-associated genes paralleled the changes in C-peptide levels observed clinically (Figure 1G).
To test interconnectedness of EOMES-associated genes, we projected them onto a protein-protein interaction network (18). The resulting network graph (Figure 1H) showed that EOMES-associated genes comprised a highly interconnected set of proteins and were highly enriched in genes having known interactions (FDR<2e-16). The network was also significantly enriched for genes annotated with the KEGG term “Natural killer cell mediated cytotoxicity” (FDR = 2.9e-4), and contained both effector molecules (GZMA, GZMB, PRF1 and IFNG) and inhibitory receptors (KLRG1, TIGIT).
R subjects display increased levels of CD8 T cells expressing EOMES-associated genes
To determine what cells types were best correlated with EOMES mRNA, we performed a comparison of EOMES expression levels by RNAseq with frequencies of various cell types determined by flow cytometry tests conducted on PBMC samples from the same visits (19). Of all the populations tested (N = 33), EOMES levels were best correlated with levels of CD8 memory T cells (r = 0.71), and more weakly with NK cells (r = 0.33) (Figure S5).
To better determine what cell types express EOMES-associated genes, we augmented our gene expression analysis with in depth flow cytometry analysis. We interrogated cryopreserved PBMC by flow cytometry using panels of monoclonal antibodies (mAbs) targeting cell subset markers and selected proteins encoded by EOMES-associated genes (Table S3). We began by performing a broad univariate analysis, followed by co-expression analyses, and then a focused longitudinal analyses (Figure S6).
We first compared subjects that exhibited extreme EOMES high (mostly R subjects) and EOMES low (mostly NR) gene expression profiles (Table S1). We used both “mean fluorescence intensity” (MFI) and “percent positive cells” as metrics for single cell marker expression. As shown in Figure 2A, MFI for the inhibitory receptors TIGIT, KLRG1 and CD160 was increased on CD8 T cells, yet EOMES protein levels did not differ significantly with any cell type. In contrast, both the overall fold-change and significance of expression differences were greater when percentages of positive cells were measured (compare Figures 2A and 2B). The proportion of memory CD8 and, to a lesser extent, naive CD8 T cells, expressing EOMES and other signature proteins increased most significantly in EOMES high subjects (Figure 2B). An example of the increase in percentage of cells co-expressing EOMES-associated proteins in selected EOMES high versus EOMES low subjects is shown in Figure 2C.
Figure 2. Accumulation in R subjects of a CD8 cell subset marked by EOMES, KLRG1, and TIGIT protein expression.
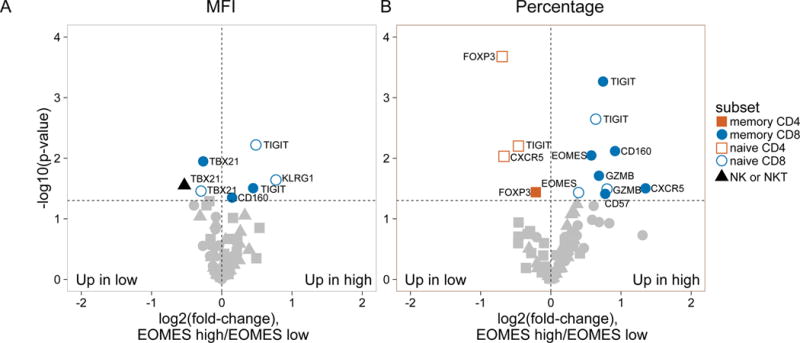
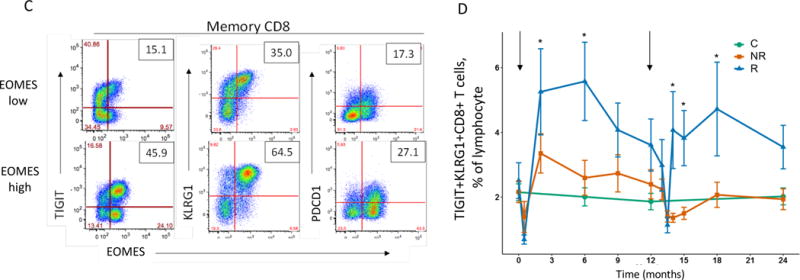

(A) and (B) Differential surface expression of mean fluorescence intensity (MFI) (A) and percentages of marker positive cells (B) in the parent lymphocyte populations. Y axis, −log10(uncorrected p-value), of difference between EOMES high versus EOMES low groups; X axis, log2 fold-change of differences. Dashed horizontal line, p-value = 0.05; dashed vertical line, log(fold-change) = 0. (C) Co-expression of EOMES with TIGIT, KLRG1, or PDCD1 in memory CD8 T cells from EOMES high (bottom row) and EOMES low individuals (top). The frequencies of double high cell populations are shown in the top right quadrant. (D) Longitudinal TIGIT and KLRG1 co-expression in total CD8 T cells from R, NR, and C subjects. Mean ± SEM are shown. Asterisks denote significant differences between R and NR subjects for each visit. Arrows indicate times of initiation of treatment courses. (E) Pie charts of the mean fractions of TIGIT+KLRG1+ cells in each subset at indicated time points.
Due to the high level of expression of TIGIT and KLRG1 proteins and their strong association with EOMES protein, we measured co-expression of TIGIT and KLRG1 proteins on total CD8 T cells in peripheral blood over time (Figure 2D). When analyzed across the entire AbATE study, percentages of TIGIT+KLRG1+ CD8 T cells increased after both treatment courses (Figure 2D), reaching a maximum in R subjects 3–6 months after each course of treatment. Percentages of TIGIT+KLRG1+ CD8 T cells increased to a lesser extent in NR, and remained constant in C. Lastly, we analyzed the composition of TIGIT+KLRG1+ CD8 T cells in R subjects over time, and found no evidence of selective expansion of a specific sub-type of differentiation (Figure 2E). Taken together, these findings demonstrate that percentages of CD8 T cells expressing certain EOMES-associated proteins in peripheral blood increased in R subjects following teplizumab treatment.
CD8 T cells expressing EOMES network genes display a restricted TCR usage
Although CD8 memory cells expressed EOMES, TIGIT and KLRG1 proteins by flow cytometry, the extent to which they expressed the full set of EOMES-associated genes was not known. To better characterize expression of EOMES network genes, we isolated CD45RO+TIGIT+KLRG1+ CD8 T cells (Double high or DH) from R subjects after the first course of treatment at month 6 (N=3) (Figure 3A). For comparison, we isolated CD45RO+TIGIT-KLRG1- CD8 T cells (Double low or DL) from the same subjects. We then performed low input bulk RNA-seq on replicate samples from both populations, and compared expression of the full EOMES-associated gene set. DH cells expressed higher levels of EOMES network genes (Figure 3B). Nearly all the EOMES-associated genes (~95%) were expressed in DH cells, as compared with only ~85% in DL cells. The cumulative distribution plot for EOMES-associated gene expression was shifted significantly to the right in DH cells (p-value = 8.4e-11, Kolmogorov-Smirnov test), indicating that signature genes were expressed at higher levels in DH than DL cells.
Figure 3. TIGIT+KLRG1+ CD8 memory T cells from R subjects expressed expanded TCRs.
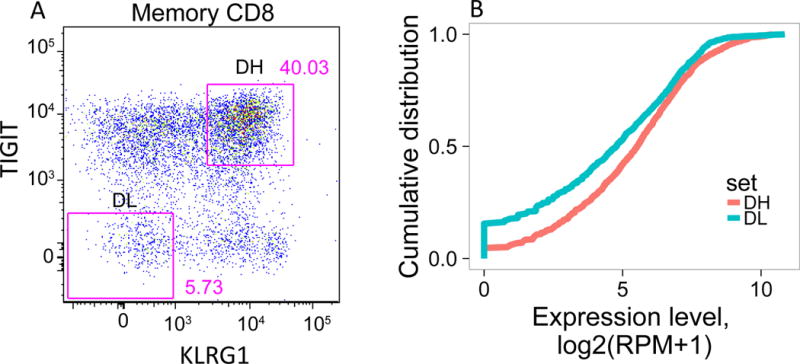
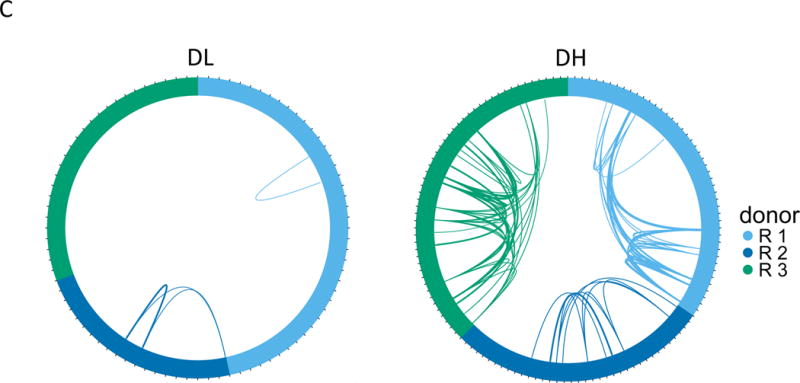
(A) Gating scheme for isolation of TIGIT+KLRG1+ (Double high, DH) and TIGIT-KLRG1- (Double low, DL) populations from CD8 memory (CD8+CD45RO+ of CD3+CD56-) T cells. (B) Cumulative distribution plots for the fraction of EOMES network genes detected (Y axis) versus expression levels (X axis). This plot is representative of the three R subjects tested; the plot comprises 5 replicates for DH cells, and 4 replicates for DL cells from a single individual. (C) Each segment in the plot represents a library (or cell) yielding a TCR junction from DH cells isolated from three R subjects (Table S1, Table S4). Arcs connect cells sharing junctions, with line thickness proportional to the number of junctions shared between cells. Responders 1–3 yielded 56, 44 and 67 unique junctions, respectively, and 4, 5, and 9 expanded junctions (i.e., expressed > 1 cell) for DH cells; and 70, 30, and 49 unique junctions, and 1, 2, and 0 expanded junctions for DL cells.
Characterization of T cell receptor CDR3 sequence variation (clonotype) may be used to provide a measure of T cell diversity and antigen specificity (20). We used single cell RNA-seq to determine specificities (TCR sequences, or clonotypes) and functional capacities (whole transcriptome phenotypes) of individual T cells. From the RNA-seq data, we identified TCR clonotypes in DH and DL cells from three R subjects. Approximately 86% (219/254) good-quality single-cell profiles from individual DH and DL cells yielded rearranged TRAV and/or TRBV genes, demonstrating that they were αβ T cells (Table S4). When sequences of the individual CDR3 junctions were compared (Figure 3C), DH cells from all three subjects showed extensive clonotype sharing compared to DL cells. This finding indicates that DH cells exhibited more in vivo clonal expansion than DL cells (for clonotypes expressed in > 1 cell, p-value = 1e-3, Fisher’s exact test).
It was important to determine whether CD8 T cells expressing EOMES network genes were uniquely autoreactive T cells, or represented a broader phenomenon observed on CD8 T cells including those reactive with environmental foreign antigens. To distinguish these possibilities, we performed a BLAST sequence comparison of CDR3 regions of DH and DL cell TCRs versus the NCBI non-redundant protein database. This comparison revealed CDR3 regions that perfectly matched previously described TCR sequences (13/315, ~4%), including well characterized sequences from studies of viruses (21, 22), MAIT cells, which recognize bacterial products (23–25), and auto- (22, 26) and allo- (27) antigens (Table S4). The diversity of these specificities was consistent with the high frequency of TIGIT+KLRG1+ CD8 T cells, which were found at a much higher level than observed for single antigens. Moreover, these data demonstrate the both DH and DL cells represent a broad-based spectrum of CD8 T cell specificities including both autoimmune and environmental antigens.
CD8 T cells expressing EOMES-associated genes phenotypically and functionally resemble partially exhausted cells
To further characterize CD8 T cells expressing EOMES-associated genes, we compared the proliferative capacities of DH and DL cells sorted from the same 3 R subjects at month 6. If DH cells functionally resemble effector cells, then we would expect an increase in proliferative capacity. By comparison, if DH cells functionally resemble exhausted cells then we would them to be hypo-proliferative. To minimize the amount of rare samples required, we assessed regulation of cell cycle and proliferation genes as a measure of proliferation following stimulation with anti-CD3/anti-CD28 mAbs (polyclonal stimulation), using RNA-seq transcript profiles as the readout. As shown in Figure 4A, mAb stimulation of DH cells triggered a transcriptional response that included genes implicated in in vivo activation of CD8 T cells (28). When compared with DL cells (Figure 4B), DH cells responded to polyclonal stimulation by upregulation of inhibitory receptors, and down regulation of multiple cell cycle genes. Thus, DH cells are less proliferative than DL cells, and respond to stimulation by preferential up-regulation of multiple IRs in addition to TIGIT and KLRG1.
Figure 4. DH cells upregulate multiple inhibitory receptors and down-regulate cell cycle genes during anti-CD3/anti-CD28 stimulation.
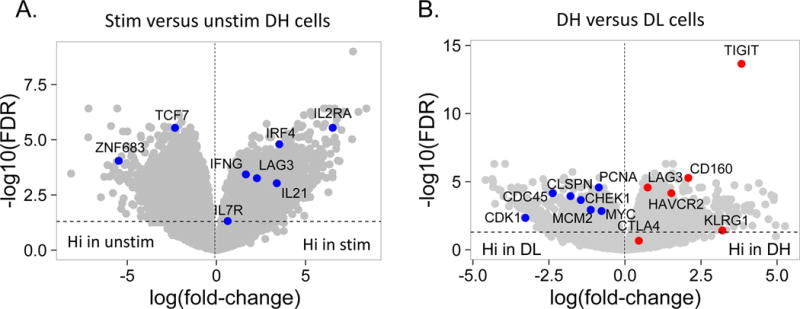

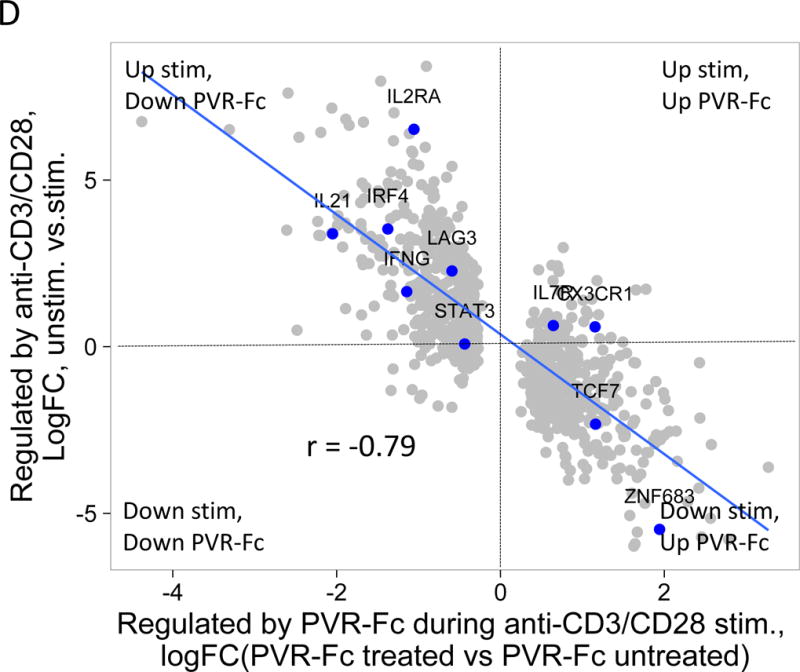
(A) Differential gene expression in anti-CD3/anti-CD28 mAb stimulated versus unstimulated DH cells. Blue dots, selected CD8 T cell genes that correlate with T cell expansion in acute EBV infection (28); grey dots, all other genes Horizontal dashed line, FDR = 0.05; vertical, dashed line, log(fold-change) = 0. (B) Differential gene expression in CD3/anti-CD28 mAb stimulated DH versus DL cells. Red dots, selected inhibitory receptor genes; blue dots, selected cell cycle genes; grey dots, all other genes. (C) Gene expression of selected inhibitory receptors (left panel), effector molecules (center panel) and transcription factors (right panel) in anti-CD3/anti-CD28 stimulated DH and DL cells from three R subjects. Horizontal bars, mean values. Asterisks indicate genes that were detected as differentially expressed by Wilcoxon test (*, p-value <0.05 and ≥0.01; **, p-value <0.01 and ≥0.001; ***, p-value <0.001 and ≥0.0001; ****, p-value <0.0001). (D) Y axis, gene regulation (log(fold-change)) triggered by stimulation of DH cells (Figure 4A); X axis, gene regulation triggered by anti-CD3/anti-CD28 mAbs −/+ soluble PvR-Fc. This projection is restricted to genes regulated significantly under both conditions (FDR<0.05).
Exhausted T cells exhibit characteristic patterns of IR, effector molecule and transcription factor expression (6, 7, 29). To examine these features in more detail, we compared expression of selected molecules from low-input bulk profiles (Figure 4C). In response to stimulation, DH cells expressed significantly higher levels of IR transcripts (TIGIT, KLRG1, CD160, LAG3, and HAVCR2 (TIM3)) than DL cells; levels of PDCD1 did not differ between the two cell types. For effector molecules, stimulated DH cells expressed higher levels of GZMA, GZMH GZMK, and PRF1 than DL cells, but GZMB and IFNG did not differ. For transcription factors, DH cells expressed higher levels of EOMES, MAF and STAT4, but lower levels of E2F1 and STAT1 than DL cells, whereas TBX21 did not differ between the two cell types.
Although DH cells had less proliferative capacity than DL cells, they nonetheless responded to anti-CD3/anti-CD28 stimulation. This suggested that the elevated IR levels seen from DH cells may make them susceptible to down modulation upon encountering inhibitory receptor ligands (IRLs). To test this possibility, we treated DH cells with polyclonal stimulation, with or without PVR-Fc, a soluble IRL for TIGIT. PVR-Fc would be expected to bind the IR TIGIT, as well as costimulatory receptors CD226 and CD96 on T cells (30). When we added PVR-Fc to anti-CD3/28 stimulated cells, we observed regulation of many genes. Genes that were increased by polyclonal stimulation alone were down-regulated by PVR-Fc triggering, as indicated by the negative slope of the comparison for these conditions (Figure 4D). Thus, PVR-Fc triggering down-regulates genes that are up-regulated by anti-CD3/anti-CD28 triggering in unstimulated cells (Figure 4A), consistent with delivery of an inhibitory signal with the potential to provide tolerance.
Discussion
Using a combination of systems immunology and flow cytometry approaches, we have shown that successful therapy with teplizumab is associated with a whole blood gene signature comprising EOMES-associated genes. The gene signature is correlated with C-peptide levels, and is expressed by a subset of CD8 T cells that accumulate in subjects in proportion to their degree of treatment response (R>NR>C); and appears with kinetics mirroring the timing of teplizumab therapy. Our data therefore indicate that this cell subset is closely associated with successful response to teplizumab therapy.
Combined, the whole blood gene signature and flow cytometry results indicate an increase in the percentage of CD8 T cells expressing EOMES signature genes in peripheral blood of responders following teplizumab treatment. This observation is supported by the finding that DH cells show significant TCR sharing (Figure 3C), as would occur during clonal expansion in vivo consistent with perfect sequence matches to TCRs recognizing known foreign and auto-antigens. Support for generation of a novel cell subset as opposed to expansion of a pre-existing cell type comes from the finding that EOMES high cells exhibited elevated levels of inhibitory receptors TIGIT, KLRG1 and CD160 on naive and memory CD8 T cells (Figure 2A & 2B). Also, we did not detect the EOMES signature prior to therapy (Figure 1). Likewise, DH cells expressed an increased proportion and higher expression levels of EOMES-associated genes than DL cells (Figure 3B). The detection of EOMES network genes in both populations, albeit at different levels, suggests complexity in the regulation of these genes in different cell populations, perhaps through differential connectivity of EOMES in different cell types or activation states (8). Together, our data suggest that the CD8 T cells that accumulate in R subjects are both qualitatively and quantitatively different from cells that exist in untreated subjects. Elevations of CD8 cell levels with altered functional responses have been noted in other clinical studies with teplizumab (19, 31). It is presently unknown whether increased frequencies of CD8 T cells accompany C-peptide stabilization in clinical studies with other biologic agents.
Previous reports have identified several CD8 T cell populations whose accumulation might delay decline of beta cell function in T1D, including: CD8 T cells with unique suppressive activity (32, 33); cytotoxic CD8 T cells that could be “CD8 suppressors” by virtue of killing APC (34, 35); CD8 T cells that regulate response to antigens by other mechanisms (36); and a novel CD8 T-NK “hybrid” cell type (37). Another possibility is that successful therapies may induce CD8 T cell exhaustion (6, 9) in T1D. In support of this possibility, we found that EBV reactivation correlates with EOMES transcript levels, as would be expected if exhausted CD8 T cells were not able to control chronic viral infection.
The EOMES-associated gene-expressing CD8 T cells we identified (DH cells) resemble partially exhausted CD8 T cells in important ways. DH cells sorted from R subjects following teplizumab treatment express higher levels of multiple IRs than DL cells, including TIGIT, KLRG1, CD160, LAG3, and TIM3 (Figure 4C). Initially, PDCD1 was proposed as a marker for exhausted T cells (4, 38), but in our studies, PDCD1 levels do not differ between DH and DL cells (Figure 4, C, D). Additional features of DH cells shared with exhausted T cells is that they are hypo-proliferative following TCR ligation, compared to DL cells, and respond to polyclonal activation by greater up-regulation of IRs and lower up-regulation of cell cycle genes (Figure 4B). The fact that DH cells are expanded in responders in vivo, suggests that treatment with teplizumab induces DH cells as opposed to expanding a pre-existing hypo-proliferative population. While expansion of a hypo-proliferative population may seem counter-intuitive, the paradox can be explained if the exhaustion phenotype developed subsequent to expansion.
However, DH cells do not exhibit all commonly accepted features of terminally exhausted cells. Exhausted cells are generally thought to have reduced effector function (4, 6, 9). While the effector activity of DH cells is unknown, they express robust levels of effector molecules, especially after polyclonal activation (granzymes, IFNG, etc., Figure 4C), making it likely that they retain some effector functions. Moreover, DH cells are not fully exhausted, as they are down-modulated by PVR-Fc, a ligand for the inhibitory receptor, TIGIT (Figure 4D). In other systems, there is a requirement for persistent antigen exposure for maintenance of the exhausted phenotype (4). In R subjects, however, the relationship between CD8 T cells expressing EOMES-associated genes and antigen persistence is unclear. Elevated DH cells persisted for many months after treatment, whereas teplizumab is no longer detectable on the surfaces of T cells two weeks after completing a 2 week treatment course (13).
Taken together, the co-expression of multiple IRs, reduced but not ablated proliferative capacity, and ability to be further downregulated by IR triggering suggest that DH cells have a partially exhausted-like phenotype (39). How this is beneficial for T1D subjects remains to be elucidated, in particular how it relates to the status of islet-reactive CD8 T cells in R subjects. Our results show correlation, not necessarily causality, between partial CD8 T cell exhaustion and favorable response to therapy in T1D. However, in light of our results, it is reasonable to speculate that the beneficial effects of teplizumab therapy may result in part from partial or transient exhaustion, and consequently, reduced islet autoreactivity of CD8 effector T cells. The absence of a terminally exhausted phenotype suggests a lack of complete cell commitment and is consistent with the transient nature of the clinical effect of teplizumab. In contrast, since partial exhaustion is also seen in foreign antigen-specific cells and correlates with reactivation of EBV, caution should be taken in using anti-CD3 therapy for an extended period of time.
Immunotherapy trials in cancer have shown that agents reversing effector T cell exhaustion to increase anti-tumor immunity result in striking clinical responses (40). One side-effect of these anti-cancer therapies is autoimmune diabetes (41), consistent with findings that signatures associated with CD8 T cell exhaustion positively correlate with improved prognosis for autoimmunity (10). Therefore, our studies provide primary evidence that pathways clinically important and undesirable for tumor immunology are also potentially important but desirable for response to teplizumab therapy in T1D. Although agents that reverse T cell exhaustion are undergoing intense investigation as anti-tumor agents (40), much less attention has been given to agents that promote and sustain T cell exhaustion as therapies for autoimmune diseases. Our results, together with the proven clinical tractability of this pathway in humans, suggest that enhancing CD8 T cell exhaustion may provide new therapeutic possibilities for T1D and other autoimmune diseases.
Materials and Methods
Study design and samples
The AbATE study involved treatment of new-onset T1D subjects with teplizumab for 2 weeks at diagnosis and after 1 year, in an open-label, randomized, controlled trial The study design was described previously (42) and the complete protocol is available at www.immunetolerance.org. Analysis of EBV reactivation was described previously (42).
Samples were collected at timed visits during the study, and stored frozen until use. For RNA extraction, whole blood samples were collected into Tempus tubes (ThermoFisher Scientific), and RNA was prepared at commercial vendors (Expression Analysis and Fisher). Flow cytometry experiments utilized frozen PBMC isolated from whole blood and viably cryopreserved at the Immune Tolerance Network Core facility. Samples for the present studies were distributed by the Immune Tolerance Network, and are described in Table S1 and at https://www.itntrialshare.org/. Detailed methods can be found in the supplement.
Supplementary Material
Figure S1. Schematic representation of the AbATE trial of teplizumab in newly diagnosed T1D.
Figure S2. Identifying biological themes enriched in top C-peptide genes.
Figure S3. An NK/T cell, EOMES-associated gene signature was detected in whole blood of teplizumab R subjects.
Figure S4. GSEA shows positive correlation between EOMES.mod and other overlapping modules with the R phenotype.
Figure S5. Correlation of EOMES expression with lymphocyte subset levels.
Figure S6: Diagram of flow cytometric single cell analysis of EOMES-associated proteins.
Figure S7: Representative gating for univariate expression analysis by flow cytometry on T and NK subsets.
Figure S8: Representative gating for co-expression longitudinal analysis by flow cytometry.
Table S1. Numbers and characteristics of samples used in this study.
Table S2. EOMES-correlated genes.
Table S3. Flow cytometry panels.
Table S4. TCR rearrangements in DH versus DL cells.
Editor’s summary.
Exhausting Autoimmunity
Checkpoint inhibitors have revolutionized cancer immunotherapy, allowing potentially exhausted tumor-reactive T cells to attack the tumor. However, in the case of autoimmunity, exhausted T cells may be the answer to stopping disease. Long et al. report that that in type 1 diabetics treated with the anti-CD3 monoclonal antibody teplizumab, CD8 T cells with features of exhausted T cells associated with best response to treatment. These cells recognized a broad spectrum of autoantigens and proliferated at a lower level ex vivo; yet, their exhausted phenotype was not terminal as stimulating these cells with a ligand for the inhibitory receptor TIGIT further downregulated their activation. These data suggest inducing T cell exhaustion as a potential therapeutic approach for type 1 diabetes.
Acknowledgments
We acknowledge Deborah Phippard and Tracia Debnam for assistance obtaining samples; members of the BRI Genomics and Human Immunophenotyping core facilities for performing laboratory experiments; Jorge Pardo and Noha Lim for assistance with flow cytometry analysis; Matthew Dufort and Sara Murray for comments on the manuscript; and Anne Hocking for assistance preparing the manuscript.
Funding: This work was funded by NIH grants 1DP3DK104465 and 5UM1AI109565, awarded to PSL and GTN, respectively. The work described in this manuscript was partially funded by and will support the mission of the Immune Tolerance Network, which is to accelerate the clinical development of immune tolerance therapies. Salary support for KCH was provided by grant R01DK057846.
Footnotes
Supplementary Materials:
Note: Due to size, supplementary tables are uploaded as auxiliary supplementary materials.
Author contributions: JT performed laboratory experiments; VG directed the microarray and RNA-seq profiling; JE performed pipeline analysis of the RNAseq data; PSL and HD analyzed the molecular profiling data; SAL, JT and HD analyzed the flow cytometry experiments; KH, ME and JN aided in data interpretation; and PSL and SAL conceived the experiments, and wrote the manuscript. All authors made contributions to the final manuscript.
Competing interests: The authors declare no competing interests.
References and Notes
- 1.Rigby MR, Ehlers MR. Targeted immune interventions for type 1 diabetes: not as easy as it looks! Curr Opin Endocrinol Diabetes Obes. 2014;21:271–278. doi: 10.1097/MED.0000000000000075. [DOI] [PMC free article] [PubMed] [Google Scholar]
- 2.Greenbaum CJ, Schatz DA, Haller MJ, Sanda S. Through the fog: recent clinical trials to preserve β-cell function in type 1 diabetes. Diabetes. 2012;61:1323–1330. doi: 10.2337/db11-1452. [DOI] [PMC free article] [PubMed] [Google Scholar]
- 3.Wållberg M, Cooke A. Immune mechanisms in type 1 diabetes. Trends Immunol. 2013;34:583–591. doi: 10.1016/j.it.2013.08.005. [DOI] [PubMed] [Google Scholar]
- 4.Crespo J, Sun H, Welling TH, Tian Z, Zou W. T cell anergy, exhaustion, senescence, and stemness in the tumor microenvironment. Curr Opin Immunol. 2013;25:214–221. doi: 10.1016/j.coi.2012.12.003. [DOI] [PMC free article] [PubMed] [Google Scholar]
- 5.Schietinger A, Greenberg PD. Tolerance and exhaustion: defining mechanisms of T cell dysfunction. Trends Immunol. 2014;35:51–60. doi: 10.1016/j.it.2013.10.001. [DOI] [PMC free article] [PubMed] [Google Scholar]
- 6.Wherry EJ, Kurachi M. Molecular and cellular insights into T cell exhaustion. Nat Rev Immunol. 2015;15:486–499. doi: 10.1038/nri3862. [DOI] [PMC free article] [PubMed] [Google Scholar]
- 7.Crawford A, Angelosanto JM, Kao C, Doering TA, Odorizzi PM, Barnett BE, Wherry EJ. Molecular and transcriptional basis of CD4+ T cell dysfunction during chronic infection. Immunity. 2014;40:289–302. doi: 10.1016/j.immuni.2014.01.005. [DOI] [PMC free article] [PubMed] [Google Scholar]
- 8.Doering TA, Crawford A, Angelosanto JM, Paley MA, Ziegler CG, Wherry EJ. Network analysis reveals centrally connected genes and pathways involved in CD8+ T cell exhaustion versus memory. Immunity. 2012;37:1130–1144. doi: 10.1016/j.immuni.2012.08.021. [DOI] [PMC free article] [PubMed] [Google Scholar]
- 9.Wherry EJ. T cell exhaustion. Nat Immunol. 2011;12:492–499. doi: 10.1038/ni.2035. [DOI] [PubMed] [Google Scholar]
- 10.McKinney EF, Lee JC, Jayne DRW, Lyons PA, Smith KGC. T-cell exhaustion, co-stimulation and clinical outcome in autoimmunity and infection. Nature. 2015;523:612–616. doi: 10.1038/nature14468. [DOI] [PMC free article] [PubMed] [Google Scholar]
- 11.Cancer Genome Atlas Network. Comprehensive molecular portraits of human breast tumours. Nature. 2012;490:61–70. doi: 10.1038/nature11412. [DOI] [PMC free article] [PubMed] [Google Scholar]
- 12.Reynier F, Pachot A, Paye M, Xu Q, Turrel-Davin F, Petit F, Hot A, Auffray C, Bendelac N, Nicolino M, Mougin B, Thivolet C. Specific gene expression signature associated with development of autoimmune type-I diabetes using whole-blood microarray analysis. Genes Immun. 2010;11:269–278. doi: 10.1038/gene.2009.112. [DOI] [PubMed] [Google Scholar]
- 13.Herold KC, Gitelman SE, Ehlers MR, Gottlieb PA, Greenbaum CJ, Hagopian W, Boyle KD, Keyes-Elstein L, Aggarwal S, Phippard D, Sayre PH, McNamara J, Bluestone JA. the AbATE Study Team, Teplizumab (anti-CD3 mAb) treatment preserves C-peptide responses in patients with new-onset type 1 diabetes in a randomized controlled trial: Metabolic and immunologic features at baseline identify a subgroup of responders. Diabetes. 2013 doi: 10.2337/db13-0345. [DOI] [PMC free article] [PubMed] [Google Scholar]
- 14.Linsley PS, Speake C, Whalen E, Chaussabel D. Copy number loss of the interferon gene cluster in melanomas is linked to reduced T cell infiltrate and poor patient prognosis. PloS One. 2014;9:e109760. doi: 10.1371/journal.pone.0109760. [DOI] [PMC free article] [PubMed] [Google Scholar]
- 15.Novershtern N, Subramanian A, Lawton LN, Mak RH, Haining WN, McConkey ME, Habib N, Yosef N, Chang CY, Shay T, Frampton GM, Drake ACB, Leskov I, Nilsson B, Preffer F, Dombkowski D, Evans JW, Liefeld T, Smutko JS, Chen J, Friedman N, Young RA, Golub TR, Regev A, Ebert BL. Densely interconnected transcriptional circuits control cell states in human hematopoiesis. Cell. 2011;144:296–309. doi: 10.1016/j.cell.2011.01.004. [DOI] [PMC free article] [PubMed] [Google Scholar]
- 16.Subramanian A, Tamayo P, Mootha VK, Mukherjee S, Ebert BL, Gillette MA, Paulovich A, Pomeroy SL, Golub TR, Lander ES, Mesirov JP. Gene set enrichment analysis: a knowledge-based approach for interpreting genome-wide expression profiles. Proc Natl Acad Sci U S A. 2005;102:15545–15550. doi: 10.1073/pnas.0506580102. [DOI] [PMC free article] [PubMed] [Google Scholar]
- 17.Mortazavi A, Williams BA, McCue K, Schaeffer L, Wold B. Mapping and quantifying mammalian transcriptomes by RNA-Seq. Nat Methods. 2008;5:621–628. doi: 10.1038/nmeth.1226. [DOI] [PubMed] [Google Scholar]
- 18.Franceschini A, Szklarczyk D, Frankild S, Kuhn M, Simonovic M, Roth A, Lin J, Minguez P, Bork P, von Mering C, Jensen LJ. STRING v9.1: protein-protein interaction networks, with increased coverage and integration. Nucleic Acids Res. 2013;41:D808–815. doi: 10.1093/nar/gks1094. [DOI] [PMC free article] [PubMed] [Google Scholar]
- 19.Tooley JE, Vudattu N, Choi J, Cotsapas C, Devine L, Raddassi K, Ehlers MR, McNamara JG, Harris KM, Kanaparthi S, Phippard D, Herold KC. Changes in T-cell subsets identify responders to FcR-nonbinding anti-CD3 mAb (teplizumab) in patients with type 1 diabetes. Eur J Immunol. 2016;46:230–241. doi: 10.1002/eji.201545708. [DOI] [PMC free article] [PubMed] [Google Scholar]
- 20.Turner SJ, Doherty PC, McCluskey J, Rossjohn J. Structural determinants of T-cell receptor bias in immunity. Nat Rev Immunol. 2006;6:883–894. doi: 10.1038/nri1977. [DOI] [PubMed] [Google Scholar]
- 21.Stewart-Jones GB, Simpson P, van der Merwe PA, Easterbrook P, McMichael AJ, Rowland-Jones SL, Jones EY, Gillespie GM. Structural features underlying T-cell receptor sensitivity to concealed MHC class I micropolymorphisms. Proc Natl Acad Sci U S A. 2012;109:E3483–3492. doi: 10.1073/pnas.1207896109. [DOI] [PMC free article] [PubMed] [Google Scholar]
- 22.Schneider-Hohendorf T, Mohan H, Bien CG, Breuer J, Becker A, Görlich D, Kuhlmann T, Widman G, Herich S, Elpers C, Melzer N, Dornmair K, Kurlemann G, Wiendl H, Schwab N. CD8(+) T-cell pathogenicity in Rasmussen encephalitis elucidated by large-scale T-cell receptor sequencing. Nat Commun. 2016;7:11153. doi: 10.1038/ncomms11153. [DOI] [PMC free article] [PubMed] [Google Scholar]
- 23.Eckle SBG, Birkinshaw RW, Kostenko L, Corbett AJ, McWilliam HEG, Reantragoon R, Chen Z, Gherardin NA, Beddoe T, Liu L, Patel O, Meehan B, Fairlie DP, Villadangos JA, Godfrey DI, Kjer-Nielsen L, McCluskey J, Rossjohn J. A molecular basis underpinning the T cell receptor heterogeneity of mucosal-associated invariant T cells. J Exp Med. 2014;211:1585–1600. doi: 10.1084/jem.20140484. [DOI] [PMC free article] [PubMed] [Google Scholar]
- 24.Porcelli S, Yockey CE, Brenner MB, Balk SP. Analysis of T cell antigen receptor (TCR) expression by human peripheral blood CD4-8- alpha/beta T cells demonstrates preferential use of several V beta genes and an invariant TCR alpha chain. J Exp Med. 1993;178:1–16. doi: 10.1084/jem.178.1.1. [DOI] [PMC free article] [PubMed] [Google Scholar]
- 25.Gherardin NA, Keller AN, Woolley RE, Le Nours J, Ritchie DS, Neeson PJ, Birkinshaw RW, Eckle SBG, Waddington JN, Liu L, Fairlie DP, Uldrich AP, Pellicci DG, McCluskey J, Godfrey DI, Rossjohn J. Diversity of T Cells Restricted by the MHC Class I-Related Molecule MR1 Facilitates Differential Antigen Recognition. Immunity. 2016;44:32–45. doi: 10.1016/j.immuni.2015.12.005. [DOI] [PubMed] [Google Scholar]
- 26.Joachims ML, Leehan KM, Lawrence C, Pelikan RC, Moore JS, Pan Z, Rasmussen A, Radfar L, Lewis DM, Grundahl KM, Kelly JA, Wiley GB, Shugay M, Chudakov DM, Lessard CJ, Stone DU, Scofield RH, Montgomery CG, Sivils KL, Thompson LF, Farris AD. Single-cell analysis of glandular T cell receptors in Sjögren’s syndrome. JCI Insight. 2016;1 doi: 10.1172/jci.insight.85609. [DOI] [PMC free article] [PubMed] [Google Scholar]
- 27.Du JW, Gu JY, Liu J, Cen XN, Zhang Y, Ou Y, Chu B, Zhu P. TCR spectratyping revealed T lymphocytes associated with graft-versus-host disease after allogeneic hematopoietic stem cell transplantation. Leuk Lymphoma. 2007;48:1618–1627. doi: 10.1080/10428190701474357. [DOI] [PubMed] [Google Scholar]
- 28.Greenough TC, Straubhaar JR, Kamga L, Weiss ER, Brody RM, McManus MM, Lambrecht LK, Somasundaran M, Luzuriaga KF. A Gene Expression Signature That Correlates with CD8+ T Cell Expansion in Acute EBV Infection. J Immunol Baltim Md 1950. 2015;195:4185–4197. doi: 10.4049/jimmunol.1401513. [DOI] [PMC free article] [PubMed] [Google Scholar]
- 29.Doering TA, Crawford A, Angelosanto JM, Paley MA, Ziegler CG, Wherry EJ. Network analysis reveals centrally connected genes and pathways involved in CD8+ T cell exhaustion versus memory. Immunity. 2012;37:1130–1144. doi: 10.1016/j.immuni.2012.08.021. [DOI] [PMC free article] [PubMed] [Google Scholar]
- 30.Fuertes Marraco SA, Neubert NJ, Verdeil G, Speiser DE. Inhibitory Receptors Beyond T Cell Exhaustion. Front Immunol. 2015;6 doi: 10.3389/fimmu.2015.00310. [DOI] [PMC free article] [PubMed] [Google Scholar]
- 31.Ablamunits V, Herold KC. Generation and function of human regulatory CD8+ T cells induced by a humanized OKT3 monoclonal antibody hOKT3gamma1 (Ala-Ala) Hum Immunol. 2008;69:732–736. doi: 10.1016/j.humimm.2008.08.290. [DOI] [PubMed] [Google Scholar]
- 32.Kim HJ, Wang X, Radfar S, Sproule TJ, Roopenian DC, Cantor H. CD8+ T regulatory cells express the Ly49 Class I MHC receptor and are defective in autoimmune prone B6-Yaa mice. Proc Natl Acad Sci U S A. 2011;108:2010–2015. doi: 10.1073/pnas.1018974108. [DOI] [PMC free article] [PubMed] [Google Scholar]
- 33.Jiang H, Canfield SM, Gallagher MP, Jiang HH, Jiang Y, Zheng Z, Chess L. HLA-E-restricted regulatory CD8(+) T cells are involved in development and control of human autoimmune type 1 diabetes. J Clin Invest. 2010;120:3641–3650. doi: 10.1172/JCI43522. [DOI] [PMC free article] [PubMed] [Google Scholar]
- 34.Guarda G, Hons M, Soriano SF, Huang AY, Polley R, Martín-Fontecha A, Stein JV, Germain RN, Lanzavecchia A, Sallusto F. L-selectin-negative CCR7- effector and memory CD8+ T cells enter reactive lymph nodes and kill dendritic cells. Nat Immunol. 2007;8:743–752. doi: 10.1038/ni1469. [DOI] [PubMed] [Google Scholar]
- 35.Laffont S, Coudert JD, Garidou L, Delpy L, Wiedemann A, Demur C, Coureau C, Guéry J-C. CD8+ T-cell-mediated killing of donor dendritic cells prevents alloreactive T helper type-2 responses in vivo. Blood. 2006;108:2257–2264. doi: 10.1182/blood-2005-10-4059. [DOI] [PubMed] [Google Scholar]
- 36.Bisikirska B, Colgan J, Luban J, Bluestone JA, Herold KC. TCR stimulation with modified anti-CD3 mAb expands CD8+ T cell population and induces CD8+CD25+ Tregs. J Clin Invest. 2005;115:2904–2913. doi: 10.1172/JCI23961. [DOI] [PMC free article] [PubMed] [Google Scholar]
- 37.Yuling H, Ruijing X, Xiang J, Li L, Lang C, Jie X, Wei X, Yujuan W, Lijun Z, Rui Z, Xinti T, Yongyi B, Yan-Ping J, Youxin J, Jinquan T. EBV Promotes Human CD8+ NKT Cell Development. PLoS Pathog. 2010;6 doi: 10.1371/journal.ppat.1000915. [DOI] [PMC free article] [PubMed] [Google Scholar]
- 38.Barber DL, Wherry EJ, Masopust D, Zhu B, Allison JP, Sharpe AH, Freeman GJ, Ahmed R. Restoring function in exhausted CD8 T cells during chronic viral infection. Nature. 2006;439:682–687. doi: 10.1038/nature04444. [DOI] [PubMed] [Google Scholar]
- 39.Wherry EJ, Ha SJ, Kaech SM, Haining WN, Sarkar S, Kalia V, Subramaniam S, Blattman JN, Barber DL, Ahmed R. Molecular signature of CD8+ T cell exhaustion during chronic viral infection. Immunity. 2007;27:670–684. doi: 10.1016/j.immuni.2007.09.006. [DOI] [PubMed] [Google Scholar]
- 40.Chen DS, Mellman I. Oncology meets immunology: the cancer-immunity cycle. Immunity. 2013;39:1–10. doi: 10.1016/j.immuni.2013.07.012. [DOI] [PubMed] [Google Scholar]
- 41.Hughes J, Vudattu N, Sznol M, Gettinger S, Kluger H, Lupsa B, Herold KC. Precipitation of autoimmune diabetes with anti-PD-1 immunotherapy. Diabetes Care. 2015;38:e55–57. doi: 10.2337/dc14-2349. [DOI] [PMC free article] [PubMed] [Google Scholar]
- 42.Ritchie ME, Phipson B, Wu D, Hu Y, Law CW, Shi W, Smyth GK. limma powers differential expression analyses for RNA-sequencing and microarray studies. Nucleic Acids Res. 2015;43:e47. doi: 10.1093/nar/gkv007. [DOI] [PMC free article] [PubMed] [Google Scholar]
- 43.Du P, Kibbe WA, Lin SM. lumi: a pipeline for processing Illumina microarray. Bioinforma Oxf Engl. 2008;24:1547–1548. doi: 10.1093/bioinformatics/btn224. [DOI] [PubMed] [Google Scholar]
- 44.Du P, Kibbe WA, Lin SM. nuID: a universal naming scheme of oligonucleotides for illumina, affymetrix, and other microarrays. Biol Direct. 2007;2:16. doi: 10.1186/1745-6150-2-16. [DOI] [PMC free article] [PubMed] [Google Scholar]
- 45.Langfelder P, Horvath S. WGCNA: an R package for weighted correlation network analysis. BMC Bioinformatics. 2008;9:559. doi: 10.1186/1471-2105-9-559. [DOI] [PMC free article] [PubMed] [Google Scholar]
- 46.Wu AR, Neff NF, Kalisky T, Dalerba P, Treutlein B, Rothenberg ME, Mburu FM, Mantalas GL, Sim S, Clarke MF, Quake SR. Quantitative assessment of single-cell RNA-sequencing methods. Nat Methods. 2014;11:41–46. doi: 10.1038/nmeth.2694. [DOI] [PMC free article] [PubMed] [Google Scholar]
- 47.Giardine B, Riemer C, Hardison RC, Burhans R, Elnitski L, Shah P, Zhang Y, Blankenberg D, Albert I, Taylor J, Miller W, Kent WJ, Nekrutenko A. Galaxy: a platform for interactive large-scale genome analysis. Genome Res. 2005;15:1451–1455. doi: 10.1101/gr.4086505. [DOI] [PMC free article] [PubMed] [Google Scholar]
- 48.Afgan E, Baker D, van den Beek M, Blankenberg D, Bouvier D, Čech M, Chilton J, Clements D, Coraor N, Eberhard C, Grüning B, Guerler A, Hillman-Jackson J, Kuster G Von, Rasche E, Soranzo N, Turaga N, Taylor J, Nekrutenko A, Goecks J. The Galaxy platform for accessible, reproducible and collaborative biomedical analyses: 2016 update. Nucleic Acids Res. 2016 doi: 10.1093/nar/gkw343. [DOI] [PMC free article] [PubMed] [Google Scholar]
- 49.Trapnell C, Pachter L, Salzberg SL. TopHat: discovering splice junctions with RNA-Seq. Bioinforma Oxf Engl. 2009;25:1105–1111. doi: 10.1093/bioinformatics/btp120. [DOI] [PMC free article] [PubMed] [Google Scholar]
- 50.Anders S, Pyl PT, Huber W. HTSeq–a Python framework to work with high-throughput sequencing data. Bioinforma Oxf Engl. 2015;31:166–169. doi: 10.1093/bioinformatics/btu638. [DOI] [PMC free article] [PubMed] [Google Scholar]
- 51.Robinson MD, Oshlack A. A scaling normalization method for differential expression analysis of RNA-seq data. Genome Biol. 2010;11:R25. doi: 10.1186/gb-2010-11-3-r25. [DOI] [PMC free article] [PubMed] [Google Scholar]
- 52.Robinson MD, McCarthy DJ, Smyth GK. edgeR: a Bioconductor package for differential expression analysis of digital gene expression data. Bioinforma Oxf Engl. 2010;26:139–140. doi: 10.1093/bioinformatics/btp616. [DOI] [PMC free article] [PubMed] [Google Scholar]
- 53.Law CW, Chen Y, Shi W, Smyth GK. voom: Precision weights unlock linear model analysis tools for RNA-seq read counts. Genome Biol. 2014;15:R29. doi: 10.1186/gb-2014-15-2-r29. [DOI] [PMC free article] [PubMed] [Google Scholar]
- 54.Grabherr MG, Haas BJ, Yassour M, Levin JZ, Thompson DA, Amit I, Adiconis X, Fan L, Raychowdhury R, Zeng Q, Chen Z, Mauceli E, Hacohen N, Gnirke A, Rhind N, di Palma F, Birren BW, Nusbaum C, Lindblad-Toh K, Friedman N, Regev A. Full-length transcriptome assembly from RNA-Seq data without a reference genome. Nat Biotechnol. 2011;29:644–652. doi: 10.1038/nbt.1883. [DOI] [PMC free article] [PubMed] [Google Scholar]
- 55.Brochet X, Lefranc MP, Giudicelli V. IMGT/V-QUEST: the highly customized and integrated system for IG and TR standardized V-J and V-D-J sequence analysis. Nucleic Acids Res. 2008;36:W503–508. doi: 10.1093/nar/gkn316. [DOI] [PMC free article] [PubMed] [Google Scholar]
- 56.Shannon P, Markiel A, Ozier O, Baliga NS, Wang JT, Ramage D, Amin N, Schwikowski B, Ideker T. Cytoscape: a software environment for integrated models of biomolecular interaction networks. Genome Res. 2003;13:2498–2504. doi: 10.1101/gr.1239303. [DOI] [PMC free article] [PubMed] [Google Scholar]
Associated Data
This section collects any data citations, data availability statements, or supplementary materials included in this article.
Supplementary Materials
Figure S1. Schematic representation of the AbATE trial of teplizumab in newly diagnosed T1D.
Figure S2. Identifying biological themes enriched in top C-peptide genes.
Figure S3. An NK/T cell, EOMES-associated gene signature was detected in whole blood of teplizumab R subjects.
Figure S4. GSEA shows positive correlation between EOMES.mod and other overlapping modules with the R phenotype.
Figure S5. Correlation of EOMES expression with lymphocyte subset levels.
Figure S6: Diagram of flow cytometric single cell analysis of EOMES-associated proteins.
Figure S7: Representative gating for univariate expression analysis by flow cytometry on T and NK subsets.
Figure S8: Representative gating for co-expression longitudinal analysis by flow cytometry.
Table S1. Numbers and characteristics of samples used in this study.
Table S2. EOMES-correlated genes.
Table S3. Flow cytometry panels.
Table S4. TCR rearrangements in DH versus DL cells.


