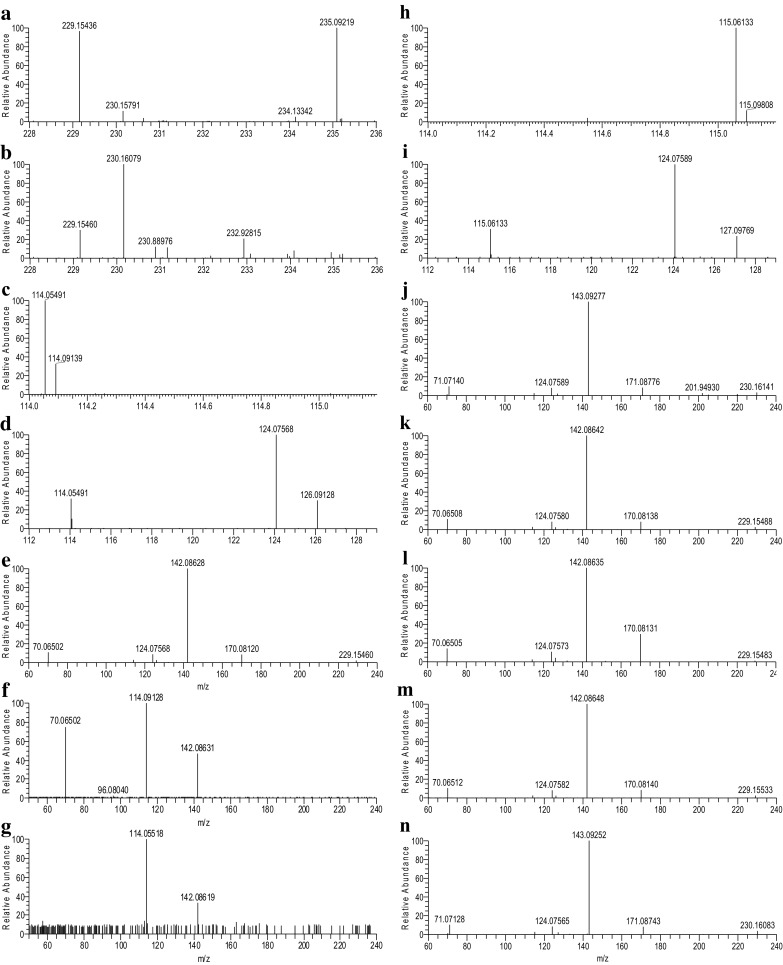
Fig. 2.

Expanded MS spectra of x17299 (a) and deuterated x17299 (b), MS2 spectra of x17299 (e) and deuterated x17299 (j) with corresponding expansions (c, d, h, i), MS3 spectra of m/z 229/142 (f) and 229/170 (g) of x17299 in a plasma extract, and MS2 spectra of synthetic l,l-TMAP (k), d,l-TMAP (l), d,d-TMAP (m), and deuterated l,l-TMAP (n)
