Abstract
Purpose
To develop and measure the reproducibility of 4-min whole brain myelin water fraction (MWF) mapping using fast acquisition with spiral trajectory and T2prep (FAST-T2) sequence at 3T.
Methods
Experiments were performed on phantoms, 13 volunteers, and 16 patients with multiple sclerosis. MWF maps were extracted using a spatially constrained non-linear algorithm. The proposed adiabatic modified BIR-4 (mBIR-4) T2prep was compared with the conventional composite T2prep (COMP). The effect of reducing the number of echo times (TEs) from 15 to 6 (reducing scan time from 10 to 4 min) was evaluated. Reproducibility was assessed using correlation analysis, coefficient of variation (COV), and Bland–Altman plots.
Results
Compared with COMP, mBIR-4 provided more accurate T2 in phantoms and better MWF maps in human brains. Reducing the number of TEs had a negligible effect on MWF map quality, with a regional MWF difference of <0.8%. Regional MWFs obtained by repeated scans showed excellent correlation (R = 0.99), low COV (1.3%–2.4%), and negligible bias within ±1% limits of agreement. On a voxel-wise basis, the agreement remained strong (correlation R = 0.89 ± 0.03, bias = 0.01% ± 0.29%, limits of agreement = [−3.35% ± 0.73%, 3.33% ± 0.61%]).
Conclusion
Whole brain MWF mapping with adiabatic FAST-T2 is feasible in 4 min and provides good intrasite reproducibility.
Keywords: T2 relaxometry, BIR-4, myelin water fraction, spiral sampling, 3T
INTRODUCTION
Multiple sclerosis (MS) is an incurable demyelinating disease of the central nervous system and is a leading cause of disability in young adults. MS lesions are characterized by injury to the myelin sheath supporting the axon, which can lead to progressive axonal loss and neuronal degeneration in a complex process lasting many decades (1,2). Currently, there is a great clinical need for a robust in vivo quantitative imaging biomarker of myelin content to monitor disease progression and to facilitate the translation of novel treatment strategies for MS that promote myelin repair (3). Multicomponent T2 relaxometry is a promising MRI method that can distinguish the myelin water component from other tissue water components based on the difference in T2 relaxation time (~10 ms for myelin water and 50–80 ms for intra/extracellular water), thereby providing a noninvasive approach for indirectly mapping myelin content (4–6). Myelin water fraction (MWF), defined as the ratio of the myelin water signal to the total water signal within a voxel, has been shown to correlate highly with the myelin loss and regeneration measured by histopathology in ex vivo human brains (7), as well as in animal models of MS (8,9), and can be useful clinically (10–12).
A major barrier to a successful translation of brain MWF mapping into routine clinical use has been long acquisition time, partly due to the high signal-to-noise ratio (SNR) demand of multiexponential data analysis (13,14) and partly due to the low data sampling speed of conventional pulse sequences. To overcome this challenge, advanced pulse sequence designs with higher SNR efficiency have been introduced to drastically reduce the traditional acquisition of approximately 25 min per brain slice by the classic two-dimensional (2D) Carr–Purcell–Meiboom–Gill (CPMG) multiecho spin echo (MESE) sequence (15,16) to achieve whole brain coverage in the same time or less (17–19). In particular, Fast acquisition with spiral trajectory and T2prep (FAST-T2) is an SNR-efficient and flexible sequence capable of reducing the scan time further by using the SNR benefit of higher static field strengths such as 3T and reducing the number of collected echo times (TEs) (18). However, the increased B0 and B1 field inhomogeneity at 3T may seriously degrade the T2 weighting accuracy of the conventional T2prep, potentially leading to unreliable MWF quantification (20).
This study had three major goals: 1) develop a robust adiabatic T2prep design for FAST-T2 based MWF mapping at 3T, 2) achieve whole brain MWF mapping in 4 min by means of efficient geometric TE sampling and the use of a robust spatially constrained nonlinear data fitting algorithm, and 3) demonstrate the high intrasite reproducibility of the developed brain MWF mapping technique in healthy volunteers.
METHODS
Adiabatic T2prep
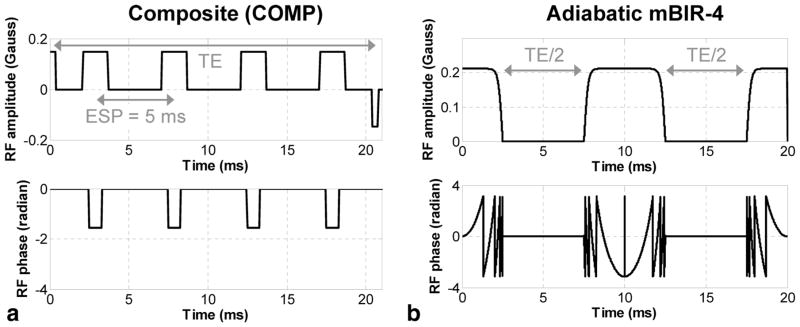
The increased B0 and B1 field inhomogeneities at 3T can cause inaccurate T2 weighting of the image data and lead to significant MWF estimation errors (20). In the FAST-T2 sequence, T2 weighting is performed by a spatially nonselective T2prep module played out immediately before the spiral data acquisition (18). In the conventional T2prep design (18,21), the longitudinal magnetization is first tipped into the transverse plane by a 90x radiofrequency (RF) pulse, where it is refocused by a series of refocusing RF pulses (with a fixed interpulse interval of 5–10 ms) to form spin echoes while undergoing T2 relaxation, then returned to the longitudinal axis by a 90−x tip-up RF pulse for subsequent data sampling (Fig. 1a). This design requires accurate refocusing flip angles to prevent T1 contamination from stimulated echoes, which is generally difficult to achieve in the whole brain at higher B0 fields, even when more robust composite 90x180y90x refocusing pulses (22) are used (COMP design, Fig. 1a).
FIG. 1.
Examples of (a) COMP T2prep and (b) the proposed adiabatic tan/tanh mBIR-4 T2prep for MWF mapping of the brain at 3T. In the COMP design, multiple 90x180y90x composite pulses were used to refocus the transverse magnetization at fixed regular intervals (echo spacing (ESP) = 5 ms in this example) to produce spin echoes that underwent T2 relaxation. The proposed mBIR-4 design consisted of three frequency-modulated adiabatic RF pulses with larger amplitudes and longer duration to achieve more robust T2 weighting in the presence of increased field inhomogeneities at 3T.
In this study, we used an adiabatic T2prep design based on a 0° modified BIR-4 pulse (23). This symmetric pulse consisted of a reverse half passage, a full passage, and a half passage adiabatic pulse separated by two equal time delays of length TE/2 (mBIR-4 design, Fig. 1b). Unlike conventional amplitude-modulated RF pulses (such as those used in the COMP design), both the amplitude and phase of adiabatic pulses are modulated under the adiabatic principle (23), which can greatly improve robustness against B0 and B1 field inhomogeneities (24). In the mBIR-4 design, the T2 weighting of the magnetization can be controlled by varying the interpulse time delay TE/2. Because of its longer duration (5–10 ms), the pulse itself introduces a nonnegligible T2 weighting effect on the magnetization, which depends on the pulse length, shape, and maximum modulation frequency and can be modeled as a fixed ΔTE shift independent of T2 (25). Note that T1 relaxation effect can be ignored because brain tissue T1 is several orders of magnitude larger than the typical adiabatic pulse length, while other potential confounding effects such as chemical exchange were not considered in this study. Additionally, imperfect hardware implementation of the pulse may lead to a flip angle error, causing a signal loss of approximately 1–2%, which also does not depend on T2 (26,27). The overall T2 weighting effect of mBIR-4 pulse therefore can be expressed as follows:
| [1] |
In this study, ΔTE was determined by performing a Bloch simulation for a given mBIR-4 pulse shape (25), while the scaling factor β characterizing the scanner-dependent signal loss was calibrated experimentally using water phantoms.
Geometric TE Sampling
The conventional MESE pulse sequence can only sample TE in fixed intervals determined by the echo spacing with typically 32 TEs acquired at 10–320 ms (16). In addition to higher SNR efficiency, the FAST-T2 sequence provides more flexible TE sampling, which can shorten scan times by reducing the number of acquired TEs (18). Another unique advantage of FAST-T2 is the possibility of acquiring image data at a very short TE by not playing out T2prep (the effective TE is limited only by the TE of the spiral readout [~0.5 ms]), which greatly improves sensitivity to the fast decaying myelin water component (T2 ~10 ms). Mathematical analysis of the inverse Laplace transform underlying multiexponential analysis has indicated that five geometrically spaced TEs can be more effective in reducing noise amplification than 32 equidistant TEs (28). Here, we proposed to acquire only six TEs (one TE ~0 by turning T2prep off, plus five TEs spaced approximately geometrically between 7.6 ms and 307.6 ms) to reduce the whole brain MWF mapping time to only 4 min. The effectiveness of the proposed six TE sampling was assessed by comparing with the previously implemented scheme using 15 TEs (29) as a reference standard.
Spatially Constrained Nonlinear Fitting
Our prior investigation indicated that a three-pool nonlinear least squares data fitting algorithm (30) provided similar MWF maps compared with those obtained with the more commonly used nonnegative linear least squares algorithm at 2.8 times faster speed (31). To further reduce the noise effect associated with voxel-wise fitting at lower SNR and reduced number of TEs in this study, a previously proposed spatially local smoothness constraint (32) was incorporated in the three-pool nonlinear fitting by jointly solving the following minimization problem over all brain voxels at once:
| [2] |
where x is a vector of unknown pool fractions and pool T2 values (a total of six unknowns per voxel), y is a vector of T2 decay signals, ∇S is a 2D discrete Laplacian operator (32), and f denotes a triexponential function. The regularization parameter λ was determined by calculating MWF maps for different λ values in a healthy subject and selecting the one that provided an MWF map with the best visual quality. This optimized value was then fixed for all of the subjects enrolled in this study.
Numerical Experiments
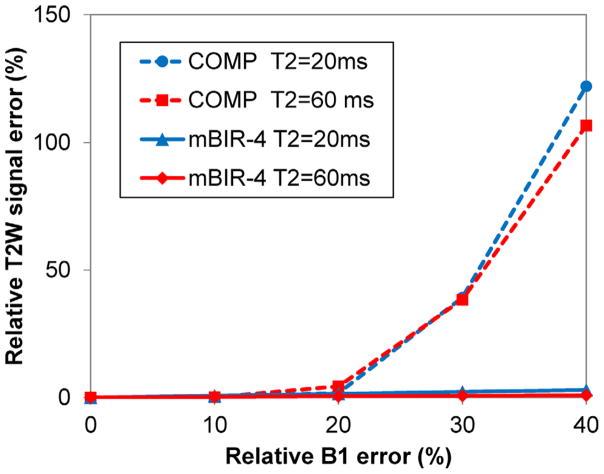
Bloch simulations were performed in MATLAB version R2011b (MathWorks, Natick, Massachusetts, USA) to calculate the ΔTE shift associated with the implemented mBIR-4 pulse (tan/tanh modulation, 0.21 Gauss nominal amplitude, 9 kHz maximum frequency offset, 10 ms without interpulse delay) and to compare its T2 weighting accuracy with that of the COMP pulse (0.14 Gauss nominal amplitude) for T2 = 20 ms and 60 ms assuming a nominal TE of 20 ms (Fig. 1). The relative B1 amplitude reduction was varied from 0% to 40% with a 10% step. On-resonance condition was assumed and T1 was set to 1000 ms. The relative T2 weighted signal error (ε) in the presence of reduced B1 amplitude was defined as follows:
| [3] |
where MZ is the longitudinal magnetization calculated at the end of the T2prep.
Phantom Experiments
All imaging experiments were performed at 3T (GE HDxt 16.0, GE Healthcare, Waukesha, Wisconsin, USA). The volume body coil was used for excitation, and an eight-channel receive brain coil was used for signal reception. T2 mapping accuracy obtained with COMP and mBIR-4 designs was compared on four water phantoms doped with 1.0, 0.4, 0.2, and 0.1 mM manganese chloride (MnCl2). The FAST-T2 phantom imaging parameters were as follows: axial field of view = 24 cm; matrix size = 192 × 192 (interpolated to 256 × 256); slice thickness = 5 mm; number of slices = 32; spiral TR = 7.8 ms; spiral TE = 0.5 ms; number of spiral leaves per stack = 32; flip angle = 10°; readout bandwidth = ±125 kHz; sequence TR (time between consecutive T2preps) = 2500 ms; nominal TEs = 0 ms (T2prep turned off), 10, 20, 40, 80, 160, 320 ms (COMP), and 0, 7.6, 17.6, 37.6, 77.6, 157.6, 317.6 ms (mBIR-4, after ΔTE correction as determined by Bloch simulation). The relative B1 amplitude reduction of the T2prep was varied from 0% to 20% with a 10% step. This was achieved by manually setting the amplitudes of the RF pulse stored in the scanner’s waveform memory before the scan. Reference T2 values were obtained with a 2D CPMG MESE sequence.
Human Experiments
Human experiments were conducted on a total of 13 healthy volunteers (12 men, 1 woman; mean age, 33 ± 12 y [standard deviation (SD)]) and 16 MS patients (6 men, 10 women; 13 relapsing-remitting, 1 secondary progressive, 1 clinically isolated syndrome, 1 tumefactive MS; mean age, 41 ± 11 y [SD]; mean disease duration, 8 ± 6 y [SD]). The volunteer study was approved by our Institutional Review Board, and informed consent was obtained from all subjects prior to imaging. Seven volunteers were imaged with both COMP and mBIR-4 T2preps in randomized order to compare their performance. In addition, 11 volunteers were imaged twice with mBIR-4 in separate scanning sessions (subjects exiting the scanner and repositioned between sessions) to measure the intrasite reproducibility of FAST-T2–based MWF mapping. MS patients were imaged with mBIR-4 only as part of a routine brain MRI protocol to test the feasibility of the proposed technique in a clinical setting. The human imaging parameters were the same as those used in the phantom experiments, except that 15 TEs (0, 7.6, 17.6, 27.6, 37.6, 47.6, 67.6, 87.6, 107.6, 127.6, 147.6, 187.6, 227.6, 267.6, 307.6 ms) were used. The whole brain acquisition time of the MWF mapping sequence was 10 min. From this set of TEs, a smaller subset was selected to yield six TEs with approximately geometric spacing (0, 7.6, 17.6, 67.6, 147.6, 307.6 ms, corresponding to 4-min scan time), which were then processed for comparison. Anatomical images (T1-weighted [T1W] and fluid attenuation inversion recovery T2 weighted [FLAIR T2W]) with approximately 1 mm3 isotropic resolution were also acquired.
Image Analysis
All MWF processing was performed in MATLAB using a Dell desktop computer (Intel Core i7 processor, 18 GB RAM, 64-bit Windows 7). For phantom data, T2 weighted signals were averaged over a 7 × 7 region of interest (ROI) placed within each phantom to reduce noise prior to data fitting. For data acquired with COMP FAST-T2 sequence and reference CPMG MESE sequence, T2 values were obtained by performing a nonlinear three-parameter monoexponential fitting using the Levenberg-Marquardt algorithm. For data acquired with mBIR-4 FAST-T2, a fourth fitting parameter was added to estimate the platform-dependent signal scaling factor β due to the imperfect hardware implementation of the adiabatic pulse (Eq. [1]). The scaling factor β averaged over the four phantoms and the ΔTE shift estimated by the Bloch simulation (Eq. [1]) were then used in subsequent human data analysis.
Human brain images obtained with FAST-T2 were analyzed after the removal of skull signal using the Brain Extraction Tool algorithm (33). A multivoxel nonlinear three-pool data fitting algorithm with spatial smoothness constraints (Eq. [2]) was used to compute whole brain MWF maps for data acquired with 15 TEs (10-min scan time) and six TEs (4-min scan time). The lower and upper T2 bounds for each of the three water pools (in milliseconds) were set to [5 20], [20 200], and [200 2000], respectively (the first pool corresponds to myelin water). A maximum cutoff of 20 ms was chosen experimentally for the myelin water pool to separate myelin water (detected T2 ~10 ms) from venous blood (T2 ~25–35 ms). A limited-memory Broyden–Fletcher–Goldfarb–Shanno algorithm was used to obtain the constrained solution to Equation [2]. The number of iterations was set to 100. MWF maps obtained in two different scanning sessions for the reproducibility study were coregistered using the FMRIB’s Linear Image Registration Tool algorithm (34). MWF maps and FLAIR T2W images obtained in patients were coregistered with T1W images to facilitate the tracing of MS lesions. For each healthy subject, ROI analysis was used to obtain mean MWF values for five major white matter (WM) structures (genu and splenium of corpus callosum, minor forceps, major forceps, and posterior limbs of the internal capsule) and three major gray matter (GM) structures (putamen, caudate head, and thalamus) using ImageJ software (National Institutes of Health, Bethesda, Maryland, USA). The same analysis was performed for patients with the addition of a lesion ROI selected as the largest MS lesion.
Statistical Analysis
Two-tailed paired sample t tests were used to assess the difference in regional MWF obtained with 15 and six TEs. The reproducibility of MWF mapping using FAST-T2 was assessed using Bland–Altman plots as well as regression and correlation analysis applied to both voxel-wise and regional MWF measurements (for voxel-wise measurements, an MWF cutoff of 20% was used to exclude non–brain tissues such as major blood vessels, which tend to have high MWF values). In addition, coefficient of variation (COV) analysis was calculated for regional WM measurements. A Bland–Altman plot revealed the agreement in absolute terms between repeated measurements by plotting their difference against their mean. Regression and correlation analysis provides measures of the linear relationship between the repeated measurements in the form of linear regression equation and Pearson correlation coefficient. COV measures the dispersion of data around the mean and was calculated for each WM ROI as the SD of the mean MWFs measured in the ROI divided by their mean over the two scans and multiplied by (1 + 1/(4*n)) where n is the number of data points used to calculate COV (1.13 in this case where n = 2) (35). P values of less than 0.05 were considered statistically significant. All values are expressed as the mean ± SD.
RESULTS
Numerical Bloch simulation revealed that the ΔTE shift induced by the implemented mBIR-4 pulse was 7.6 ms. The average signal scaling factor β introduced by this pulse (Eq. [1]) was estimated on the four water phantoms (reference T2 = 8.4, 21.6, 45.6, and 82.6 ms) to be 0.98 ± 0.01. Bloch simulation results predicted that the COMP design only provided accurate T2 weighting (ε < 3%) for RF amplitude error within 15%, whereas the adiabatic mBIR-4 design was robust up to 60% RF amplitude error (Fig. 2). Phantom experiments (Table 1) confirmed these predictions, showing significantly increased T2 errors for COMP at −20% B1 error, especially for larger T2 values (27% and 43% errors for phantom T2 of 45.6 and 82.6 ms, respectively). On the contrary, mBIR-4 yielded consistently accurate T2 estimates (T2 errors within 1.1 ms for T2 of 8.4 and 21.6 ms and within 3% for T2 of 45.6 and 82.6 ms).
FIG. 2.
Relative T2W signal error (Eq. [3]) as a function of relative transmit B1 error calculated using numerical Bloch simulation for the COMP and mBIR-4 T2prep shown in Figure 1 and T2 of 20 ms and 60 ms (mimicking T2 values of myelin water and intra/extracellular water compartments).
Table 1.
Comparison of T2 Values (in ms) Obtained for Water Phantoms Doped with MnCl2 Using the Reference 2D MESE Method and 3D FAST-T2 with COMP and mBIR-4 T2prep at Nominal and Reduced RF Amplitudes
| MnCl2 Concentration | Reference (MESE) | mBIR-4 | COMP | ||||
|---|---|---|---|---|---|---|---|
|
|
|
||||||
| Nominal | −10% | −20% | Nominal | −10% | −20% | ||
| 1 mM | 8.4 | 9.5 | 9.4 | 9.3 | 8.9 | 9.4 | 9.8 |
| 0.4 mM | 21.6 | 22.4 | 22.2 | 22.0 | 22.3 | 22.3 | 20.3 |
| 0.2 mM | 45.6 | 45.2 | 44.9 | 44.4 | 46.5 | 44.0 | 34.0 |
| 0.1 mM | 82.6 | 81.2 | 80.9 | 80.3 | 83.9 | 72.2 | 47.9 |
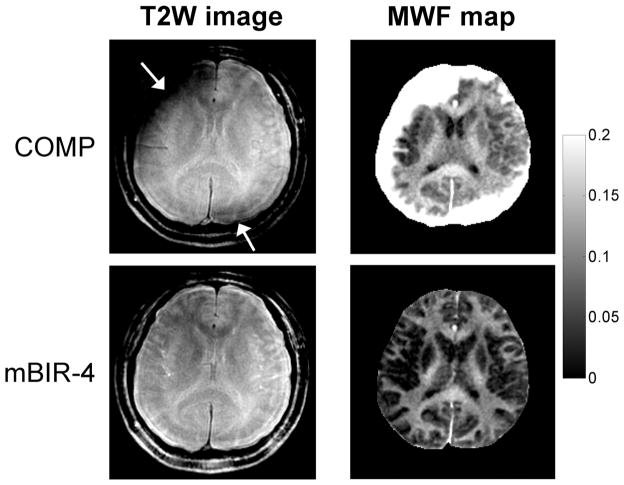
All human scans were completed successfully. The whole brain MWF processing time (28–32 slices) was approximately 30 min. Figure 3 shows an example of spiral T2W images and MWF maps extracted from one midbrain slice in a healthy volunteer. The image obtained with COMP showed severe artifacts, which increased with distance from the brain center (such as in the cerebral cortex). In comparison, mBIR-4 provided much-improved image and MWF map quality, indicating more robust T2 weighting in the presence of field inhomogeneities.
FIG. 3.
Comparison of spiral T2W images (TE ~40 ms) and derived MWF maps obtained with conventional COMP and proposed adiabatic mBIR-4 T2prep using FAST-T2 acquisition with 15 TEs in a healthy subject at 3T. Only one midbrain slice is shown for illustration. The COMP design introduced marked signal losses (arrows) near the brain periphery, which led to severe artifacts in the calculated MWF maps. These artifacts were absent in the maps obtained with mBIR-4. Note that focal areas with MWF exceeding 20% in both COMP and mBIR-4 maps are blood vessels or cerebrospinal fluid in the interhemispheric fissure (most likely due to poor fitting in the presence of flow or low SNR).
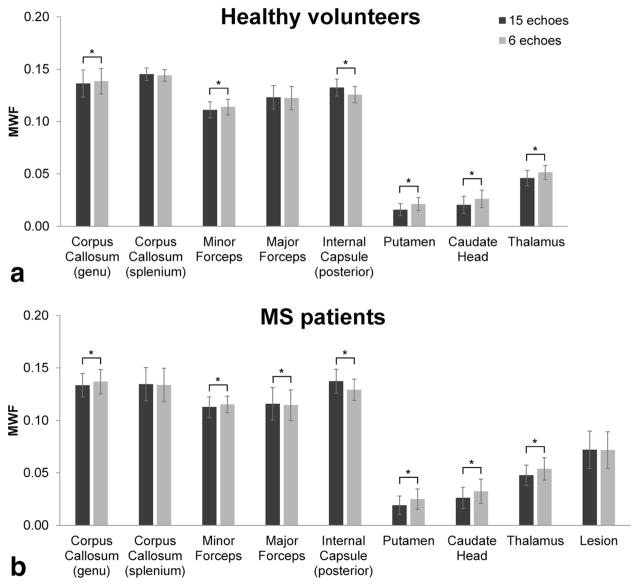
Figure 4 shows an example of high-quality MWF maps obtained with adiabatic FAST-T2 in a healthy volunteer using 15 TEs (corresponding to 10-min scan time). Reducing the number of acquired TEs to six shortened the whole brain scan time to 4 min and had a negligible effect on the visual quality of the MWF maps (Fig. 4). The difference in regional MWF was relatively small (<0.8%), although statistical significance was found in several WM structures as well as in the basal ganglia (Fig. 5).
FIG. 4.
Example of midbrain MWF maps obtained in a healthy subject at 3T using FAST-T2 acquisition with mBIR-4 adiabatic T2prep and a spatially constrained nonlinear fitting algorithm. Reducing the number of acquired TEs from 15 to six shortened the whole brain scan time from 10 min to only 4 min while providing similar MWF values across the brain (except in blood vessels).
FIG. 5.
Comparison of regional MWF measurements (mean ± SD) obtained from major WM and GM brain structures as well as MS lesions in healthy volunteers (n = 13) and patients (n = 16) using adiabatic FAST-T2 acquisition with 15 TEs (10-min whole brain scan time) and six TEs (4-min whole brain scan time). Although a statistically significant difference in mean MWF was found in a number of regions (indicated by the asterisk), these biases were relatively small in the absolute term (<0.008).
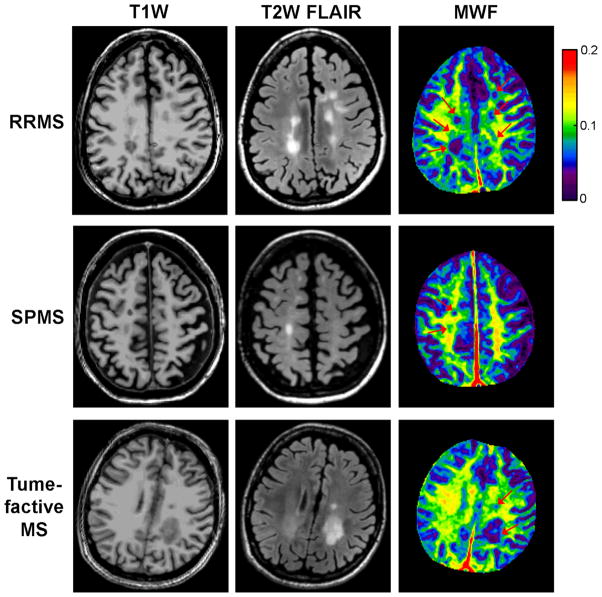
Figure 6 shows examples of MS lesion appearance on MWF maps obtained from three MS patients with different MS phenotypes (relapsing-remitting, secondary progressive, and tumefactive MS). There was a good visual correlation between lesions of various sizes seen on these maps and those appearing on corresponding T1W and T2W anatomical images.
FIG. 6.
Examples of MS lesion appearance on coregistered T1W and FLAIR T2W anatomical images and MWF maps obtained in three patients with different MS phenotypes, demonstrating the spatial heterogeneity of MWF within lesions. The FAST-T2 acquisition time for whole brain MWF mapping was 4 min.
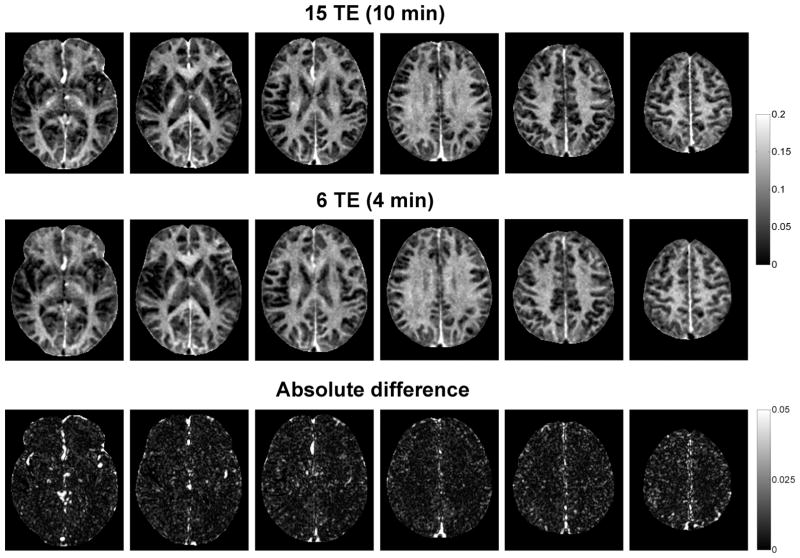
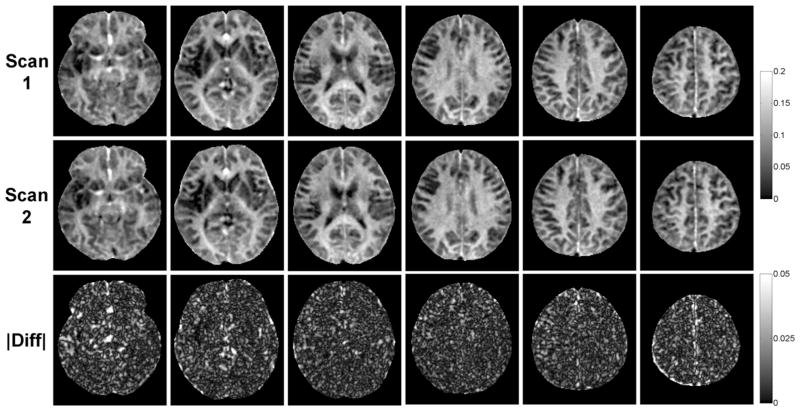
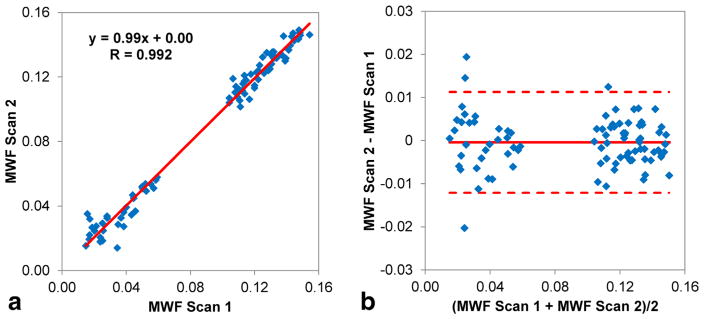
MWF maps obtained from repeated scans on the same scanner were found to be highly reproducible (Fig. 7). Regional MWF values obtained from all 11 healthy volunteers showed excellent correlation between scans (R = 0.99, slope of regression line = 0.99) (Fig. 8a). The Bland–Altman plot revealed negligible MWF bias within narrow 95% limits of agreement of approximately ±1% (Fig. 8b). On a per-voxel basis over the whole brain of each subject, the agreement between repeated scans remained strong (mean correlation R = 0.89 ± 0.03; mean MWF bias = −0.01 ± 0.29%; mean 95% limits of agreement = [−3.35 ± 0.73%, 3.33 ± 0.61%], n = 11). The COV for regional WM MWF measurements obtained over two scans was 1.7 ± 1.3% (genu of corpus callosum), 1.6 ± 0.8% (splenium of corpus callosum), 2.4 ± 2.0% (minor forceps), 1.3 ± 0.8% (major forceps), and 2.0 ± 1.4% (posterior limbs of the internal capsule).
FIG. 7.
Comparison of brain MWF maps (only 6 out of 28 acquired slices are shown) and their absolute differences obtained from repeated scans in a healthy volunteer, demonstrating high reproducibility of the developed 4-min FAST-T2 acquisition.
FIG. 8.
(a) Scatter plot and linear regression line of the 88 regional MWF measurements obtained by repeated scans in five WM and three GM brain structures in 11 healthy volunteers. (b) Bland–Altman plot of the same data, showing negligible bias and narrow 95% limits of agreement of approximately ±1% between the two sets of measurements.
DISCUSSION
A fast and reliable biomarker of myelin change is a highly desired goal to advance the study of MS. Despite its advantage of providing the highest correlation with myelin staining in postmortem MS brains compared with other MRI measures (36), MWF mapping based on T2 relaxometry so far has not gained widespread clinical acceptance due to its long acquisition time and/or limited reproducibility caused by noise sensitive MWF extraction. Accordingly, our approach to overcome this long-standing problem has been to develop 1) a fast and robust 3D pulse sequence that offers highly SNR-efficient acquisition and flexible TE sampling for imaging at higher clinical field strengths such as 3T and 2) a reliable postprocessing algorithm that uses spatial constraints to mitigate the noise amplification effect in the MWF maps. Our preliminary results obtained with the adiabatic FAST-T2 pulse sequence and spatially constrained nonlinear data fitting algorithm developed for 3T imaging in this study demonstrates that rapid MWF mapping of the whole brain is feasible in only 4 min and has a high intrasite reproducibility.
A fundamental requirement for T2-based MWF quantification is accurate T2 weighting of the tissue signals. A prior FAST-T2 implementation for whole brain imaging at 1.5T used a T2prep module consisting of “hard” rectangular RF pulses, which was shown to provide reasonable MWF maps but with limited SNR in 24 min (18). In this study, we used a higher main field strength of 3T and a longer spiral readout to improve SNR and used this SNR gain to reduce the number of acquired TEs and, ultimately, the acquisition time. This SNR benefit, however, came with certain technical challenges, including less accurate T2 weighting and increased image artifacts due to larger B0 and B1 field inhomogeneities at 3T. For example, Lutti et al. (37) estimated that the B1 error of a volume transmit coil in the brain at 3T can be as large as 30%, particularly at the brain periphery and near air–tissue interfaces. While the 90x180y90x composite refocusing pulse used in the classic COMP T2prep sequence (21) has been shown to provide good compensation against small RF setting errors for even echoes (22), it proved inadequate for accurate T2 weighting in such scenarios, leading to severe image artifacts and inaccurate MWF maps. One potential solution to this problem would be to treat RF transmit error as an unknown and develop a more sophisticated signal model to incorporate this unwanted effect in the data fitting (20). Here, we offered a different solution through pulse sequence modification by replacing the conventional spin echo–based T2prep with an adiabatic 0° mBIR-4 pulse, which is known to provide significantly improved robustness against off-resonance and RF error (23,24). The high quality of the MWF maps obtained in this study, even with as few as six TEs, can be attributed partly to the improved T2 weighting accuracy of the proposed mBIR-4 pulse.
Another important factor contributing to the improved quality of the MWF maps obtained in this study was the possibility of acquiring image data at a very short TE (~0.5 ms) by not playing out the T2prep before the spiral readout. This is a unique feature of the FAST-T2 sequence, which is not available with a CPMG based MESE sequence where the shortest achievable TE was ~10 ms. Assuming a myelin water T2 of about 10 ms, this difference in TE translates to a significant difference in the attenuation of the myelin water signal (only 5% for FAST-T2 and 63% for MESE). This advantage, combined with the much greater flexibility in TE sampling, has enabled significant scan time reduction from 10 to 20 min by existing advanced pulse sequences to 4 min demonstrated in this study without loss in MWF map quality.
The MWF values obtained in this study for major brain structures in healthy volunteers (10%–15% for WM and 2%–5% for deep GM) were similar to those obtained by Kolind et al. (16) using the classic 2D MESE sequence (single 5-mm slice in 26 min) as well as those reported by Prasloski et al. (17) using the more advanced 3D MESE (seven slices of 5-mm thickness in 19.8 min) and 3D GRASE (20 slices of 5-mm thickness in 14 min 22 s) sequences (all of these studies were performed at 3T). Our intrasite reproducibility of regional MWF measurements as measured by the Pearson correlation coefficient (R = 0.99) was slightly better than previously reported values obtained with the 3D MESE sequence at 3T (38). The reproducibility remained good on a voxel-wise basis (R = 0.89, 95% limits of agreement of approximately ± 3.3% with a negligible bias). Overall, the FAST-T2 sequence developed in this study provided similar MWF quantification compared with spin echo–based sequences reported in the literature, with the added benefit of much shorter scan time, thereby improving the clinical feasibility of the T2-based MWF mapping.
The implemented adiabatic FAST-T2 sequence has a few technical challenges. First, the flip angle of the mBIR-4 pulse is determined by a large phase jump when the RF amplitude sharply crosses zero, which can be difficult to achieve precisely. This can lead to a small scanner-dependent signal loss (1%–2%) and requires correction as performed in this study. Second, tissue T1 was assumed to be much longer than the adiabatic pulse length (which is true for most brain tissues) and the potential effect of exchange processes during the pulse was not considered in order to simplify the signal equation. The signal decay occurring during the BIR-4 adiabatic rotation has often been characterized using T2ρ, the time decay constant in the RF rotating frame (39). In this study, we adopted the approach proposed by Wang et al. (25) by modeling the signal decay as a pure T2 effect and estimating the effective ΔTE shift introduced by a given pulse. Third, a fairly conservative BIR-4 pulse (10 ms long) was used to ensure that the adiabatic condition was met. Future studies will consider shortening this pulse to reduce the ΔTE shift and the associated signal loss in the data acquired at the earliest TEs, thereby improving the sensitivity to the myelin water signal. Finally, spiral image blurring due to the increased main field inhomogeneity at 3T and the deleterious effects of eddy currents may require B0 and k-space trajectory mapping and correction (40,41).
This study has several limitations. The adiabatic mBIR-4 pulse does not employ multiple refocusing RFs as in the traditional spin echo–based T2prep and therefore may introduce subtle differences in signal weighting in the presence of iron, flow or diffusion, which was not examined in this study. The use of a three-pool fitting algorithm in conjunction with a maximum TE of about 300 ms may be inadequate for detecting the lesional water pool in MS brains (42). Future work should consider a more generalized data fitting model and the use of larger TEs for the improved detection of this MS-specific water pool. The reproducibility of the developed MWF mapping protocol on MR scanning equipment from different vendors was not investigated due to limited hardware and software access. In addition, MS patients were not enrolled in the reproducibility study. We are actively developing FAST-T2 for other scanner platforms and field strengths to assess the multisite reproducibility of our technique. We are also exploring C++ implementation of the computationally intensive spatially constrained fitting algorithm in order to further reduce the whole brain MWF extraction time by one to two orders of magnitude for online reconstruction. Finally, the accuracy of FAST-T2 based myelin quantification needs to be evaluated against histological measurements of myelin in ex vivo human brains or animal models, which is a major focus of our future work.
In conclusion, whole brain myelin mapping using the adiabatic FAST-T2 pulse sequence is feasible in 4 min at 3T and provides excellent intrasite reproducibility in healthy subjects.
Acknowledgments
This work was supported in part by a grant from the National Multiple Sclerosis Society (RG 4661-A-2).
References
- 1.Compston A, Coles A. Multiple sclerosis. Lancet. 2008;372:1502–1517. doi: 10.1016/S0140-6736(08)61620-7. [DOI] [PubMed] [Google Scholar]
- 2.Lassmann H. Review: the architecture of inflammatory demyelinating lesions: implications for studies on pathogenesis. Neuropathol Appl Neurobiol. 2011;37:698–710. doi: 10.1111/j.1365-2990.2011.01189.x. [DOI] [PubMed] [Google Scholar]
- 3.Poloni G, Minagar A, Haacke EM, Zivadinov R. Recent developments in imaging of multiple sclerosis. Neurologist. 2011;17:185–204. doi: 10.1097/NRL.0b013e31821a2643. [DOI] [PubMed] [Google Scholar]
- 4.MacKay A, Whittall K, Adler J, Li D, Paty D, Graeb D. In vivo visualization of myelin water in brain by magnetic resonance. Magn Reson Med. 1994;31:673–677. doi: 10.1002/mrm.1910310614. [DOI] [PubMed] [Google Scholar]
- 5.Deoni SC, Rutt BK, Arun T, Pierpaoli C, Jones DK. Gleaning multi-component T1 and T2 information from steady-state imaging data. Magn Reson Med. 2008;60:1372–1387. doi: 10.1002/mrm.21704. [DOI] [PubMed] [Google Scholar]
- 6.Alonso-Ortiz E, Levesque IR, Pike GB. MRI-based myelin water imaging: a technical review. Magn Reson Med. 2015;73:70–81. doi: 10.1002/mrm.25198. [DOI] [PubMed] [Google Scholar]
- 7.Laule C, Kozlowski P, Leung E, Li DK, Mackay AL, Moore GR. Myelin water imaging of multiple sclerosis at 7 T: correlations with histopathology. NeuroImage. 2008;40:1575–1580. doi: 10.1016/j.neuroimage.2007.12.008. [DOI] [PubMed] [Google Scholar]
- 8.Kozlowski P, Liu J, Yung AC, Tetzlaff W. High-resolution myelin water measurements in rat spinal cord. Magn Reson Med. 2008;59:796–802. doi: 10.1002/mrm.21527. [DOI] [PubMed] [Google Scholar]
- 9.McCreary CR, Bjarnason TA, Skihar V, Mitchell JR, Yong VW, Dunn JF. Multiexponential T2 and magnetization transfer MRI of demyelination and remyelination in murine spinal cord. NeuroImage. 2009;45:1173–1182. doi: 10.1016/j.neuroimage.2008.12.071. [DOI] [PMC free article] [PubMed] [Google Scholar]
- 10.Laule C, Vavasour IM, Moore GR, Oger J, Li DK, Paty DW, MacKay AL. Water content and myelin water fraction in multiple sclerosis. A T2 relaxation study. J Neurol. 2004;251:284–293. doi: 10.1007/s00415-004-0306-6. [DOI] [PubMed] [Google Scholar]
- 11.MacKay A, Laule C, Vavasour I, Bjarnason T, Kolind S, Madler B. Insights into brain microstructure from the T2 distribution. Magn Reson Imaging. 2006;24:515–525. doi: 10.1016/j.mri.2005.12.037. [DOI] [PubMed] [Google Scholar]
- 12.Kolind S, Matthews L, Johansen-Berg H, Leite MI, Williams SC, Deoni S, Palace J. Myelin water imaging reflects clinical variability in multiple sclerosis. NeuroImage. 2012;60:263–270. doi: 10.1016/j.neuroimage.2011.11.070. [DOI] [PMC free article] [PubMed] [Google Scholar]
- 13.Graham SJ, Stanchev PL, Bronskill MJ. Criteria for analysis of multicomponent tissue T2 relaxation data. Magn Reson Med. 1996;35:370–378. doi: 10.1002/mrm.1910350315. [DOI] [PubMed] [Google Scholar]
- 14.Bjarnason TA, McCreary CR, Dunn JF, Mitchell JR. Quantitative T2 analysis: the effects of noise, regularization, and multivoxel approaches. Magn Reson Med. 2010;63:212–217. doi: 10.1002/mrm.22173. [DOI] [PubMed] [Google Scholar]
- 15.Whittall KP, MacKay AL, Graeb DA, Nugent RA, Li DK, Paty DW. In vivo measurement of T2 distributions and water contents in normal human brain. Magn Reson Med. 1997;37:34–43. doi: 10.1002/mrm.1910370107. [DOI] [PubMed] [Google Scholar]
- 16.Kolind SH, Madler B, Fischer S, Li DK, MacKay AL. Myelin water imaging: implementation and development at 3.0T and comparison to 1.5T measurements. Magn Reson Med. 2009;62:106–115. doi: 10.1002/mrm.21966. [DOI] [PubMed] [Google Scholar]
- 17.Prasloski T, Rauscher A, MacKay AL, Hodgson M, Vavasour IM, Laule C, Madler B. Rapid whole cerebrum myelin water imaging using a 3D GRASE sequence. NeuroImage. 2012;63:533–539. doi: 10.1016/j.neuroimage.2012.06.064. [DOI] [PubMed] [Google Scholar]
- 18.Nguyen TD, Wisnieff C, Cooper MA, Kumar D, Raj A, Spincemaille P, Wang Y, Vartanian T, Gauthier SA. T2 prep three-dimensional spiral imaging with efficient whole brain coverage for myelin water quantification at 1.5 tesla. Magn Reson Med. 2012;67:614–621. doi: 10.1002/mrm.24128. [DOI] [PubMed] [Google Scholar]
- 19.Kitzler HH, Su J, Zeineh M, Harper-Little C, Leung A, Kremenchutzky M, Deoni SC, Rutt BK. Deficient MWF mapping in multiple sclerosis using 3D whole-brain multi-component relaxation MRI. NeuroImage. 2012;59:2670–2677. doi: 10.1016/j.neuroimage.2011.08.052. [DOI] [PMC free article] [PubMed] [Google Scholar]
- 20.Prasloski T, Madler B, Xiang QS, MacKay A, Jones C. Applications of stimulated echo correction to multicomponent T2 analysis. Magn Reson Med. 2012;67:1803–1814. doi: 10.1002/mrm.23157. [DOI] [PubMed] [Google Scholar]
- 21.Brittain JH, Hu BS, Wright GA, Meyer CH, Macovski A, Nishimura DG. Coronary angiography with magnetization-prepared T2 contrast. Magn Reson Med. 1995;33:689–696. doi: 10.1002/mrm.1910330515. [DOI] [PubMed] [Google Scholar]
- 22.Levitt MH, Freeman R. Compensation for Pulse Imperfections in Nmr Spin-Echo Experiments. J Magn Reson. 1981;43:65–80. [Google Scholar]
- 23.DeGraaf RA, Nicolay K. Adiabatic rf pulses: applications to in vivo NMR. Concept Magnetic Res. 1997;9:247–268. [Google Scholar]
- 24.Jenista ER, Rehwald WG, Chen EL, Kim HW, Klem I, Parker MA, Kim RJ. Motion and flow insensitive adiabatic T2-preparation module for cardiac MR imaging at 3 Tesla. Magn Reson Med. 2013;70:1360–1368. doi: 10.1002/mrm.24564. [DOI] [PMC free article] [PubMed] [Google Scholar]
- 25.Wang G, El-Sharkawy AM, Edelstein WA, Schar M, Bottomley PA. Measuring T-2 and T-1, and imaging T-2 without spin echoes. J Magn Reson. 2012;214:273–280. doi: 10.1016/j.jmr.2011.11.016. [DOI] [PMC free article] [PubMed] [Google Scholar]
- 26.Bottomley PA, Ouwerkerk R. Optimum flip-angles for exciting NMR with uncertain T1 values. Magn Reson Med. 1994;32:137–141. doi: 10.1002/mrm.1910320120. [DOI] [PubMed] [Google Scholar]
- 27.Kellman P, Herzka DA, Hansen MS. Adiabatic inversion pulses for myocardial T1 mapping. Magn Reson Med. 2014;71:1428–1434. doi: 10.1002/mrm.24793. [DOI] [PMC free article] [PubMed] [Google Scholar]
- 28.Bertero M, Boccacci P, Pike ER. On the recovery and resolution of exponential relaxation rates from experimental data. II. The optimum choice of experimental sampling Points for Laplace transform inversion. Proc R Soc Lond A Math Phys Sci. 1984;393:51–65. [Google Scholar]
- 29.Monohan E, Pandya S, Fujimoto K, Nguyen TD, Blackwell C, Nealon N, Perumal JS, Raj A, Vartanian T, Gauthier S. Clinical investigation of whole brain myelin water fraction imaging in patients with multiple sclerosis. Proceedings of the 22nd Annual Meeting of ISMRM; Milan, Italy. 2014; p. 906. [Google Scholar]
- 30.Du YP, Chu R, Hwang D, Brown MS, Kleinschmidt-DeMasters BK, Singel D, Simon JH. Fast multislice mapping of the myelin water fraction using multicompartment analysis of T2* decay at 3T: a preliminary postmortem study. Magn Reson Med. 2007;58:865–870. doi: 10.1002/mrm.21409. [DOI] [PubMed] [Google Scholar]
- 31.Nguyen TD, Deh K, Raj A, Gauthier SA, Wang Y. Rapid and robust whole brain myelin water mapping in 6.5 minutes: validation and clinical feasibility. Proceedings of the 22nd Annual Meeting of ISMRM; Milan, Italy. 2014; p. 3393. [Google Scholar]
- 32.Kumar D, Nguyen TD, Gauthier SA, Raj A. Bayesian algorithm using spatial priors for multiexponential T(2) relaxometry from multiecho spin echo MRI. Magn Reson Med. 2012;68:1536–1543. doi: 10.1002/mrm.24170. [DOI] [PubMed] [Google Scholar]
- 33.Smith SM. Fast robust automated brain extraction. Human brain mapping. 2002;17:143–155. doi: 10.1002/hbm.10062. [DOI] [PMC free article] [PubMed] [Google Scholar]
- 34.Jenkinson M, Bannister P, Brady M, Smith S. Improved optimization for the robust and accurate linear registration and motion correction of brain images. NeuroImage. 2002;17:825–841. doi: 10.1016/s1053-8119(02)91132-8. [DOI] [PubMed] [Google Scholar]
- 35.Meyers SM, Vavasour IM, Madler B, Harris T, Fu E, Li DK, Traboulsee AL, Mackay AL, Laule C. Multicenter measurements of myelin water fraction and geometric mean T2: intra- and intersite reproducibility. J Magn Reson Imaging. 2013;38:1445–1453. doi: 10.1002/jmri.24106. [DOI] [PubMed] [Google Scholar]
- 36.Laule C, Vavasour IM, Kolind SH, Li DK, Traboulsee TL, Moore GR, MacKay AL. Magnetic resonance imaging of myelin. Neurotherapeutics. 2007;4:460–484. doi: 10.1016/j.nurt.2007.05.004. [DOI] [PMC free article] [PubMed] [Google Scholar]
- 37.Lutti A, Hutton C, Finsterbusch J, Helms G, Weiskopf N. Optimization and validation of methods for mapping of the radiofrequency transmit field at 3T. Magn Reson Med. 2010;64:229–238. doi: 10.1002/mrm.22421. [DOI] [PMC free article] [PubMed] [Google Scholar]
- 38.Meyers SM, Laule C, Vavasour IM, Kolind SH, Madler B, Tam R, Traboulsee AL, Lee J, Li DK, MacKay AL. Reproducibility of myelin water fraction analysis: a comparison of region of interest and voxel-based analysis methods. Magn Reson Imaging. 2009;27:1096–1103. doi: 10.1016/j.mri.2009.02.001. [DOI] [PubMed] [Google Scholar]
- 39.Mangia S, Liimatainen T, Garwood M, Michaeli S. Rotating frame relaxation during adiabatic pulses vs. conventional spin lock: simulations and experimental results at 4 T. Magn Reson Imaging. 2009;27:1074–1087. doi: 10.1016/j.mri.2009.05.023. [DOI] [PMC free article] [PubMed] [Google Scholar]
- 40.Noll DC, Meyer CH, Pauly JM, Nishimura DG, Macovski A. A homogeneity correction method for magnetic resonance imaging with time-varying gradients. IEEE Trans Med Imaging. 1991;10:629–637. doi: 10.1109/42.108599. [DOI] [PubMed] [Google Scholar]
- 41.Tan H, Meyer CH. Estimation of k-space trajectories in spiral MRI. Magn Reson Med. 2009;61:1396–1404. doi: 10.1002/mrm.21813. [DOI] [PMC free article] [PubMed] [Google Scholar]
- 42.Laule C, Vavasour IM, Madler B, Kolind SH, Sirrs SM, Brief EE, Traboulsee AL, Moore GR, Li DK, MacKay AL. MR evidence of long T2 water in pathological white matter. J Magn Reson Imaging. 2007;26:1117–1121. doi: 10.1002/jmri.21132. [DOI] [PubMed] [Google Scholar]


