Abstract
Spectral analysis of surface electromyograms (sEMG) is often used to estimate central and peripheral characteristics of a motor unit (MU) population, such as average conduction velocity, proportion of muscle fiber types, and pattern of MU recruitment. This estimation is based on the assumption that the sEMG adequately reflects the frequency characteristics of the underlying MU action potentials (MUAP). However, sEMG has limitations in this respect, based on physiological and non-physiological factors that influence its frequency content. We present a method to examine characteristics of a MU population more reliably by assessing the distributions of frequency content and amplitude for a collection of individual MUAPs, identified using high-density sEMG decomposition. We demonstrate the use of this approach to examine how MU characteristics differ across muscles and in the post-stroke state by presenting preliminary data from deltoid (DELT), biceps (BIC), and finger flexor (FF) MU populations from 12 post-stroke individuals and 8 able-bodied controls. The results show differences in the magnitude and range of MUAP median frequencies across muscles in both groups. The group median values were higher in the stroke group for the DELT and FF and lower in the stroke group for the BIC. The range of frequencies was larger in the stroke group for all muscles. The distribution of MUAP RMS amplitude in both stroke and control groups had a substantially larger range in FF than in DELT and BIC. The group median values for the FF were twice as large in the stroke group. In addition, there were differences in the frequency and amplitude results between MUAP and global sEMG analyses. The implications of these findings and possible applications of the approach are discussed.
I. Introduction
Spectral analysis of surface electromyograms (sEMG) is a technique that has been widely used to infer characteristics of a motor unit (MU) population, such as average muscle fiber conduction velocity, proportion of type 1 vs. type 2 muscle fiber types, and pattern of MU recruitment [1]. Its ability to do so relies in part on the strength of the relationship between the power spectrum of the sEMG and that of the underlying MU action potential (MUAP) shapes. The rationale for the necessity of this relationship is that the frequencies in a MUAP are thought to have a positive relationship with the muscle fiber conduction velocity, which has a positive relationship with the muscle fiber diameter, which is related to muscle type and recruitment threshold. However, the relationships between these variables are complicated, and the ability to reliably estimate them through spectral analysis of sEMG can be limited [1].
There is a complex collection of physiological and non-physiological factors that influences the sEMG, and as such, there are also limitations in the extent to which sEMG reflects the collective frequency characteristics of the population of individual MUAPs. For example, summation of multiple MUAPs results in amplitude cancellation in the aggregate EMG signal, and cross-talk from neighboring muscles may introduce unrelated frequency content. In addition, factors related to the activation of the MU population (rather than the collective characteristics of the individuals MUAPs), can affect the power spectrum of the sEMG, such as the number of recruited MU, MU discharge rate and variability, and synchronization of multiple MU.
Due to these limitations, we propose a method to more reliably examine characteristics of a MU population by directly estimating the frequency content and amplitude of many individual MUAPs using high-density sEMG MU decomposition (HDsEMG). This approach provides a number of advantages: the ability to (1) extract MUAP characteristics from sEMG more efficiently than intramuscular approaches [2], allowing for analysis of a greater number of MU and in multiple muscles [3], (2) estimate MUAP shapes across a large portion of a muscle, and (3) identify MU-specific characteristics without the confounds of cross-talk from other muscles, sEMG frequency distortions, or contributions from other MU within the same muscle.
The ability to examine characteristics of MU populations in individuals post-stroke is crucial for understanding central and peripheral mechanisms of post-stroke motor impairments. In addition, relatively little is known about how MU characteristics differ across muscles even in the healthy state. We present this approach for estimating characteristics of a MU population from a collection of individual MUAPs with preliminary data from proximal and distal muscles of the upper limb in able-bodied individuals and those with chronic post-stroke hemiparesis. Results are compared with those obtained using the global sEMG measures.
II. Methods
A. Participants
Twelve individuals with chronic hemiparetic stroke (mean ± SD age: 60 ± 5 years; time post-stroke: 13 ± 9 years; 9 males, 3 females) and eight able-bodied individuals (mean ± SD age: 56 ± 13 years, 5 males, 3 females) were included. Post-stroke participants had moderate-to-severe upper limb impairment (mean upper limb Fugl-Meyer Motor Score: 22; mean Chedoke-McMaster hand score: 3). The study was approved by the IRB of Northwestern University, and participants gave informed consent prior to enrollment.
B. Experimental Apparatus and High-Density sEMG
The experiment was conducted in a device capable of measuring isometric joint torques and MU discharge from proximal and distal joints and muscles simultaneously that has been presented previously [3]. Briefly, the tested forearm of participants seated in a Biodex chair was casted and secured to a six degree-of-freedom load cell (JR3, Inc.). The standardized arm position was 75° shoulder abduction, 90° elbow flexion, 15° pronation, and 0° wrist and finger flexion/extension. For the paretic limb, fingers were positioned at 15° flexion to accommodate range of motion restrictions. Real-time visual feedback of torque generation at a given joint and direction was displayed on a monitor.
HDsEMG was obtained in bipolar fashion from grids of 64 electrodes with 8 mm inter-electrode distance and placed on the deltoid (DELT), biceps brachii (BIC), and extrinsic finger flexor bellies (FF). For most participants, two 64-channel grids were placed on the DELT, targeting the anterior and intermediate heads, and data from both heads were combined for MU decomposition. For seven of the participants, only the grid on the anterior deltoid was placed. Signals were amplified (x1k – 10k), band-pass filtered (10 – 500 Hz), and digitized at a sampling frequency of 2048 Hz (EMG-USB2, OT Bioelettronica).
C. Protocol
Maximum voluntary torques (MVTs) were measured for each participant during separate isometric torque generation in shoulder abduction (SABD), elbow flexion (EF), and finger flexion (FF). Participants were given vigorous verbal encouragement during the MVT trials, and real-time visual feedback of the target torque direction was displayed.
Each participant generated submaximal torque for each of the three directions (SABD, EF, and FF) at various torque levels (10, 25, and 40% for 13 of the participants; 10, 20, 30, 40% for 7 of the participants), with the order of directions and torque levels randomized. Visual feedback displayed real-time torque values in the desired torque direction. Participants were instructed to move directly to the targeted torque level and to hold the contraction for 25–30 seconds. Typically, 3–5 trials were completed for each condition.
D. Data Analysis
sEMG channels were visually inspected, and channels without significant artifacts were decomposed into MU spike trains with the Convolution Kernel Compensation (CKC) technique [2], [4], [5]. The first and last 1.5 seconds of MU discharge for each spike train were omitted to remove phases of MU recruitment and de-recruitment, isolating steady firing of the MU during maintenance of the target torque level. The coefficient of variation (COV) of the inter-spike intervals (ISI) was used to determine quality. Extreme ISI (< 33 ms and > 250 ms) were omitted. COV was calculated on the remaining ISI, and only MU spike trains with COV values less than 0.3 were used for further analysis [2].
For each MU spike train, the corresponding three-dimensional MUAP shape across the high-density sEMG grid was determined using MU spike-triggered averaging of each of the sEMG channels using a window length of ± 25 ms from each spike. The median frequency of the MUAP shape was calculated at each channel based on the power spectrum of the 50 ms MUAP at that channel. The MUAP was zero-padded prior to calculation of these variables to to obtain a Fourier window length of 2048. Root mean square (RMS) amplitude of the MUAP at each channel was calculated. Frequency and amplitude values were averaged across the channels for each MU. For the global sEMG analysis, the median frequency and RMS amplitude were calculated on the sum of all the channels of sEMG for each trial.
Between-group differences in the MUAP median frequency and RMS amplitude distributions for a given muscle were tested using a Kolmogorov-Smirnov test of the cumulative distribution functions. Within stroke and control groups, differences among DELT, BIC, and FF MUAP median frequency and RMS amplitude values were determined using a one-way ANOVA and post-hoc pairwise t-tests with the Tukey correction for multiple comparisons.
III. Results
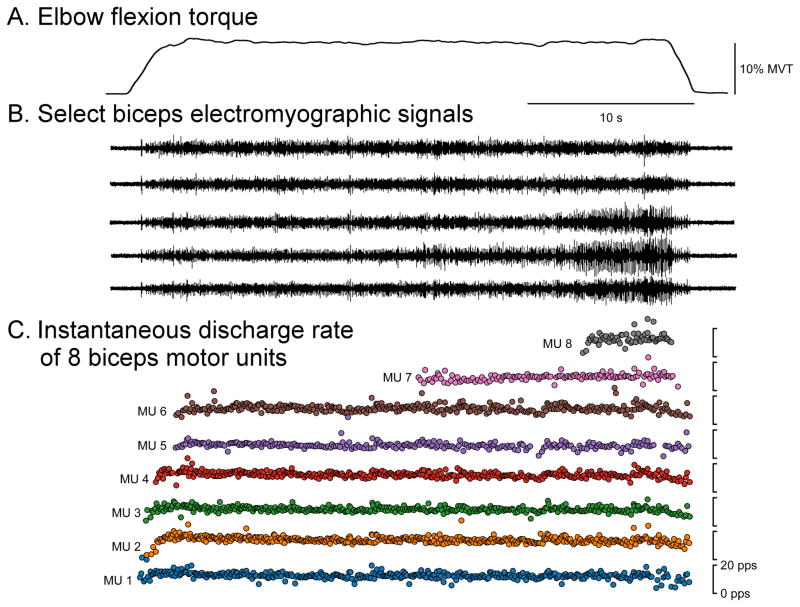
Fig. 1 displays sample data (elbow flexion torque, sEMG, and instantaneous discharge rates of BIC MU) from an elbow flexion trial at 10% MVT. For the control group, the mean ± SD (range) MU yield over all trials was 4 ± 4 (0 – 14) for DELT, 4 ± 3 (0 – 15) for BIC, and 12 ± 6 (0 – 25) for FF. For the stroke group, the mean ± SD (range) MU yield over all trials was 6 ± 4 (0 – 17) for DELT, 7 ± 5 (0 – 19) for BIC, and 10 ± 6 (0 – 30) for FF. In total across all trials, muscles, and groups, 4819 MUAP estimations were made.
Fig. 1.
Representative single trial data. Elbow flexion torque (A), five of the 64 total sEMG channels (B), and the instantaneous discharge rate of BIC MU (C) during a 10% MVT elbow flexion trial are shown.
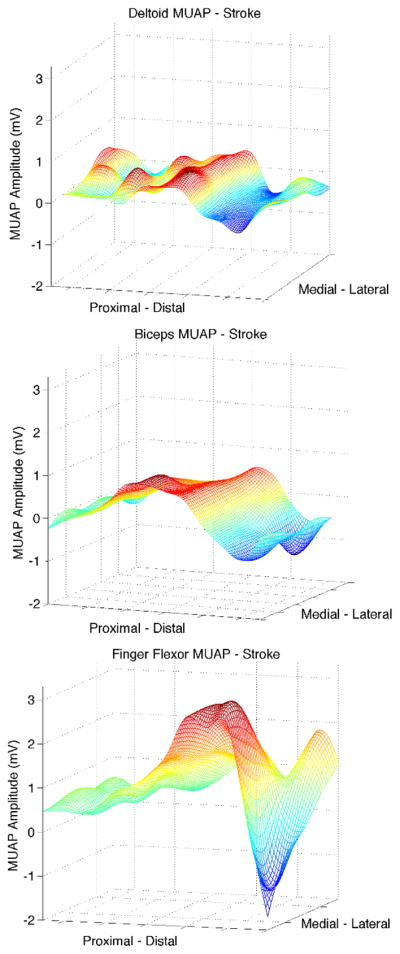
Fig. 2 displays sample MUAP shapes across the sEMG grid for one DELT, BIC, and FF MU in a post-stroke participant. Note the larger amplitude of the FF MU compared with the deltoid and biceps MUs, which is consistent with the MUAP RMS amplitude distribution of the overall pool of MU presented below in Fig. 4.
Fig. 2.

Representative MUAP shape for DELT, BIC, and FF for one stroke participant, obtained by spike-triggered averaging of the surface EMG at each channel. Note the larger amplitude of the FF MU compared with the DELT and BIC MU, consistent with the MUAP RMS amplitude distribution of the overall pool of MU shown in Fig. 4.
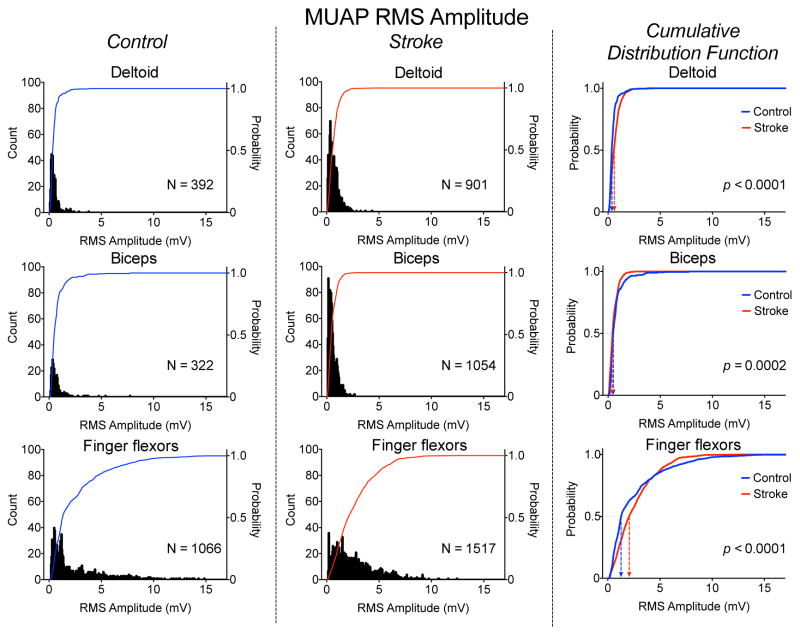
Fig. 4.
Distribution of MUAP RMS amplitude for the DELT (top), BIC (middle), and FF (bottom) muscles for the control (left panel) and stroke (middle panel) groups. The cumulative distribution functions for the stroke (red) and control (blue) groups for each muscle is shown in the right panel.
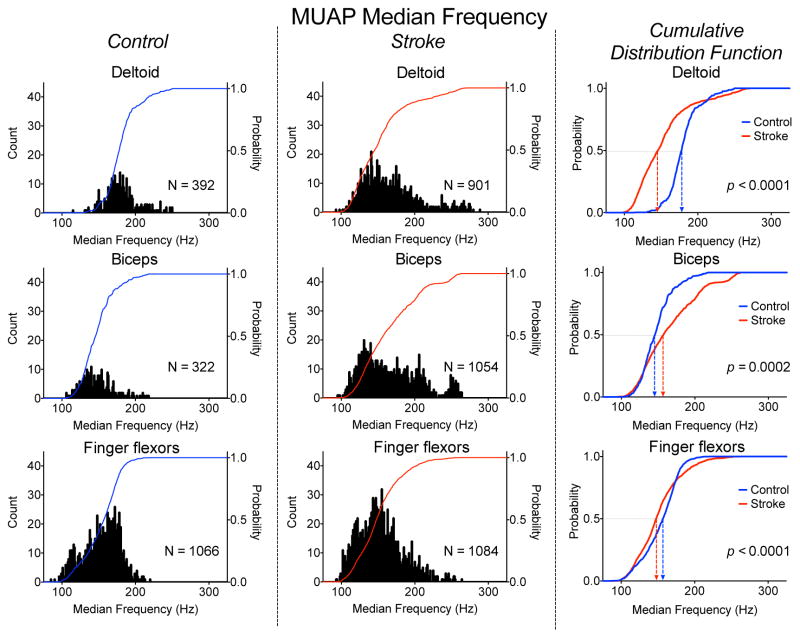
The distributions of MUAP median frequencies for the DELT, BIC, and FF for the stroke and control groups are shown in Fig. 3. The 1–99th percentile range of MUAP median frequencies for the DELT, BIC, and FF were noticeably smaller in the control group, at 113, 101, 103 Hz compared with 157, 151, and 140 Hz for the stroke group. This increased range in the post-stroke distribution seems to be due to increased inter-participant variability rather than an increased range of values for each participant.
Fig. 3.
Distribution of MUAP Median Frequency for the DELT (top), BIC (middle), and FF (bottom) muscles for the control (left panel) and stroke (middle panel) groups. The cumulative distribution functions for the stroke (red) and control (blue) groups for each muscle is shown in the right panel.
The group median MUAP median frequencies for the DELT, BIC, and FF were 178, 146, and 157 Hz for the control group and 146, 158, and 148 Hz for the stroke group. Within the control group, values for DELT, BIC, and FF were significantly different from each other (p ranging from 0.001 to < 0.0001). Within the stroke group, values for BIC were significantly different from values for DELT and FF (p < 0.0001), but values for DELT and FF were not significantly different from each other (p = 0.43). For each muscle, the cumulative distribution functions were significantly different between groups (p ranging from 0.0002 to < 0.0001). For the DELT and FF, the stroke values were lower, but for the BIC, the stroke value was higher.
Group mean global sEMG median frequencies for DELT, BIC, and FF were 66, 60, and 83 Hz for the control group and 60, 65, and 66 Hz for the stroke group, showing much lower frequencies and smaller differences between muscles and groups than the MUAP values. Only values for FF showed a significant difference between groups (p = 0.01).
The distributions of MUAP RMS amplitude for each muscle for the stroke and control groups are shown in Fig. 4. Interestingly, the MUAP RMS distributions for the FF for both groups showed a substantially wider range compared with DELT and BIC. The 1–99th percentile ranges for the DELT, BIC, and FF were 1.12 2.3, 11.0 mV for the control group and 2.2, 1.7, 8.6 mV for the stroke group. The ranges were lower in the stroke group than the control group for both BIC and FF but higher in DELT.
The group median MUAP RMS amplitudes for the DELT, BIC, and FF were 0.37, 0.51, and 1.30 mV for the control group and 0.60, 0.44, and 2.07 mV Hz for the stroke group. The increased median value in the post-stroke FF is reflected in the shape of the distribution of MUAP RMS values, which has a more uniform distribution compared with that of the control FF, which has a large number of values under 1 mV. Within both stroke and control groups, the lower DELT and BIC group median MUAP RMS values were significantly different than FF values (p < 0.0001), but the difference between DELT and BIC values was only significant for the stroke group (p < 0.02). The cumulative distribution functions were significantly different between groups for each muscle (p < 0.0001). The pattern of between group comparisons across muscle was opposite from that of the median MUAP frequency, as the stroke values were greater for the DELT and FF and lower for the BIC.
The group mean RMS amplitude of the global sEMG for the DELT, BIC, and FF were 587, 449, and 582 mV for the control group and 175, 239, and 154 mV for the stroke group. The values for the control group were significantly larger than those for the stroke group for all three muscles (p ranging from 0.01 to <0.0001). There was no significant difference in the amplitude values among muscles within the control group. Within the stroke group, the BIC amplitude was greater than DELT and FF amplitudes (p = 0.03, 0.02). This pattern is different than the MUAP RMS amplitude, which was highest in the FF and lowest in the BIC.
IV. Discussion
This study proposes the use of HDsEMG to examine the characteristics of a MU population by estimating the frequency spectrum and amplitude from many individual MUAPs rather than from the global sEMG. This approach has the advantage of identifying MU-specific characteristics without the confounds of sEMG frequency distortions or contributions from other MU in the population. In addition, we present the first systematic analysis of MUAP frequency and amplitude in multiple muscles of the upper limb.
Preliminary results from 12 individuals post-stroke and eight able-bodied controls demonstrate the feasibility of this approach. Differences in MUAP median frequency and MUAP RMS amplitude were revealed among DELT, BIC, and FF, both within and between stroke and control groups. There were also differences in the pattern of results in the MUAP-determined vs. global sEMG-determined variables.
There are several potential factors that could contribute to the observed differences in MUAP frequency and amplitude among the DELT, BIC, and FF. Many of these are the same factors that could be used to infer meaning from the global sEMG, but the confounding variables are fewer when interpreting results from individual MUAPs, and therefore, the inference is more robust. For example, because we use spike-triggered averaging of the sEMG, the deleterious effect of amplitude cancellation (which is presumably random with respect to the MU spike events) on sEMG frequency is minimized. Importantly, the issue of cross-talk contamination is completely avoided with the CKC method.
The most straight-forward of these factors is the positive relationship between MUAP conduction velocity and frequency of the MUAP. By extension, because conduction velocity is proportional to the muscle fiber diameter, MUAPs with higher frequency content may be associated with larger MU. Similar reasoning can be used with MUAP amplitude. Therefore, our results may reflect, at least in part, information about MU size. Because of the difference in functional demands of the DELT, BIC, and FF, differences in MU size and distribution are likely [6]. However, it is noted that information about the size of the MU alone cannot be used to specifically extrapolate the proportion of type 1 vs. type 2 fibers [7].
In addition to providing information about MU fiber diameter, MUAP amplitude could also provide information about the number of muscle fibers per MU. While MU fiber diameter and number of muscle fibers per MU are related [8], increases in the latter could separately occur as a result of sprouting of collateral MU after MU denervation [9].
A limitation of the proposed approach is that it does not take into account the depth of the MU or subcutaneous or intramuscular adipose tissue. While it removes many negative consequences about inferring MU population characteristics from the global sEMG, the MUAPs we present are still from surface recordings. Therefore, the surface MUAP representation of a deeper MU will have attenuated frequencies and amplitude compared the same MU at a more superficial position, as would MU that propagate through increased adipose tissue. However, it is likely that the HDsEMG decomposition is biased toward superficial MU, so MU depth is less of an issue.
The sEMG power spectrum has been used in several studies to suggest differences in MU characteristics in individuals post-stroke based on decreased frequency content of the global sEMG [9]–[11]. Because post-stroke MU may exhibit decreased discharge rates and rate modulation [3], [11] and possibly increased synchronization, however, it is difficult to separate these discharge effects from post-stroke differences in the MUAP itself. Kallenberg and Hermens [9] had a preliminary report of BIC MUAP characteristics using lower density sEMG decomposition, although the group mean MUAP and global sEMG frequency and amplitude values were not thoroughly reported. Although the MUAP-specific results presented herein are too preliminary to make strong inferences about changes in MU characteristics post-stroke, they provide crucial new information with which to guide future work.
Acknowledgments
We thank Jessica Wilson, Scott Heinichen, Megan McLerran, Kelsey Rose, Kristen Schulz, and Amanda Winters for assistance with data collection.
Footnotes
This work was supported by NIH grants R01-HD039343 and T32EB009406 (JD), European Research Council Advanced Grant DEMOVE No. 267888 (DF), and a Promotion of Doctoral Studies Scholarship from the Foundation for Physical Therapy, Inc. (LMM).
Contributor Information
Laura Miller McPherson, Department of Physical Therapy, Florida International University, Miami, FL.
Francesco Negro, Universitätsmedizin Göttingen, Germany.
Chris K. Thompson, Department of Physical Therapy, Temple University, Philadelphia, PA
Laura Sanchez, Department of Physical Therapy, Florida International University, Miami, FL.
CJ Heckman, Department of Physiology, Northwestern University, Chicago, IL.
Jules Dewald, Department of Physical Therapy and Human Movement Sciences, Northwestern University, Chicago, IL.
Dario Farina, Universitätsmedizin Göttingen, Germany.
References
- 1.Farina D. The extraction of neural strategies from the surface EMG. J Appl Physiol. 2004;96(4):1486–1495. doi: 10.1152/japplphysiol.01070.2003. [DOI] [PubMed] [Google Scholar]
- 2.Holobar A, Minetto M, Botter A, Negro F, Farina D. Experimental Analysis of Accuracy in the Identification of Motor Unit Spike Trains. IEEE Trans neural Syst Rehabil Eng. 2010;18(3):221–229. doi: 10.1109/TNSRE.2010.2041593. [DOI] [PubMed] [Google Scholar]
- 3.Miller LC, Thompson CK, Negro F, Heckman CJ, Farina D, Dewald JPA. High-density surface EMG decomposition allows for recording of motor unit discharge from proximal and distal flexion synergy muscles simultaneously in individuals with stroke. Conference Proceedings of the IEEE Engineering in Medicince and Biology Society; 2014; pp. 5340–5344. [DOI] [PMC free article] [PubMed] [Google Scholar]
- 4.Negro F, Muceli S, Castronovo AM, Holobar A, Farina D. Multi-channel intramuscular and surface EMG decomposition by convolutive blind source separation. J Neural Eng. 2016 Feb;13(2):026027. doi: 10.1088/1741-2560/13/2/026027. [DOI] [PubMed] [Google Scholar]
- 5.Holobar A, Zazula D. Multichannel blind source separation using convolution Kernel compensation. IEEE Trans Signal Process. 2007;55(9):4487–4496. [Google Scholar]
- 6.Schiaffino S, Reggiani C. Fiber types in mammalian skeletal muscles. Physiol Rev. 2011 Oct;91(4):1447–531. doi: 10.1152/physrev.00031.2010. [DOI] [PubMed] [Google Scholar]
- 7.Enoka RM, Duchateau J. Inappropriate interpretation of surface EMG signals and muscle fiber characteristics impedes progress on understanding the control of neuromuscular function. J Appl Physiol. 2015 Jul;119(12) doi: 10.1152/japplphysiol.00280.2015. jap.00280.2015. [DOI] [PubMed] [Google Scholar]
- 8.Heckman CJ, Enoka RM. Motor unit. Compr Physiol. 2012;2(4):2629–2682. doi: 10.1002/cphy.c100087. [DOI] [PubMed] [Google Scholar]
- 9.Kallenberg LAC, Hermens HJ. Motor unit properties of biceps brachii in chronic stroke patients assessed with high-density surface EMG. Muscle Nerve. 2009 Feb;39(2):177–85. doi: 10.1002/mus.21090. [DOI] [PubMed] [Google Scholar]
- 10.Li X, Shin H, Zhou P, Niu X, Liu J, Rymer WZ. Power spectral analysis of surface electromyography (EMG) at matched contraction levels of the first dorsal interosseous muscle in stroke survivors. Clin Neurophysiol. 2014 May;125(5):988–94. doi: 10.1016/j.clinph.2013.09.044. [DOI] [PubMed] [Google Scholar]
- 11.Gemperline JJ, Allen S, Walk D, Rymer WZ. Characteristics of motor unit discharge in subjects with hemiparesis. Muscle and Nerve. 1995;18(10):1101–1114. doi: 10.1002/mus.880181006. [DOI] [PubMed] [Google Scholar]


