

Abstract
Introduction
Injuries are the leading cause of disability across all ages and gender. In this study, we identified predictors of discharge status and disability at discharge among patients who seek emergency room treatment.
Materials and Methods
The study was conducted in two major trauma hospitals in urban Gambia. 1,905 patients participated in the study. 74.9% were males, and 25.1% were females. The study includes injured patients from all mechanisms. However, patients’ records without age, gender, injury mechanism, and deposition from the emergency room were considered incomplete and excluded. We examined distributions of injury by age, gender, mechanism, place of occurrence, intent, primary body part injured, and primary nature of injury. We identified demographic and injury characteristics associated with hospital admission (compared to emergency department discharge) and discharge disability (any level of disability compared with none).
Results
The leading mechanisms of injury were road traffic (26.1%), struck by objects (22.1%), cut/pierce (19.2%), falls (19.2%), and burns (5.4%). Injuries most commonly occurred in the home (36.7%) and on the road (33.2%). For those aged 19 – 44, the proportion of injuries due to assault was higher for females (35.9% than males (29.7%). Males had increased odds for admission (aOR = 1.48 95% CI=1.15 – 1.91) and for disability (aOR = 1.45; 95% CI = 1.06 – 1.99). Increased odds for admission were found for brain injuries, fractures, large system injuries, and musculoskeletal injuries when compared with soft tissue injuries. The highest odds for any level of discharge disability were found for brain injuries, fractures, injuries from falls, burns, and road traffic.
Conclusions
Epidemiology of injuries in The Gambia is similar to other low-income countries. However, the magnitude of cases and issues uncovered highlights the need for a formal registry.
Keywords: Traumatic injury, hospital registry, disability, road traffic injury
INTRODUCTION
Globally, injuries account for 12% of all disease burden and 9% of deaths. Throughout the world there are great disparities in the prevention and care of injuries, with 1 to 2 million preventable injury deaths. Over 90% of deaths from road traffic injuries occur in low and middle-income countries1,2. Injuries disproportionately affect the productive workforce, youth, and school-age children. Almost 50% of road traffic-related mortality occurs in those aged 15–44 years2. The disproportionately high injury death rate in low-income countries is due to many factors, one of which is timely access to trauma services. In addition to timely medical care, trauma hospitals provide a source for data on the trends and characteristics of injuries, which can be used to support and focus prevention efforts.
For the first time in The Gambia, this study identifies predictors of discharge and disability status among patients treated in two Emergency Departments using information from the first hospital registries established in the country. Prior to this study, there was incomplete documentation for trauma cases, and the magnitude and determinants of injuries were largely unknown. In order to build a data infrastructure in the Gambia, the University of The Gambia, in partnership with the University of Iowa Injury Prevention Research Center, established trauma registries in the two major trauma hospitals.
The need for this data may be better understood with some information on the current trauma situation in The Gambia. The Gambia is a low income country whose development and health profiles resemble many other developing countries in West Africa (Table 1). The country’s health system includes a combination of eight government hospitals, seven public health clinics, and multiple NGO clinics.3,4,5 The majority of these services are focused in the urban Greater Banjul area, which includes five of the eight hospitals and more than 60% of the clinics.
Table 1.
Selected health indicators for Gambia, Ghana, low income country and WHO African Region
| Characteristics | Gambia | Ghana | Low income Country | WHO African Region |
|---|---|---|---|---|
| Total Population (in thousand)1 | 1,849 | 25,905 | 848,668 | 927,371 |
| Human Development Index Rank1 | 175 | 140 | N/A | N/A |
| Gross Domestic Product (GDP) Per Capita2 | 1,608 | 3,864 | 2,904 | N/A |
| Total annual expenditure on health as % of GDP (2012)2 | 6.2 | 5.2 | 5.1 | 5.6 |
| General Government Expenditure on health as % of total expenditure on health (2012)2 | 17.0 | 50.0 | 38.8 | 50.8 |
| Physician density per 10,000 population | 1.1 | 1.0 | 2.5 | 2.7 |
| Nurses and midwifery personnel per 10,000 population2 | 8.7 | 9.3 | 5.3 | 12.4 |
| Density of Health Infrastructure and Technology, Hospitals (per 100,000)2 | 0.7 | 1.4 | 0.8 | 0.8 |
| Life expectancy at birth, both sexes (2013)2 | 60 | 63 | 62 | 58 |
| Age standardized mortality rate, communicable diseases (per 100,000 population)2 | 590 | 476 | 502 | 683 |
| Age standardized mortality rate, non-communicable diseases (per 100,000 population)2 | 630 | 670 | 625 | 652 |
| Age standardized mortality rate, injuries diseases (per 100,000 population)2 | 96 | 76 | 104 | 116 |
| Years of life lost, communicable diseases (per 100,000 population)2 | 35,805 | 28,622 | 32,289 | 44,628 |
| Years of life lost, non-communicable diseases (per 100,000 population)2 | 11,970 | 12,863 | 11,333 | 12,045 |
| Years of life lost, injuries (per 100,000 population)2 | 5,295 | 4,004 | 5,520 | 6,480 |
Source: United Nations Development Programme Human Development Report, 2015.
Source: World Health Organization, World Health Statistics 2015.
Only two hospitals in the urban area have full capacity to treat complex trauma cases, and these two hospitals were included in our study. Edward Francis Small Teaching Hospital (EFSTH) is the largest hospital in The Gambia with a total bed capacity of 800, and serves as the teaching hospital and the main referral hospital for the entire country. Serrekunda General Hospital (SGH) is the newest referral hospital in The Gambia, commissioned in 2009, with a capacity of 200 beds. Together the two hospitals serve the routine health care needs of the Greater Banjul Area, the only urban area which holds 59% of the country’s population3. The hospitals also receive most of the complex trauma cases throughout the country. Hospitals do not have electronic medical records, and systematic trauma data is not collected.
Although surgery, for example, is a cost effective and often necessary trauma treatment approach, access to surgical services is limited in The Gambia, as in many other low income countries. In general, major gaps in the country’s surgical infrastructure include lack of access to clean water, electricity, oxygen, emergency and anesthesia equipment, as well as poorly staffed health facilities with limited provider skill sets to perform required surgical interventions3. Overall, the surgical capacity is limited and most complex trauma surgical cases are brought to the two major hospitals.3 Although public health centers in The Gambia do perform minor surgical interventions3, these procedures are often completed by surgical technicians, primary care doctors, and nurses. There is no pre-hospital care system in The Gambia. The referral system in the country is still based on the infectious disease model where ambulances are based in the healthcare facilities and their function is primarily inter-facility transfer from one level of health care to another. The country does not have a functional emergency number to call in case of a traumatic injury event. The Gambia Fire and Rescue Services do have some rescue mandate, but the public is not well aware of this function and the services are not utilized. These providers decide on the healthcare facility destination on their own, without information about treatment capacity or triage protocols. The implications are that many of the more seriously injured patients are not making to the definitive care hospital. Moreover, there are no emergency physicians or nurses for the entire country6.
The two study hospitals, Edward Francis Small Teaching Hospital and Serrekunda General Hospital, are the major trauma hospitals in The Gambia. Notwithstanding, their capacity to handle the volume of trauma patients is limited. Serrekunda General Hospital has two operating rooms and has equipment and expertise to support endotracheal intubation. However, there are no thoracotomy instruments, or chest tubes. The hospital has two general surgeons, no neurosurgeon or orthopedics specialists7. Patients with severe injuries needing specialty care (including neurological and orthopedic interventions) are transferred to Edward Francis Small Teaching Hospital. This hospital has six operating rooms with annual surgical admissions of about 50003, However, the lack of capacity to perform equipment-intensive procedures remains. This main referral and teaching hospital does not routinely have capacity for thoracotomies, endotracheal intubation, or chest tubes. In terms of human resources for trauma and surgical care, the hospital has ten general surgeons, one neurosurgeon, one anesthesiologist, 12 anesthesiological nurses, and two orthopedic specialists8.
The objective of this project was to establish trauma registries in two major trauma hospitals to demonstrate feasibility and to provide information on injury trends. The long-term goal of the project is to provide data that can be used to advocate for injury prevention and to inform policy and practice. This analysis examines the general characteristics of injured individuals and injury characteristics, and identifies factors associated with hospital admission and disability at discharge.
MATERIALS AND METHODS
The trauma registries included all trauma cases reported to the Accident and Emergency (A&E) Units in Edward Francis Small Teaching Hospital (EFSTH) and Serrekunda General Hospital. Among all trauma cases, 742 were admitted, 136 either died before arrival in the emergency room (n=118) or died at the emergency (n=18). Five hundred and twenty-five trauma patients were transferred for more service, of which 516 were patients transferred from SGH to EFSTH, and six from EFSTH to overseas treatment.
In this study, we used data from the trauma registries between March 1 and August 8, 2014 (n=1,961). Records missing information concerning age, gender, injury mechanism, and disposition from emergency room (2.9% of the total) were considered incomplete and excluded. Those who died at the scene were not in the sampling frame of this study. After removing duplicate records, our sample was 1,905 trauma cases. A probabilistic record linkage program, Link Plus (U.S. Center for Disease Control and Prevention (CDC), Cancer Division, V2.0), was used to identify duplicates9.
At intake, the treating physician completed the Accident and Emergency Ward Injury Study Form, which was developed with input from the participating hospitals. The form had 17 items that described the injured individual and characteristics of the injury. Data were collected based on emergency room visits in the emergency department. Information was recorded on a paper form and retrieved at the hospital site twice a week by the study coordinator. Data was entered into an Access database by the study coordinator, who then conducted a quality review and followed up to complete missing variables.
We focused on nine variables in our analysis: age, gender, place of occurrence, injury intent, mechanism of injury, primary nature of injury, primary body part injured, admission status, and disability. Based on the age distribution and objective to examine the entire lifespan, we collapsed age into three categories: 18 and younger (42.9%), 19 – 44 (48%), and 45 and older (9%). Discharge status and disability at discharge were outcome variables. Discharge status was categorized as patients who were admitted for further treatment and those who were discharged. Admitted included patients admitted to the hospital, transferred to another hospital for admission, and those who died. Non-admitted patients included those who were sent home from the Emergency Unit with or without documented procedures.
Disability was assessed upon discharge from the emergency department and included minor, moderate, and severe disability designated as either temporary or permanent. Disability status was assigned based on the diagnosis, patient’s subjective complaints, and perception of limitation to function in performance of routine activities at discharge from emergency room. Information used to assess disability status by the treating physician included mental and physical status. Although Glasgow Coma Scores are not routinely recorded, the elements are used by physicians to guide diagnosis and treatment decisions and thus physicians were instructed to use altered cognitive status in their assessment. Other categories used by the treating physicians in estimating the disability of injured patients were amputation of one or more limbs; damage to internal organs; estimated time for the patient to return to usual daily activities; loss of function; and dependence on caregiver at discharge from emergency room. Among mentally alert patients, their subjective complaints and perceptions of limitations to function in performance of routine activities at discharge from the emergency room was considered, as was their perception on ability to return to work and/or resume to previous functions. Based on these criteria, the treating physician categorized disability to be none, minor, moderate, and severe designated as temporary or permanent. Since a valid scale was not used as the basis for this designation, we collapsed responses into some level of disability versus no level of disability.
Distributions of the primary injury variables were examined by age and gender categories to identify general characteristics and trends and evaluated for differences using chi-square tests. Logistic models were used to identify the association of demographic and injury characteristics using discharge status (admitted vs. discharged). All six covariates were examined for inclusion in the logistic model using a forward selection method with a specified level of entry set at p< 0.15. All analyses were performed using SAS 9.4 (SAS Institute, Inc., Cary, NC, USA).
Ethics
Ethical approval was obtained from the joint Gambia Government and Medical Research Council Ethics Committee, and the University of Iowa Institutional Review Board. Data collection exercise was done in accordance to the Helsinki Declaration. A written consent was obtained from the patients or their escorts for the publication of the research results.
RESULTS
As shown in Figure 1 (and Table 2), road traffic was the most common injury mechanism, with 44.8% being adults. Home was the most common location for injury (36.5%) followed by roadway injuries (33.2%). The proportion of road injuries by gender was similar across all ages (p > 0.05). Notwithstanding, the number of unintentional injuries was only 2.2 times higher than assault injuries among young adults, but 11 and 4.6 times higher among children and adults respectively. Unlike other age groups, the proportion of assault injuries among young adult females (35.9%) were higher than those of males (29.7%).
Figure 1.
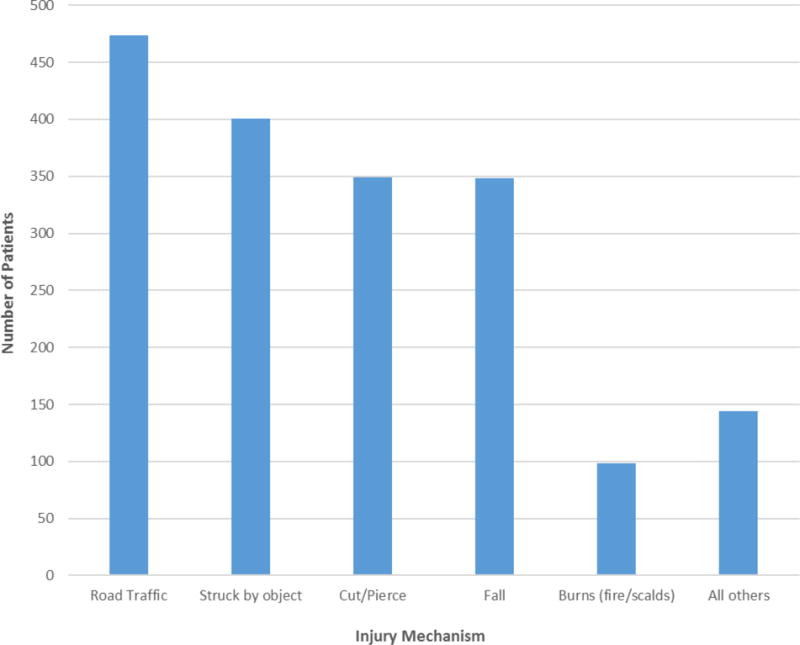
Number of Injured Patients by Injury Mechanism, 2015
Table 2.
Injury event factors by age (years) and gender
| Factors | Overall Total3 | < 193,5,6 | 19–443,5,6 | 45+3,6 | ||||||||||||||||
|---|---|---|---|---|---|---|---|---|---|---|---|---|---|---|---|---|---|---|---|---|
|
| ||||||||||||||||||||
| Male (n=560) | Female (n=232) | Total (n=792) | Male (n=698) | Female (n=187) | Total (n=885) | Male (n=122) | Female (n=44) | Total (n=166) | ||||||||||||
|
| ||||||||||||||||||||
| N | (%) | N | (%) | N | (%) | N | (%) | N | (%) | N | (%) | N | (%) | N | (%) | N | (%) | N | (%) | |
| Mechanism of Injury4 | ||||||||||||||||||||
| Road traffic | 474 | (26.1) | 106 | (19.1) | 55 | (24.1) | 161 | (20.5) | 186 | (27.2) | 54 | (29.7) | 240 | (27.7) | 52 | (43.7) | 21 | (47.7) | 73 | (44.8) |
| Struck by object | 401 | (22.1) | 99 | (17.8) | 20 | (8.8) | 119 | (15.2) | 211 | (30.8) | 46 | (25.3) | 257 | (29.6) | 19 | (16.0) | 6 | (13.6) | 25 | (15.3) |
| Cut/pierce | 349 | (19.2) | 105 | (18.9) | 42 | (18.4) | 147 | (18.8) | 152 | (22.2) | 31 | (17.0) | 183 | (21.1) | 14 | (11.8) | 5 | (11.4) | 19 | (11.7) |
| Fall | 348 | (19.2) | 162 | (29.1) | 53 | (23.2) | 215 | (27.4) | 79 | (11.5) | 25 | (13.7) | 104 | (12.0) | 21 | (17.6) | 8 | (18.2) | 29 | (17.8) |
| Fire/scald (Burns) | 98 | (5.4) | 32 | (5.8) | 40 | (17.5) | 72 | (9.2) | 12 | (1.8) | 11 | (6.0) | 23 | (2.7) | 1 | (0.8) | 2 | (4.5) | 3 | (1.8) |
| All others1 | 144 | (7.9) | 52 | (9.4) | 18 | (7.9) | 70 | (9.0) | 45 | (6.6) | 15 | (8.2) | 60 | (6.9) | 12 | (10.0) | 2 | (4.6) | 14 | (8.6) |
| Place of Occurrence4 | ||||||||||||||||||||
| Home and home property | 670 | (36.5) | 267 | (47.9) | 133 | (57.3) | 400 | (50.7) | 150 | (21.6) | 84 | (44.9) | 234 | (26.5) | 18 | (14.8) | 18 | (40.9) | 36 | (21.7) |
| Road | 610 | (33.2) | 150 | (26.9) | 63 | (27.2) | 213 | (27.0) | 243 | (34.9) | 75 | (40.1) | 318 | (36.0) | 57 | (46.7) | 22 | (50.0) | 79 | (47.6) |
| Patient’s worksite | 204 | (11.1) | 24 | (4.3) | 1 | (0.4) | 25 | (3.2) | 144 | (20.7) | 7 | (3.7) | 151 | (17.1) | 27 | (22.1) | 1 | (2.3) | 28 | (16.9) |
| Public space | 192 | (10.4) | 45 | (8.1) | 10 | (4.3) | 55 | (7.0) | 106 | (15.2) | 16 | (8.6) | 122 | (13.8) | 12 | (9.8) | 3 | (6.8) | 15 | (9.0) |
| All others2 | 162 | (8.7) | 71 | (12.7) | 25 | (10.7) | 96 | (12.1) | 53 | (7.7) | 5 | (2.6) | 58 | (6.6) | 8 | (6.4) | 0 | (0.0) | 8 | (4.8) |
| Intent4 | ||||||||||||||||||||
| Unintentional | 1444 | (79.5) | 498 | (90.4) | 211 | (93.4) | 709 | (91.2) | 484 | (70.0) | 118 | (64.1) | 602 | (68.8) | 98 | (80.3) | 35 | (83.3) | 133 | (81.1) |
| Assault | 364 | (20.0) | 51 | (9.3) | 13 | (5.8) | 64 | (8.2) | 205 | (29.7) | 66 | (35.9) | 271 | (31.0) | 22 | (18.0) | 7 | (16.7) | 29 | (17.7) |
| Self-harm | 3 | (0.2) | 1 | (0.2) | 0 | (0.0) | 1 | (0.1) | 1 | (0.1) | 0 | (0.0) | 1 | (0.1) | 1 | (0.8) | 0 | (0.0) | 1 | (0.6) |
| Unknown | 5 | (0.3) | 1 | (0.2) | 2 | (0.9) | 3 | (0.4) | 1 | (0.1) | 0 | (0.0) | 1 | (0.1) | 1 | (0.8) | 0 | (0.0) | 1 | (0.6) |
All other mechanisms include: Machinery, animal attacks, sports, poisoning, gunshot, and other
All other places include: Education facility, sports/athletics area, business/commercial, farm (excl. home), and other specified/unspecified place
%’s based on column totals
Totals do not add up to 1,905 due to missing age, gender, and factors
Mechanism of injury (p < 0.05)
Place of occurrence (p < 0.05)
More than half (52%) of injured victims treated at the emergency departments of the two study hospitals were either upper extremity or lower extremity/pelvis/hip injuries (Table 3). About one-third were treated for head/skull and face/neck injuries. The number of males treated for both upper and lower extremity injuries were two to four fold higher than their female counterparts across age groups. However, only 7.6% were treated for fractures, while the majority of injured victims (76.4%) were treated for soft tissue injuries. The proportion of concussion/brain injuries was higher in females than males in all age groups.
Table 3.
Injury type/region by age (years) and gender
| < 192,5 | 19–442,5 | 45+2 | ||||||||||||||||||
|---|---|---|---|---|---|---|---|---|---|---|---|---|---|---|---|---|---|---|---|---|
|
| ||||||||||||||||||||
| Overall Total2 | Male (n=560) | Female (n=232) |
Total (n=792) | Male (n=698) |
Female (n=187) |
Total (n=885) |
Male (n=122) |
Female (n=44) |
Total (n=166) |
|||||||||||
|
| ||||||||||||||||||||
| N | (%) | N | (%) | N | (%) | N | (%) | N | (%) | N | (%) | N | (%) | N | (%) | N | (%) | N | (%) | |
| Primary Body Part Injured3 | ||||||||||||||||||||
| Upper extremity | 486 | (26.6) | 125 | (22.6) | 53 | (22.8) | 178 | (22.6) | 214 | (30.9) | 54 | (29.2) | 268 | (30.5) | 29 | (24.2) | 11 | (25.0) | 40 | (24.4) |
| Lower extremity/Pelvis/Hip | 474 | (25.9) | 149 | (26.9) | 64 | (27.6) | 213 | (27.1) | 152 | (21.9) | 49 | (26.4) | 201 | (22.9) | 47 | (39.2) | 13 | (29.6) | 60 | (36.6) |
| Head/skull | 427 | (23.3) | 149 | (26.9) | 49 | (21.1) | 198 | (25.2) | 164 | (23.7) | 32 | (17.3) | 196 | (22.3) | 23 | (19.2) | 10 | (22.7) | 33 | (20.1) |
| Face/Neck | 246 | (13.5) | 80 | (14.4) | 27 | (11.6) | 107 | (13.6) | 96 | (13.9) | 27 | (14.6) | 123 | (14.0) | 10 | (8.3) | 6 | (13.6) | 16 | (9.8) |
| Thoracic area/lumbar spine | 87 | (4.8) | 18 | (3.2) | 14 | (6.0) | 32 | (4.1) | 38 | (5.5) | 8 | (4.3) | 46 | (5.2) | 8 | (6.7) | 1 | (2.3) | 9 | (5.5) |
| Multiple body parts | 51 | (2.8) | 11 | (2.0) | 11 | (4.7) | 22 | (2.8) | 15 | (2.2) | 10 | (5.4) | 25 | (2.8) | 2 | (1.7) | 2 | (4.5) | 4 | (2.4) |
| Abdominal area | 30 | (1.6) | 13 | (2.3) | 6 | (2.6) | 19 | (2.4) | 7 | (1.0) | 3 | (1.6) | 10 | (1.1) | 1 | (0.8) | 0 | (0.0) | 1 | (0.6) |
| Other/Unknown | 27 | (1.5) | 9 | (1.6) | 8 | (3.4) | 17 | (2.2) | 7 | (1.0) | 2 | (1.1) | 9 | (1.0) | 0 | (0.0) | 1 | (2.3) | 1 | (0.6) |
| Primary Nature of Injury3 | ||||||||||||||||||||
| Soft tissue(Open wound/abrasion/contusion) | 1400 | (76.4) | 419 | (75.6) | 151 | (65.1) | 570 | (72.5) | 573 | (82.3) | 143 | (77.3) | 716 | (81.3) | 86 | (71.1) | 28 | (63.6) | 114 | (69.1) |
| Fracture | 140 | (7.6) | 54 | (9.7) | 14 | (6.0) | 68 | (8.7) | 40 | (5.7) | 5 | (2.7) | 45 | (5.1) | 21 | (17.4) | 6 | (13.6) | 27 | (16.4) |
| Dislocation/sprain/strain/muscle/tendon/bv/nerves | 84 | (4.6) | 15 | (2.7) | 12 | (5.1) | 27 | (3.4) | 36 | (5.2) | 8 | (4.3) | 44 | (5.0) | 10 | (8.3) | 3 | (6.8) | 13 | (7.8) |
| Burns/scalds | 79 | (4.3) | 26 | (4.7) | 30 | (12.9) | 56 | (7.1) | 12 | (1.7) | 9 | (4.9) | 21 | (2.4) | 0 | (0.0) | 2 | (4.5) | 2 | (1.2) |
| Concussion/brain injury | 32 | (1.7) | 13 | (2.3) | 8 | (3.4) | 21 | (2.7) | 5 | (0.7) | 5 | (2.7) | 10 | (1.1) | 0 | (0.0) | 1 | (2.3) | 1 | (0.6) |
| Severe large system injuries4 | 24 | (1.3) | 8 | (1.4) | 4 | (1.7) | 12 | (1.6) | 10 | (1.4) | 1 | (0.5) | 11 | (1.2) | 1 | (0.8) | 0 | (0.0) | 1 | (0.6) |
| Other/Unknown1 | 73 | (4.0) | 19 | (3.5) | 13 | (5.6) | 32 | (4.1) | 20 | (2.9) | 14 | (7.5) | 34 | (3.9) | 3 | (2.5) | 4 | (9.1) | 7 | (4.2) |
Other/Unknown includes: poisoning, foreign body, and other/unknown
%’s based on column totals
Totals do not add up to 1,905 due to missing age, gender, and factors
Severe large system injuries include: crush, amputation, internal organ, suffocation, and multiple injuries
Primary nature of injury (p < 0.05)
Disability was assessed in all patients treated at the emergency room of the two hospitals. Four hundred and fifteen (415, 22.3%) of the patients had some form of disability of which 26 (6.3%) were coded as permanent and 389 (93.7%) were coded as temporary (Table 4). Since disability codes were not validated, we combined all levels of assessed disability into one category. More than three-quarters of those categorized by the treating physician as having some level of disability had either soft tissue injuries (50.2%) or fractures (26.1%). Three-forth of all disability associated-injuries were as a result of road traffic (43.7%), and injuries that occurred at home or by home properties (31.6%).
Table 4.
Injury factors by levels of disability
| Factors | No Disability | Disability (Any level) | ||
|---|---|---|---|---|
|
| ||||
| N | (%) | N | (%) | |
| Age (years) | ||||
| < 19 | 609 | (42.4) | 180 | (44.2) |
| 19–44 | 712 | (49.6) | 176 | (43.2) |
| 45+ | 114 | (7.9) | 51 | (12.5) |
| Gender | ||||
| Female | 369 | (26.2) | 93 | (23.0) |
| Male | 1042 | (73.8) | 312 | (77.0) |
| Primary nature of injury | ||||
| Soft tissue | 1209 | (84.1) | 208 | (50.2) |
| Burns/scalds | 54 | (3.8) | 27 | (6.5) |
| Concussion/Brain injury | 9 | (0.6) | 18 | (4.3) |
| Fracture | 35 | (2.4) | 108 | (26.1) |
| Severe large system injuries3 | 13 | (0.9) | 5 | (1.2) |
| Other/Unknown4 | 69 | (4.8) | 5 | (1.2) |
| Disloc/sprain/strain/muscle/tendon/bv/nerves | 48 | (3.3) | 43 | (10.4) |
| Mechanism of injury | ||||
| Struck by object | 368 | (25.8) | 44 | (10.9) |
| All others5 | 113 | (7.9) | 32 | (7.9) |
| Fall | 249 | (17.5) | 102 | (25.2) |
| Fire/scald (Burns) | 70 | (4.9) | 31 | (7.7) |
| Road traffic | 308 | (21.6) | 156 | (38.6) |
| Cut/Pierce | 316 | (22.2) | 39 | (9.7) |
| Place of occurrence | ||||
| Home/Home property | 548 | (38.1) | 131 | (31.6) |
| All others6 | 128 | (8.9) | 40 | (9.7) |
| Patients worksite | 170 | (11.8) | 38 | (9.2) |
| Road | 423 | (29.4) | 181 | (43.7) |
| Public space | 171 | (11.9) | 24 | (5.8) |
| Primary body region | ||||
| Upper extremity | 402 | (28.0) | 96 | (23.2) |
| Head/Skull | 340 | (23.7) | 75 | (18.2) |
| Lower extremity/Pelvis/Hip | 347 | (24.2) | 142 | (34.4) |
| Multiple body parts | 33 | (2.3) | 12 | (2.9) |
| Other/Unknown7 | 42 | (2.9) | 14 | (3.4) |
| Thoracic area/Lumbar spine | 62 | (4.3) | 23 | (5.6) |
| Face/Neck | 208 | (14.5) | 51 | (12.3) |
150 observations were deleted due to missing values for the response or explanatory variables; n=1755)
Significant at the p < 0.05 level
Severe large system injuries include: crush, amputation, internal organ, suffocation, and multiple injuries
Other/Unknown includes: poisoning, foreign body, and other/unknown
All other mechanisms include: Machinery, animal attacks, sports, poisoning, gunshot, and other
All other places include: Education facility, sports/athletics area, business/commercial, farm (excl. home), and other specified/unspecified place
Other/Unknown includes abdominal region
Overall, 44% of patients required further care (Table 5). Victims who were admitted, transferred, or died were more likely to be male (aOR=1.48, 95% CI=1.2–1.9), had experienced a concussion/brain injury (aOR=13.8, 95% CI=4.1–46.2) or fracture/dislocation (aOR=9.1, 95% CI=5.6–15.0) (compared to soft tissue injuries), sustained a fire/scald (burn) injury (aOR=4.5, 95% CI=1.7–11.5) (compared to struck by object), or injured in the thoracic area/lumbar spine (aOR=2.6, 95% CI=1.5–4.4), multiple body parts (aOR=2.4, 95% CI=1.1–5.3), and head/skull (aOR=1.9, 95% CI=1.4–2.6) (vs. upper extremity injuries) than those discharged to their home.
Table 5.
Multivariate logistic regression model predicting disposition1
| Factors | Sent Home | Admitted/Transferred/Died | 95% CI | |||
|---|---|---|---|---|---|---|
|
| ||||||
| N | (%) | N | (%) | aOR | ||
|
|
||||||
| Age (years) | ||||||
| < 19 | 422 | (40.8) | 374 | (45.9) | 1.00 | Ref |
| 19–44 | 531 | (51.4) | 357 | (43.9) | 0.92 | 0.73 – 1.16 |
| 45+ | 81 | (7.8) | 83 | (10.2) | 1.20 | 0.81 – 1.78 |
| Gender | ||||||
| Female | 275 | (27.1) | 185 | (22.9) | 1.00 | Ref |
| Male | 741 | (72.9) | 624 | (77.1) | 1.48 | 1.15 - 1.912 |
| Primary nature of injury | ||||||
| Soft tissue | 895 | (86.4) | 517 | (62.7) | 1.00 | Ref |
| Burns/scalds | 23 | (2.2) | 59 | (7.2) | 1.44 | 0.53 – 3.92 |
| Concussion/Brain injury | 3 | (0.3) | 30 | (3.6) | 13.76 | 4.09 – 46.242 |
| Fracture | 22 | (2.1) | 122 | (14.8) | 9.14 | 5.55 – 15.042 |
| Severe large system injuries3 | 6 | (0.6) | 18 | (2.2) | 2.52 | 0.86 – 7.34 |
| Other/Unknown4 | 54 | (5.2) | 21 | (2.5) | 0.37 | 0.19 – 0.702 |
| Disloc/sprain/strain/muscle/tendon/bv/nerves | 33 | (3.2) | 57 | (6.9) | 3.46 | 2.12 – 5.662 |
| Mechanism of injury | ||||||
| Struck by object | 258 | (25.2) | 148 | (18.2) | 1.00 | Ref |
| All others5 | 77 | (7.5) | 67 | (8.3) | 1.54 | 1.00 – 2.382 |
| Fall | 185 | (18.0) | 165 | (20.3) | 1.15 | 0.82 – 1.61 |
| Fire/scald(Burns) | 28 | (2.7) | 74 | (9.1) | 4.48 | 1.74 – 11.542 |
| Road traffic | 240 | (23.4) | 242 | (29.8) | 1.20 | 0.77 – 1.87 |
| Cut/Pierce | 237 | (23.1) | 116 | (14.3) | 1.17 | 0.84 – 1.65 |
| Place of occurrence | ||||||
| Home/Home property | 384 | (37.0) | 293 | (35.5) | 1.00 | Ref |
| All others6 | 84 | (8.1) | 83 | (10.0) | 1.35 | 0.91 – 2.00 |
| Patients worksite | 131 | (12.6) | 75 | (9.1) | 0.90 | 0.61 – 1.31 |
| Road | 319 | (30.8) | 300 | (36.3) | 1.20 | 0.77 – 1.87 |
| Public space | 119 | (11.5) | 75 | (9.1) | 1.06 | 0.73 – 1.55 |
| Primary body region | ||||||
| Upper extremity | 315 | (30.4) | 176 | (21.5) | 1.00 | Ref |
| Head/Skull | 225 | (21.7) | 206 | (25.1) | 1.90 | 1.39 – 2.592 |
| Lower extremity/Pelvis/Hip | 262 | (25.3) | 222 | (27.1) | 1.16 | 0.86 – 1.55 |
| Multiple body parts | 19 | (1.8) | 31 | (3.8) | 2.40 | 1.08 – 5.342 |
| Other/Unknown7 | 21 | (2.0) | 35 | (4.3) | 4.63 | 2.28 – 9.422 |
| Thoracic area/Lumbar spine | 32 | (3.1) | 56 | (6.8) | 2.56 | 1.50 – 4.382 |
| Face/Neck | 162 | (15.6) | 94 | (11.5) | 1.17 | 0.82 – 1.68 |
144 observations were deleted due to missing values for the response or explanatory variables; n=1761)
Significant at the p < 0.05 level
Severe large system injuries include: crush, amputation, internal organ, suffocation, and multiple injuries
Other/Unknown includes: poisoning, foreign body, and other/unknown
All other mechanisms include: machinery, animal attacks, sports, poisoning, gunshot, and other
All other places include: education facility, sports/athletics area, business/commercial, farm (excl. home), and other specified/unspecified place
Other/Unknown includes abdominal region
DISCUSSION
Our findings suggest that almost three-quarters of injuries reported to the study hospital occurred among men. This is consistent with similar studies in Ghana, Cameroon, and Kenya10–12. Gender differences in developing countries are important in road traffic safety because they may be markers for differences in how men and women interact with the roadway environment. As transportation infrastructures grow, for example, men may be more likely to drive automobiles, either industrial or personal, while women may comprise an increasing proportion of pedestrians, who are among the most vulnerable road users.
Male were more frequently admitted or transferred than females. The association was stronger among those diagnosed with concussion/brain injury (vs. soft tissue) and/or injured in the thoracic area/lumbar spine, or with injury to multiple body parts (vs. upper extremity). In a retrospective study of severity of head and neck injuries in Qatar, Bener et al. found head and neck injuries were 6.1 times higher in males than females13. Furthermore, these injuries were 50% more likely to be seen in male adults (45+ years) than male children, which is consistent with findings from similar studies in Sri Lanka14.
Males were more likely to be assessed with some level of disability than females. Disability tended to be highest among male adults (45+ years) with a fracture or concussion/brain injury, injured from fire/scalds, road traffic or from a fall. Loss of function due to bone or joint deformity will likely lead to prolonged periods of immobility or reduced function, which can affect the ability to perform daily activities of living or work duties. Injuries that permanently affect mobility, such as severe fractures and amputations, and injuries that affect neurological status, such as brain or spinal cord injuries, are likely to result in permanent disability.
The findings suggest that in The Gambia, domestic violent make up 20% of injury events. More than one-third (36.5%) of victims treated for injuries were incidents that occurred at home or by home properties and most of them were children and women. Moreover, young adult females had more assault related injuries than their male counterparts. These findings are consistent with a study on wife beating among men in six sub-Saharan African countries15. This study suggests that younger men may be more likely than older men to have attitudes that are supportive of wife beating. Contrary to our findings, similar studies have found that assault victimization is higher among men16,17. In those studies, however, the presence of alcohol or being injured in a public space were found to be factors associated with both assault and self-harm. Domestic violence can be associated with long-term negative effects such as psychological and cognitive problems, and as well as severe brain injury17. Efforts to better understand the dynamics of intimate partner violence can help inform primary prevention campaigns to change cultural norms about domestic violence.
One study limitation is that the study hospitals are located in urban Gambia and do not treat all injuries in the country. Thus, our study is not population based and thus we did not calculate injury rates. Since our sampling was based in two hospitals, our study population does not include individuals who died at the scene. However, injuries that require advanced care are likely to be treated in one of the two study hospitals, and thus our sample represents the more severe spectrum of injuries. Additionally, our study collected hospital data for only five months, due to limited funding. One of our primary outcomes of interest was disability status, which was coded subjectively by the treating physicians. Since a validated scale was not used, we combined disability status into binary variables (some vs. none). Additionally, injury groups (for instance concussion vs brain injuries) likely differ in severity. These pathological differences may introduce bias in the findings. Due to resource and personnel limitations in these busy emergency departments, as well as the lack of an electronic medical record system, we were unable to collect variables such as the Injury Severity Score or clinical indicators. Despite these limitations, this paper provides essential information that government authorities in The Gambia and collaborators need to table the need to improve injury prevention.
CONCLUSIONS
In The Gambia, like other low income countries, men 19–44 years and 45+ years constitute majority of workforce that drive the economy, education, health and other sectors of the country’s development aspirations, like The Gambia’s vision 2020. However, considering this result, men will become more of a liability to national economies, and most importantly time and resources of the spouse/family to care of them, as government does not yet have the facilities to care for such individuals. Trauma response system is non-existence in The Gambia. Coupled with shortages in physical and human resources, these double challenges are likely to negatively influence injury outcomes in The Gambia.
Our study also suggests that violent activities against women and children are eminent in homes in The Gambia. Since our data is from a hospital trauma registry, we did not have details on the determinants of such violence. Our findings are in accord with recent global discussions led by the World Health Organization and the United Nations that recognize that violence against women and children in low income countries hinders progress to achieving development targets.
This paper presents the magnitude and variety of factors associated with trauma in The Gambia. The Gambia has a poorly developed public health infrastructures, and has not prioritized injury prevention as a public health problem. To improve the current state of affairs, formal trauma registries to identify the burden of injuries, their causes as well as field research on consequences is critically needed in order to establish the evidence base necessary for effective intervention and prevention programs.
Acknowledgments
The authors thank Hon. Netty Baldeh of the National Assembly of The Gambia, and Dr. Ousman Nyan and Dr. Rex A. Kuye of the School of Medicine and Allied Health Sciences The University of The Gambia for their valuable guidance and championing the establishment of the registry.
Funding
This work was supported by World Bank Global Road Safety Facility grant to the Road Traffic Injury Research Network (RTIRN), the CDC/NCIPC-funded Injury Prevention Research Center (NCIPC R49CE002108) and the NIH/Fogarty-funded International Trauma and Injury Prevention Training Program (NIH 5D43TW007261). None of the sponsors were involved in the study design; collection, analysis and interpretation of data; writing of the manuscript; and the decision to submit the manuscript for publication.
Footnotes
Publisher's Disclaimer: This is a PDF file of an unedited manuscript that has been accepted for publication. As a service to our customers we are providing this early version of the manuscript. The manuscript will undergo copyediting, typesetting, and review of the resulting proof before it is published in its final citable form. Please note that during the production process errors may be discovered which could affect the content, and all legal disclaimers that apply to the journal pertain.
Conflict of Interest
All the authors of this manuscript have no competing interest.
References
- 1.Krug E. Road Traffic Injuries: Magnitude of the problem. Secondary Road Traffic Injuries: Magnitude of the problem. 2004 http://www.who.int/world-health-day/previous/2004/en/traffic_facts_en.pdf.
- 2.World Health Organization. Global status report on road safety 2013: Supporting a decade of action. Secondary Global status report on road safety2013: Supporting a decade of action. 2013 http://www.who.int/violence_injury_prevention/road_safety_status/2013/en/
- 3.Iddriss A, Shivute N, Bickler S, Cole-Cessay R, Jargo B, Abdullah F, Cherian M. Emergency, anaesthetic and essential surgical capacity in the Gambia. World Health Organization Bulletin. 2011 doi: 10.2471/BLT.11.086892. [DOI] [PMC free article] [PubMed] [Google Scholar]
- 4.Government of The Gambia. Service Statistics Report 2014. 2015 [Google Scholar]
- 5.Gambia Bureau of Statistics. The Gambia 2013 Population and Housing Census Preliminary Results. Secondary The Gambia 2013 Population and Housing Census Preliminary Results. 2015 http://www.gbos.gov.gm/uploads/census/The Gambia Population and Housing Census 2013 Provisional Report.pdf.
- 6.World Health Organization. Global Status Report on Road Safety 2013. World Health Organization; 2013. [Google Scholar]
- 7.Serrekunda General Hospital. Annual Report. 2015 [Google Scholar]
- 8.Edward Francis Small Teaching Hospital. Annual Report. 2015 [Google Scholar]
- 9.Center for Disease Control and Prevention. Link Plus Version 2.0. Secondary Link Plus Version 2.0. 2007 http://www.cdc.gov/cancer/npcr/tools/registryplus/lp_features.htm.
- 10.Mock CN, B E, Acheampong F, Adjei S. Long-term injury related disability in Ghana. 2003 doi: 10.1080/0963828031000090524. published Online First: Epub Date. [DOI] [PubMed] [Google Scholar]
- 11.Juillard CJ, Stevens KA, Monono ME, et al. Analysis of Prospective Trauma Registry Data in Francophone Africa: A Pilot Study from Cameroon. World Journal of Surgery. 2014;38(10):2534–42. doi: 10.1007/s00268-014-2604-1. published Online First: Epub Date. [DOI] [PubMed] [Google Scholar]
- 12.Saidi H, Mutiso BK, Ogengo J. Mortality after road traffic crashes in a system with limited trauma data capability. Journal of trauma management & outcomes. 2014;8(1):4–4. doi: 10.1186/1752-2897-8-4. published Online First: Epub Date. [DOI] [PMC free article] [PubMed] [Google Scholar]
- 13.Bener A, Rahman YSA, Mitra B. Incidence and severity of head and neck injuries in victims of road traffic crashes: In an economically developed country. International emergency nursing. 2009;17(1):52–9. doi: 10.1016/j.ienj.2008.07.007. published Online First: Epub Date. [DOI] [PubMed] [Google Scholar]
- 14.Edirisinghe PAS, Kitulwatte IDG, Senarathne UD. Injuries in the vulnerable road user fatalities; a study from Sri Lanka. Journal of Forensic and Legal Medicine. 2014;27:9–12. doi: 10.1016/j.jflm.2014.07.002. published Online First: Epub Date. [DOI] [PubMed] [Google Scholar]
- 15.Rani M, Bonu S, Diop-Sidibe N. An empirical investigation of attitudes towards wife-beating among men and women in seven sub-Saharan African countries. African journal of reproductive health. 2004;8(3):116–36. doi: 10.2307/3583398. published Online First: Epub Date. [DOI] [PubMed] [Google Scholar]
- 16.Gal M, Rus D, Peek-Asa C, et al. Epidemiology of assault and self-harm injuries treated in a large Romanian Emergency Department. European Journal of Emergency Medicine. 2012;19(3):146–52. doi: 10.1097/MEJ.0b013e32834ada2e. published Online First: Epub Date. [DOI] [PMC free article] [PubMed] [Google Scholar]
- 17.Ribeiro WS, Mari JdJ, Quintana MI, et al. The Impact of Epidemic Violence on the Prevalence of Psychiatric Disorders in Sao Paulo and Rio de Janeiro, Brazil. Plos One. 2013;8(5) doi: 10.1371/journal.pone.0063545. published Online First: Epub Date. [DOI] [PMC free article] [PubMed] [Google Scholar]