ABSTRACT
The final step of lysis in phage λ infections of Escherichia coli is mediated by the spanins Rz and Rz1. These proteins form a complex that bridges the cell envelope and that has been proposed to cause fusion of the inner and outer membranes. Accordingly, mutations that block spanin function are found within coiled-coil domains and the proline-rich region, motifs essential in other fusion systems. To gain insight into spanin function, pseudorevertant alleles that restored plaque formation for lysis-defective mutants of Rz and Rz1 were selected. Most second-site suppressors clustered within a coiled-coil domain of Rz near the outer leaflet of the cytoplasmic membrane and were not allele specific. Suppressors largely encoded polar insertions within the hydrophobic core of the coiled-coil interface. Such suppressor changes resulted in decreased proteolytic stability of the Rz double mutants in vivo. Unlike the wild type, in which lysis occurs while the cells retain a rod shape, revertant alleles with second-site suppressor mutations supported lysis events that were preceded by spherical cell formation. This suggests that destabilization of the membrane-proximal coiled coil restores function for defective spanin alleles by increasing the conformational freedom of the complex at the cost of its normal, all-or-nothing functionality.
IMPORTANCE Caudovirales encode cell envelope-spanning proteins called spanins, which are thought to fuse the inner and outer membranes during phage lysis. Recent genetic analysis identified the functional domains of the lambda spanins, which are similar to class I viral fusion proteins. While the pre- and postfusion structures of model fusion systems have been well characterized, the intermediate structure(s) formed during the fusion reaction remains elusive. Genetic analysis would be expected to identify functional connections between intermediates. Since most membrane fusion systems are not genetically tractable, only few such investigations have been reported. Here, we report a suppressor analysis of lambda spanin function. To our knowledge this is the first suppression analysis of a class I-like complex and also the first such analysis of a prokaryote membrane fusion system.
KEYWORDS: Escherichia coli, bacteriophage lysis, coiled coil, membrane fusion, phage
INTRODUCTION
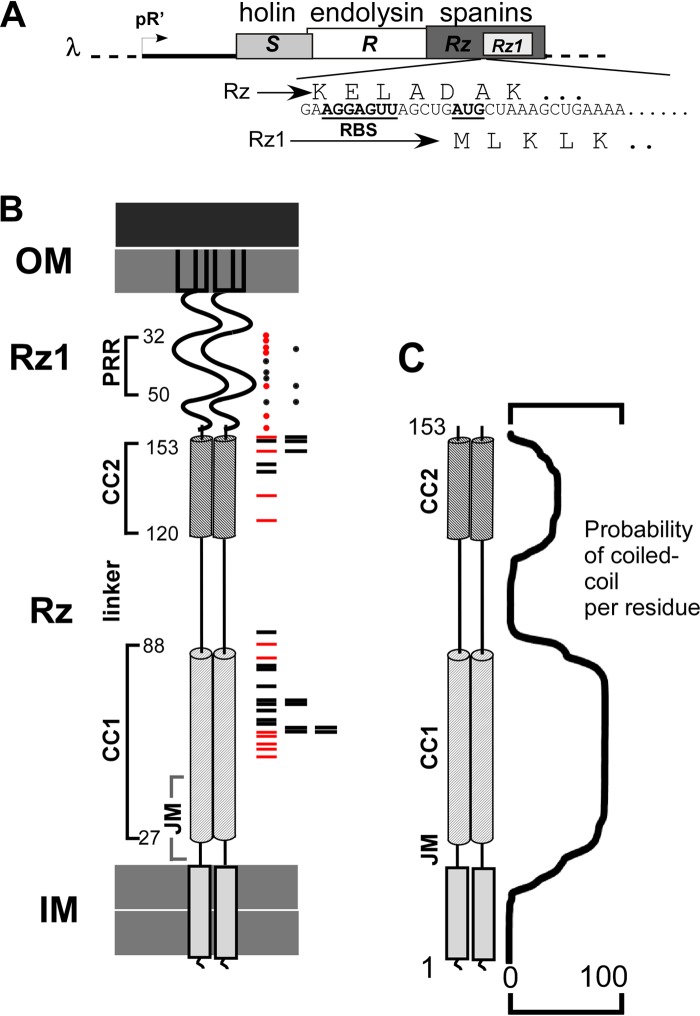
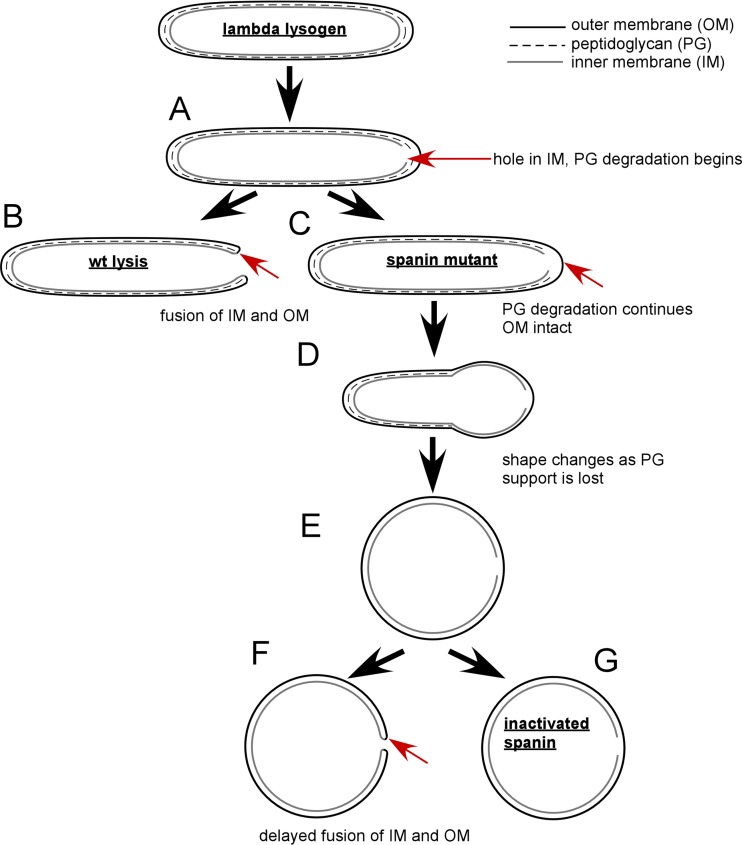
Lysis is essential for the release of tailed phage progeny (1). Like other double-stranded DNA (dsDNA) phages of Gram-negative hosts, phage λ produces lysis proteins targeting each major component of the cell envelope (2). Phage λ lysis genes are transcribed from the late promoter pR′ (Fig. 1) from approximately 8 min after induction, and lysis proteins accumulate throughout the morphogenesis period (3, 4). At a genetically programmed time, holins undergo rapid oligomerization in the inner membrane (IM), forming a micrometer-scale hole (1, 5). This allows endolysin to enter the periplasm and degrade peptidoglycan (PG). The final step of lysis is outer membrane (OM) disruption by the spanins, composed of subunits Rz and Rz1. When lysis is monitored on a single-cell level, rod-shape morphology is at least transiently maintained when cellular contents are released explosively (Fig. 2A and B) (6). This indicates that the OM is disrupted before complete PG degradation. Inactivating either Rz or Rz1 arrests lysis at a spherical-cell stage when the OM is still intact (Fig. 2C to E and G) (6, 7). The spanin complex is a heterotetramer composed of Rz and Rz1 dimers that span the periplasm (hence, the name spanin) and link the IM and OM (8, 9). Both subunit dimers are covalently linked by intermolecular disulfide bonds, two in Rz and one in Rz1 (8). The IM subunit Rz has a periplasmic domain consisting of two coiled-coil (CC) helices and forms a complex with OM lipoprotein Rz1 via C terminus-C terminus interactions (Fig. 1B) (10). Based on similarities to class I viral fusion proteins, it was suggested that spanins function at the final stage of lysis by fusing the IM and OM (9). This was supported by experiments demonstrating spanin-mediated fusion of Escherichia coli spheroplasts (11).
FIG 1.
Features of λ spanins. (A) The lysis cassette is shown. Lysis genes S (holin), R (endolysin), and Rz/Rz1 (the spanins) are under the control of the late promoter pR′. Rz1 is embedded in the +1 reading frame of Rz. The underlined nucleotides denote the ribosome binding site (RBS) and the start codon of Rz1. The translated products of Rz and Rz1 are shown above and below the nucleotide sequence, respectively. (B) A cartoon of spanin complex is shown within the cell envelope. The outer membrane (OM), inner membrane (IM), and predicted structural features of Rz and Rz1 are denoted on the left side of the cartoon. The relative positions of single missense mutations that inactivate Rz are represented by red and black rectangles on the right side of the cartoon. Red rectangles represent the relative positions of single missense mutations that were used in the suppressor screen. The relative positions of single missense mutations that inactivate Rz1 are represented by red and black circles on the right side of the cartoon. Red circles represent the relative positions of single missense mutations that were used in the suppressor screen. (C) A cartoon of Rz is shown with the percent probability of a coiled coil per residue, as predicted by MARCOIL, to the right of the cartoon.
FIG 2.
Model comparing wild-type to spanin mutant lysis. (A) The first step of lysis is holin-mediated hole formation in the IM. After IM permeabilization, the endolysin degrades its substrate, PG. (B) In wild-type (wt) phage λ, lysis occurs from the poles before loss of the rod shape. Lysis is complete after OM disruption. The arrow indicates the putative spanin-mediated fusion of the IM and OM. (C) In the case of spanin mutants, the OM remains intact (marked by the arrow) as the PG is degraded. (D) As PG degradation continues, cell shape is lost. (E) The cell assumes a spherical shape after complete PG degradation. (F) Lysis mediated by kinetically defective spanins occurs from a spherical cell. The arrow indicates the site of putative OM-IM fusion. (G) The terminal morphological phenotype of cells carrying nonfunctional spanins.
Recent genetic analysis identified mutants that inactivated Rz or Rz1 (12). Mutations clustered within the predicted coiled-coil helices (CC1 and CC2) of Rz and the proline-rich region (PRR) of Rz1, suggesting that these are essential to spanin function (Fig. 1B). Coiled coils and proline-rich regions are essential domains in other well-described fusion systems (13). The majority of such mutations did not block accumulation of gene products or complex formation between Rz and Rz1. This suggests that loss of spanin function occurs at a later step, i.e., during the putative fusion reaction.
Suppression analysis would be expected to identify interacting domains within the spanin complex. However, Rz1 is wholly embedded within the +1 reading frame of Rz (Fig. 1A); therefore, genetic analysis required the construction of a disembedded gene architecture. Here, tandem Rz-Rz1 genes are constructed and used to search for intragenic and extragenic suppressors of spanin defects. The results are discussed in terms of a detailed model for spanin function.
RESULTS
Separation of spanin genes does not change expression or lysis.
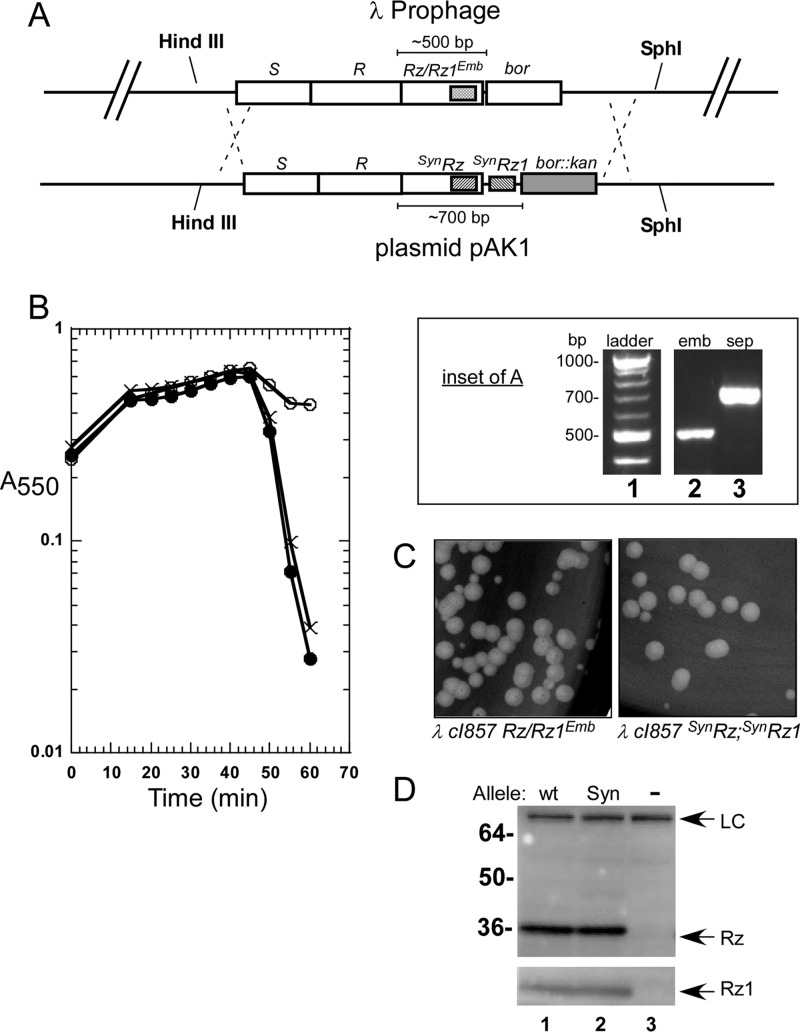
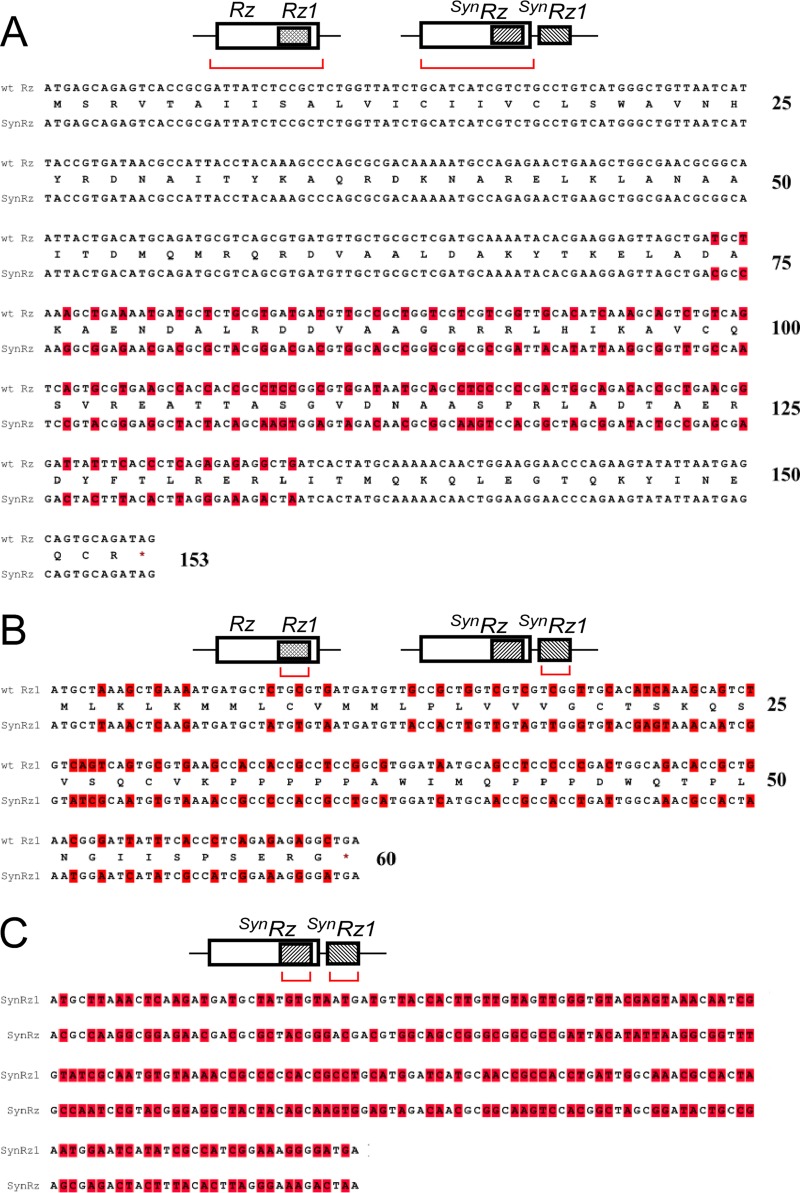
In wild-type phage λ, Rz1 is entirely embedded within the +1 reading frame of Rz, making genetic analysis of either gene problematic. To address this, λ phages were constructed with the Rz1 gene downstream of Rz (Fig. 3). Moreover, to prevent the separated genes from undergoing recombination within the shared sequence, the nucleotide sequences of Rz and Rz1 were altered to be distinct without changing the amino acid sequence encoded by either gene (Fig. 4). In this arrangement, the DNA sequence of the separated Rz1 gene is 36% identical to the region of Rz that formerly housed Rz1. Phages carrying separated spanin genes were indistinguishable from the parental phages in terms of the rate of lysis (see Materials and Methods) (Fig. 3B), plaque size (Fig. 3C), and protein levels (Fig. 3D). This suggests that the embedded gene architecture reflects evolutionary pressures to save genomic space.
FIG 3.
Construction of phages carrying separated spanin genes. (A) The plasmid pAK1 was used to recombine the synthetic, separated Rz and Rz1 genes into phage lambda. The desired recombinants carry the separated Rz and Rz1 genes along with the bor::kan marker. A DNA gel (inset) shows the replacement of the wild-type embedded spanins with the synthetic separated spanin genes. An empty well between lanes 1 and 2 was cut from the image and replaced by a vertical white line. (B) Lysis profile demonstrating the lytic phenotype of phages that carry separated spanins. The following lysogens were induced at time 0 and monitored at A550: ×, MDS12 (λ900); open circles, MDS12 (λ900 Rzam Rz1am); filled circles, MDS12 (λ910), which carries the separated spanin genes. (C) Comparison of λ900 and λ910 plaques. (D) Western blots comparing Rz and Rz1 expressed from embedded (wild type; wt) and synthetic (Syn) gene arrangements. −, expression from λ900 Rzam Rz1am. Arrows indicate the positions of the Rz and Rz1 bands. LC, loading control (a nonspecific band detected by the Rz antibody).
FIG 4.
Comparison of embedded and synthetic spanin DNA sequences. A cartoon of wild-type and synthetic spanin gene arrangements is shown at the top of each panel, and red brackets indicate the genes compared in each panel. In each case, the amino acid sequences of synthetic and wild-type genes are the same. (A) Comparison of Rz and SynRz. The nucleotides that differ between Rz and SynRz are highlighted. (B) Comparison of Rz1 and SynRz1. The nucleotides that differ between Rz1 and SynRz1 are highlighted. (C) Comparison of SynRz and SynRz1. The region of SynRz that was codon optimized to be distinct from SynRz1 is shown. The nucleotides that differ between SynRz and SynRz1 are highlighted.
Spanin-defective λ phages can be differentiated from wild-type λ phages by plaque assay.
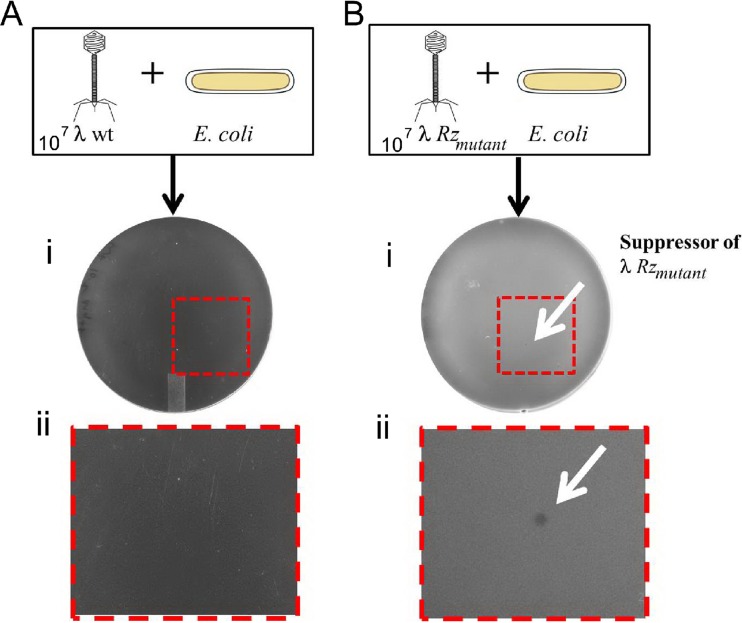
For unknown reasons, Rz and Rz1 lysis-defective alleles do not have a strong plating phenotype unless the agar is supplemented with millimolar concentrations of divalent cations. In medium supplemented with 50 mM MgCl2, the parental λ910 formed a clear plaque approximately 6 h after incubation. Conversely, no plaques are formed by isogenic missense or nonsense mutants of Rz or Rz1 under these conditions. To exploit this plating defect for the isolation of suppressor mutations, phages that carried defective spanin mutant alleles were constructed. Spontaneous revertants were selected after 6 h of incubation. The frequency of reversion ranged from 10−6 to 10−7 revertant mutations per total parental phage population (Fig. 5Bi and ii).
FIG 5.
Suppressors are selected by early plaque formation in medium supplemented with magnesium. (A) Frame i shows confluent lysis after plating ∼107 PFU of λ910 phage. The boxed region is magnified in frame ii. (B) Frame i shows plating of ∼107 PFU of λ910 Rz mutant phage. Plaque formation due to spontaneous pseudoreversion of an Rz mutation is indicated by the white arrow. The boxed region is magnified in frame ii.
Revertants of spanin mutants.
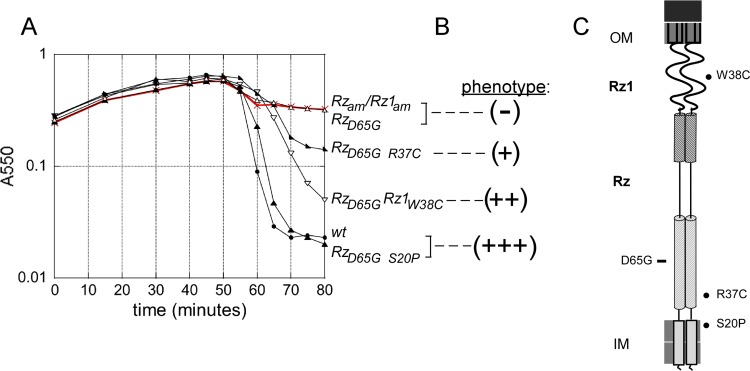
After purification, the Rz-Rz1 genes of the plaque-forming phage isolates were sequenced, resulting in the identification of 41 revertant alleles, comprised of 30 for Rz and 11 for Rz1 (Table 1). Every revertant isolate had either same-site (true revertant) or second-site single nucleotide changes within the spanin genes, suggesting that additional mutations outside the spanin genes were unlikely. For clarity within this report, second-site suppressors represent changes outside the parental codon. For example, Rz encoding the S-to-P change at position 20 (RzS20P) is a second-site suppressor of the parental RzY147H. However, a second-site change within the parental codon (the RzR143L revertant of parental RzG143R) is referred to here as an intracodon revertant. The majority (14) were second-site suppressors, consistent with the rate of pseudorevertants observed in other phage systems (15). Lysogens were created to test whether second-site pseudorevertant alleles support lysis in liquid medium. In order to avoid recombination between phage λ and other prophages within the E. coli genome, the prophage-free strain MDS12 was used as a host (16). Of the 33 lysogens carrying pseudorevertant alleles, 19 exhibited lysis indistinguishable from that of the parental strain, and 14 lysed at a lower rate (Table 2). In general, the lytic phenotype of the pseudorevertant alleles of Rz1 mutations was similar to that of the wild type. Fourteen pseudorevertant alleles of Rz or Rz1 mutations lysed at a lower rate. Of these 14, 8 had a lysis rate that was 5 to 15 min slower than that of the wild type. The remaining six had a more severe delay in lysis (Table 2). Examples of lysis phenotypes are shown in Fig. 6.
TABLE 1.
Suppressors of Rz and Rz1 mutants
| Protein | Inactivating mutationa |
Suppressor mutationa |
||
|---|---|---|---|---|
| Amino acid change | Codon change | Amino acid change | Codon change | |
| Rz | V61A | GTT → GCT | A30T | GCC → ACC |
| Y33C | TAC → TGC | |||
| R37C | CGC → TGC | |||
| A47S | GCG » TCG | |||
| L64H | CTC » CAC | S20P | TCA → CCA | |
| D38G | GAC → GGC | |||
| H64L | CAC » CTC | |||
| D65G | GAT → GGT | S20P | TCA → CCA | |
| A22D | GCT » GAT | |||
| R27L | CGT » CTT | |||
| A30V | GCC → GTC | |||
| R37C | CGC → TGC | |||
| Rz1 W38C | TGG » TGT | |||
| Rz1 W38S | TGG » TCG | |||
| Rz1 I39F | ATC » TTC | |||
| L72F | TTA » TTC | F72L | TTC » TTA | |
| V86G | GTG » GGG | R37C | CGC → TGC | |
| A47E | GCG » GAG | |||
| L93S | TTA → TCA | Y26C | TAC → TGC | |
| A30T | GCC → ACC | |||
| L44M | ATG » CTG | |||
| S93L | TCA → TTA | |||
| Rz1 P56T | CCA » ACA | |||
| G143R | GGA » CGA | R143L | CGA » CTA | |
| Y147H | TAT → CAT | S20P | TCA → CCA | |
| Y33C | TAC → TGC | |||
| Q36K | CAG » AAG | |||
| L44M | ATG » CTG | |||
| Q151R | CAG → CGG | S20P | TCA → CCA | |
| Y26S | TAC » TCC | |||
| Rz1 | P33L | CCC → CTC | Rz Q36R | CAG → CGG |
| P35H | CCG » CAC | Rz A30V | GCC → GTC | |
| Rz Y33H | TAC → CAC | |||
| Rz R37C | CGC → TGC | |||
| Rz R37H | CGC → CAC | |||
| W46R | TGG → AGA | R46I | AGA » ATA | |
| R46G | AGA → GGA | |||
| L50P | CTA → CCA | P50L | CCA → CTA | |
| I54N | ATA » AAC | P56L | CGC → CAC | |
| Rz R37C | CGC → TGC | |||
| Rz R37H | CGC → CAC | |||
Inactivating mutations used for the suppressor screen are indicated along with corresponding codon changes. Suppressors are grouped according to parental inactivating mutant. Arrows indicate transversions, and double greater-than (≫) signs indicate transitions.
TABLE 2.
Second-site suppressors of Rz and Rz1a
| Protein and mutation | Suppressor | Phenotype of lysisb |
|---|---|---|
| Rz | ||
| V61A | A30T | +++ |
| Y33C | +++ | |
| A47S | +++ | |
| L64H | S20P | +++ |
| D38G | ++ | |
| D65G | S20P | +++ |
| A22D | + | |
| R27L | ++ | |
| A30V | + | |
| R37C | + | |
| Rz1 W38C | ++ | |
| Rz1 W38S | ++ | |
| Rz1 I39F | +++ | |
| V86G | R37C | ++ |
| A47E | +++ | |
| L93S | Y26C | ++ |
| A30T | + | |
| L44M | + | |
| Rz1 P56T | ++ | |
| Y147H | S20P | +++ |
| Y33C | +++ | |
| Q36K | +++ | |
| L44M | +++ | |
| Q151R | S20P | +++ |
| Y26S | +++ | |
| Rz1 | ||
| P33L | Rz Q36R | +++ |
| P35H | Rz A30V | +++ |
| Rz Y33H | +++ | |
| Rz R37C | +++ | |
| Rz R37H | +++ | |
| I54N | Rz R37C | + |
| Rz R37H | ++ | |
| P56L | +++ |
List of inactivating mutations and compensatory second-site mutations.
Symbols for lysis in liquid medium are as follows: +++, suppressors that lysed as rapidly as the wild type; ++, suppressors that lysed with a 5- to 15-min delay; +, lytic cultures with a pronounced delay in lysis.
FIG 6.
Subset of lysis profile data used to assess lysis phenotype. (A) The following MDS12 lysogens were induced at time 0 and monitored at A550: Rzam Rz1am (red), λ900 Rzam Rz1am; RzD65G, λ910 RzD65G; RzD65G R37C, λ910 RzD65G, R37C; RzD65G Rz1W38C, λ910 RzD65G Rz1W38C, RzD65G S20P, λ910 RzD65G, S20P; wt, λ910. (B) Categorization of lytic phenotype is denoted with respect to the lysis profile traces. (C) Cartoon of the spanin complex within the cell envelope. The relative position of the inactivating RzD65G mutation is marked with a rectangle to the left of the cartoon. At right are shown the relative positions of suppressors generated from RzD65G, marked with a filled circle.
Alleles with severe accumulation defects require intracodon revertant mutations.
Seven intracodonic revertants were isolated, including true revertants of RzL64H, RzL72F, RzL93S, and Rz1L50P. Two positions generated intracodon changes: RzG143R to Leu and Rz1W46R to Gly and Ile. In both of these cases, a mutation involving a substitution with a basic residue was corrected by restoration of an uncharged residue within the same codon. A simple explanation for such revertants is that the original inactivating substitution conferred a high degree of proteolytic instability to the allele product. This instability may be due to a defect in formation of a secondary or tertiary structure. Supporting this idea, RzL72F and RzG143R have been shown to be severely defective in accumulation (12). RzL72F and RzG143R affect the a and c positions of coiled coils within CC1 and CC2 (Fig. 1B), respectively, indicating that the stable coiled coil is critical to avoid periplasmic proteolysis of the Rz subunit.
Second-site suppressors cluster at the JM region of Rz.
Out of 33 second-site suppressors, 28 were within the juxtamembrane (JM) region (residues 20 to 47) of Rz (Table 2). The clustering of suppressor mutations is interesting because they were generated from absolutely lysis-defective alleles carrying single missense mutations scattered throughout the spanin genes (Fig. 1B). Seven missense changes (S20P, A30T, A30V, Y33H, R37C, R37H, and L44M) were found as suppressors of multiple alleles; e.g., RzY33H suppresses RzV61A, RzY147H, and Rz1P35H (Table 2). Additionally, changes at four positions were able to suppress multiple mutants despite the different chemical properties of the suppressing residue; e.g., RzR37C suppresses RzV86G, Rz1P35H, and Rz1I54N, and RzR37H suppresses Rz1P35H and Rz1I54N (Table 2).
The lack of allele specificity suggests that the majority of suppressors are not interaction suppressors (17).
Lysis by revertant alleles is preceded by a spherical-cell morphology.
By phase-contrast video microscopy, striking kinetic defects can be readily observed at the single-cell level for spanin alleles that are normal in terms of bulk lysis and plaque formation (8). In the wild-type context, lysis is complete within a few seconds, whereas cells expressing spanin mutant alleles form a spherical intermediate prior to lysis (Fig. 2C to F). In such cases lysis is delayed for more than 10 min (8).
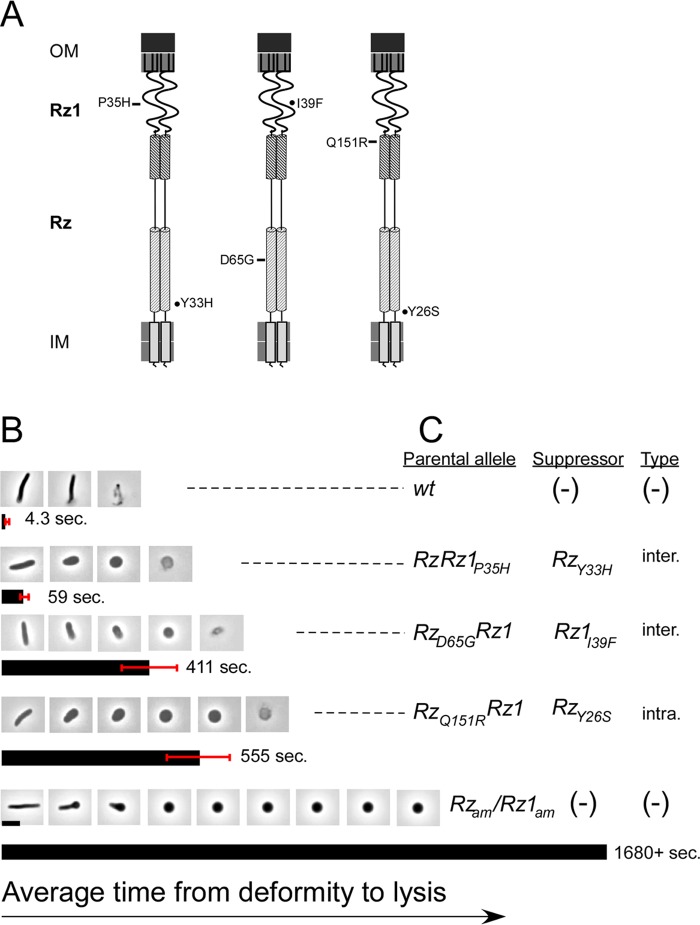
It was not known if suppressors restore the normal kinetics of morphological change, i.e., with or without forming the spherical intermediate. To address this, single-cell lysis events were monitored from the time of deformity (indicating the start of lysis) to overt cell breach (loss of refractility). Three revertant alleles were selected as exemplars, the RzY33H suppressor of Rz1P35H, the Rz1I39F suppressor of RzD65G, and the RzY26S suppressor of RzQ151R, all of which exhibit normal lysis in bulk culture. In each case, suppressor-mediated lysis was delayed and progressed through a spherical-cell morphology before lysis. The extent of the delay varied between alleles; for example, the suppressor of Rz1P35H lysed within ∼60 s, whereas the suppressors of RzD65G and RzQ151R were slower to lyse (Fig. 7). Formation of a spherical intermediate prior to lysis indicates that suppressors are functioning after complete PG degradation. This is in contrast to wild-type lysis, in which spanin function occurs when the cell is rod shaped and thus when the PG is largely intact (Fig. 2A and B and 7B). The delayed lysis of this subset of suppressors implies that the majority also function after PG degradation. At a molecular level, this suggests that spanin complexes are free from PG confinement and are stalled at a fusion step.
FIG 7.
Suppressors exhibit kinetic and morphological defects in lysis. (A) Cartoon of the spanin complex within the cell envelope. Relative positions of inactivating mutations featured in panels B and Care indicated to the left of the complex by rectangles. Relative positions of the suppressor mutations generated from the parental mutant are indicated to the right of the cartoon by circles. (B) Lysis was monitored by measuring the time from deformity to lysis. Average time is indicated in seconds and represented by the bar below the micrographs. Red whiskers indicate the standard deviation for the sample. Time-lapse micrographs are representative of the lysis morphology observed in each set. (C) The parental allele, suppressor mutation (if present), and type are indicated. Inter, intergenic suppressor; Intra, intragenic suppressor. Scale bar, 5 μm.
Suppressors cluster within the core of the Rz coiled coil and reduce stability.
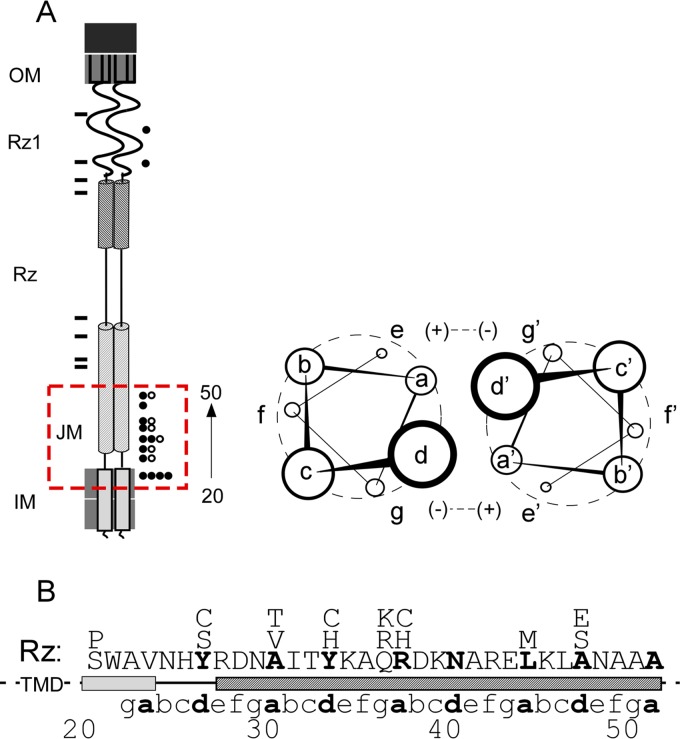
Most of the juxtamembrane suppressors, i.e., the suppressors near the membrane interface of Rz, were characterized by polar substitutions at positions a and d of the predicted Rz coiled coil (Fig. 8). The substitution of polar residues (including Cys) into the hydrophobic core of a dimeric coiled coil would be expected to reduce stability (18–20). Allele-specific proteolysis of Rz has been reported previously (8, 12), suggesting that perturbations in the juxtamembrane coil would be detectable by Western blotting.
FIG 8.
Suppressors cluster within the juxtamembrane region and target the core of the Rz coiled coil. (A) A cartoon of the spanin complex within the cell envelope is shown at left. Relative positions of inactivating mutations used in the suppressor screen are indicated to the left of the cartoon by rectangles. Relative positions of second-site suppressing changes with a wild-type lysis phenotype are indicated to the right of the cartoon by circles. Open circles indicate different suppressing alleles that fall within the same position (e.g., A30T and A30V). The dashed red box indicates the juxtamembrane (JM) region, approximately residues 20 to 50. The cartoon at right shows parallel coiled-coil helices oriented so that the viewer is looking down the helical barrels from the N terminus. Electrostatic attraction is shown between positions e and g (positive and negative signs); however, polar interaction is also supported in these positions. (B) The amino acid sequence of the JM region of Rz. Positions of suppressors that lysed bulk culture as rapidly as the wild type (Table 2) are indicated above the Rz JM sequence. The heptad repeats within Rz are aligned respective to MARCOIL predictions. Boldface letters indicate positions predicted to be within the hydrophobic core (positions a and d).
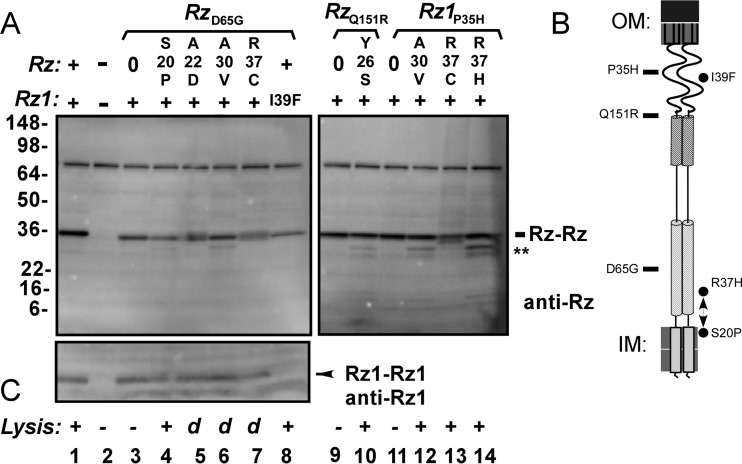
To investigate instability of Rz double mutants, parental mutants were selected from each spanin subdomain (RzD65G, RzQ151R, and Rz1P35H). In each case, the Rz product was decreased, or Rz-specific fragments were generated (Fig. 9). For Rz suppressors, densitometry of the ∼36-kDa species showed diminished accumulation compared to that of the parental mutant (Table 3). This supports the prediction that such suppressors are causing a local disruption in Rz structure within the juxtamembrane region. Furthermore, there was no correlation between these accumulation characteristics and the rate of lysis of bulk culture (Fig. 9, compare lysis conditions to band patterns).
FIG 9.
Suppression reduces Rz stability. Western blot of Rz and Rz1. MDS12 (λ900) and MDS12 (λ910) lysogens were thermally induced, and a 1-ml sample of cells was collected for TCA precipitation prior to lysis. (A) The presence of allele Rz or Rz1 is indicated above the blot. −, λ900 Rzam Rz1am. Mutant and suppressed spanin alleles are expressed from MDS12 (λ910) lysogens. Parental phages carrying mutants RzD65G, RzQ151R, and Rz1P35H, are bracketed, and suppressing alleles are indicated below each bracket. 0, samples collected from MDS12 (λ910) expressing the nonsuppressed (parental) allele. The position of the covalently linked Rz dimer is indicated by Rz-Rz. Double asterisks indicate apparent proteolytic products. SeeBlue Plus2 molecular markers in kilodaltons are indicated to the left. (B) Cartoon of the spanin complex within the cell envelope. Relative positions of inactivating mutations are indicated to the left of the cartoon by rectangles. Relative positions of suppressor mutations are indicated to the right of the cartoon by circles. (C) Lysis phenotype. +, wild-type lysis rate; d, delay in the rate of lysis (Table 2); −, a nonlytic phenotype.
TABLE 3.
Densitometry of the Rz Western blots
| Lanea | Samplea | Densityb |
|---|---|---|
| 1 | λ910 | 1 |
| 2 | λ900 Rzam Rz1am | 0.027 |
| 3 | λ910 RzD65G | 0.62 |
| 4 | λ910 RzD65G S20P | 0.31 |
| 5 | λ910 RzD65G A22D | 0.51 |
| 6 | λ910 RzD65G A30V | 0.51 |
| 7 | λ910 RzD65G R37C | 0.39 |
| 8 | λ910 RzD65G Rz1I39F | 0.34 |
| 9 | λ910 RzQ151R | 0.98 |
| 10 | λ910 RzQ151R Y26S | 0.82 |
| 11 | λ910 Rz1P35H | 1.0 |
| 12 | λ910 RzA30V Rz1P35H | 0.87 |
| 13 | λ910 RzR37C Rz1P35H | 0.85 |
| 14 | λ910 RzR37H Rz1P35H | 0.73 |
Lanes and samples are arranged corresponding to Fig. 9.
The density value of the band corresponding to the expected Rz molecular mass is reported. Each density measurement was normalized to that of the loading control. The highest value of each blot was set to 1. Density readings were proportionally scaled to this value.
The only nonjuxtamembrane suppressors that support rapid lysis of bulk culture were the intragenic Rz1P56L suppressor of Rz1I54N and the intergenic Rz1I39F suppressor of RzD65G (Table 2). For P56L, a compensatory change at this position may be easy to generate since the truncation of six residues (residues 55 to 60) from the C terminus of Rz1 does not block lysis (12). A simple explanation is that a polar substitution at position 54 is compensated by an increase in hydrophobicity at position 56, suggesting that a nonpolar character at the C terminus of Rz1 has a role in spanin function. Suppression of RzD65G by Rz1I39F confers proteolytic instability on the Rz product (Fig. 9, lanes 3 and 8; Table 3). The Rz1I39F product was not detected, but the significance of this is uncertain since the I39F substitution lies within the epitope region. The slight reduction in accumulation of RzD65G in the presence of Rz1I39F suggests that instability in Rz is introduced upon Rz-Rz1 binding. As in the case for Rz1I39F, the accumulation of Rz is reduced for other suppressors of D65G (Fig. 9, compare lane 8 to lanes 5 and 7; Table 3).
DISCUSSION
In this study, suppression analysis was used to gain insight regarding our operational model for spanin-mediated lysis, i.e., fusion of the IM and OM. Intragenic suppression analysis would be expected to yield three categories of second-site compensatory changes, altering protein interaction, amount, or activity (21). The goal of most suppression analyses is to isolate interaction suppressors aimed at gaining structural information, i.e., point-to-point contact between interaction sites or conformational states, based on allele-specific suppression analysis. This would offer a promising tool to probe intermediate steps inferred by pre- and postfusion structures. However, suppression analysis is rarely used to study membrane fusion due to the intractability of most model fusion systems to forward genetic analysis. An example of such analysis has been conducted on the alphavirus fusion protein. In this study, a variety of second-site revertants were isolated that rescue a mutation within the ij loop of E1, implying functional contacts during structural rearrangement (22, 23). To our knowledge, there have been no such investigations for class I viral fusion proteins.
Reversion analysis of spanins required the construction of phages carrying a separated gene arrangement so that Rz1 was not embedded within Rz (Fig. 3). In this synthetic arrangement, the Rz and Rz1 codons were altered to prevent recombination; however, the amino acid sequence of each gene was not changed (Fig. 4). Despite changes in the DNA sequence of each gene, there was no consequence to λ phages carrying the separated genes in terms of lysis phenotype or gene expression. This suggests that the embedded arrangement may improve fitness by other means, e.g., by saving genome space or preventing segregation of interacting domains. There are many examples of phages with separated spanin genes. Therefore, bioinformatic analysis might identify a correlation between larger genome size and separated spanin gene architecture.
Suppression analysis was conducted here with the goal of identifying contacts between Rz and Rz1 and subdomains. Such information could be used to construct a structural model to provide evidence for steps inferred from fusion systems, e.g., a hairpin conformational change. However, almost all suppressors were clustered in a coiled-coil domain near the outer leaflet of the IM (the juxtamembrane region). The pattern of suppression is striking, given that these changes compensate for inactivating mutations spanning all the subdomains of the spanin complex. Furthermore, many suppressors exhibit global suppression (i.e., suppressed mutations in multiple sites), which ruled out direct suppression (21). Within the juxtamembrane region, suppression resulted in mostly polar substitution within the hydrophobic core of a predicted coiled-coil domain, and in each case there is evidence of reduced stability of the Rz double mutants. The repeated isolation of suppressor mutations at S20, A30, and R37 suggests that these areas are more sensitive to destabilizing changes, such as to the hydrophobic core.
Suppressor mutation within the predicted TMD.
One of the most frequently isolated suppressors was S20P, which falls within the predicted transmembrane domain (TMD). Replacement of the native Rz TMD with an artificial TMD had no effect on Rz function, strongly indicating that the Rz TMD acts as a nonspecific membrane anchor (12). It has been demonstrated that proline introduces flexible kinks within TMDs (24, 25). In the context of Rz, flexibility within the TMD may cause improper registry between the dimeric Rz coils. Furthermore, the RzD65G S20P appears proteolytically unstable, like core-targeting suppressors (Fig. 9). This suggests that S20P suppresses in a manner similar to other juxtamembrane suppressors, presumably by altering the stability of the Rz juxtamembrane coiled coil.
Mutation within juxtamembrane segments of other fusion systems.
Taken together, these data suggest that disruptive changes in the juxtamembrane region of the proximal coiled-coil domain of Rz can suppress inactivating mutations that map essentially everywhere else in the spanin complex. Insight into the basis for the global effect of such suppressors can be gleaned from analysis of the membrane fusion proteins of eukaryotic viruses. For example, mutations near transmembrane-adjacent coiled coils of the paramyxovirus simian virus 5 (SV5) F protein resulted in destabilization along with hyperfusogenicity. It was suggested that destabilization decreased the energy required to engage a fusion-active conformational change (26, 27). Likewise, mutations within the coiled-coil domain of the F protein near the fusion peptide destabilized the coiled coil and enhanced fusion (28). The SNARE system has also been used to study the role of juxtamembrane composition. Fusion efficiency was increased by the insertion of two prolines into the juxtamembrane region of the v-SNARE, suggesting that release of a helical strain promotes fusion (29). In another study, the juxtamembrane region of the t-SNARE was reported to be a fusion switch, which was intrinsically unstable. It was suggested that this switch was activated upon conformational change while forming a helical structure via zippering (discussed below).
Suppression model: kinetic penalty for increased conformational freedom.
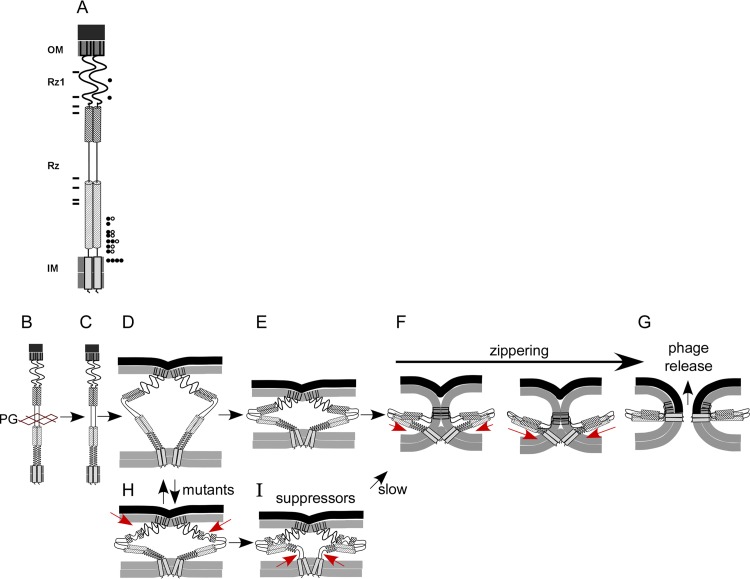
Although there is significant variety in the composition of membrane fusion systems, a consistent theme is that structural rearrangement of the protein complex pulls membranes together (30, 31). It has been suggested that the free energy associated with oligomerization and conformational change overcomes the electrostatic repulsion of apposing membranes. Mutants of Rz and Rz1 that inactivate spanin function without disrupting complex formation were suppressed by substitutions that confer proteolytic instability on Rz. Presumably, instability is caused by changes in the juxtamembrane region, especially the core of coiled-coil domains (Fig. 8). As with other membrane fusion systems, it has been suggested that the spanins assume a hairpin conformation that drives the merger of two membranes. For viral and SNARE system(s), a zippering model has been proposed to describe the progressive assembly of a helical coiled structure proceeding toward membrane anchors, a process that overcomes the energy barrier to fusion (14, 32, 33). If a majority of inactivating point mutants block lysis by disrupting the zippering reaction, it is tempting to speculate that suppression results in modification of the juxtamembrane coiled-coil structure that allows the zippering process to restart (Fig. 10). In this model, loss of structure within the juxtamembrane region increases the degrees of freedom sampled by Rz-Rz1 complexes once PG has been degraded. Therefore, mutations that stall zippering could be rescued by a decrease of restraint within the juxtamembrane coil structure (Fig. 10, compare panels D and E to panels H and I). Alternatively, suppression may increase membrane scaffolding interactions within the juxtamembrane region. There is a correlation between membrane curvature and formation of fusion intermediates (30). Therefore, structural interruptions that result in increased Rz-membrane contacts (by exposing hydrophobic or positively charged residues) would enhance the curvature required to facilitate membrane fusion. Future biochemical and structural studies will be required to test such models.
FIG 10.
Model of suppressor function. (A) Cartoon of the spanin complex within the cell envelope. Relative positions of inactivating mutations used in the suppressor screen are indicated to the left of the cartoon by rectangles. Relative positions of second-site suppressing changes with a wild-type lysis rate are indicated to the right of the cartoon by circles. Open circles indicate different suppressing alleles that fall within the same position (e.g., A30T and A30V). (B) Prior to lysis, the spanin complex accumulates, threaded within the lacunae of PG. (C) PG degradation results in spanin activation. (D) The spanin complex undergoes a collapsing conformational change. (E) The complex begins to fold into a hairpin structure (top). (F) The juxtamembrane region becomes structured as the complex zippers into a hairpin conformation (red arrows). (G) Phage release occurs upon fusion pore formation. (H) Mutations that encode defects in spanin structure prevent further structural rearrangement, and spanin function is halted. Red arrows indicate the possible disruption of spanin structure by an inactivating mutation. (I) Suppression restores function by increasing the flexibility within the juxtamembrane region (arrows). This allows the complex to resume hairpin formation.
MATERIALS AND METHODS
Bacterial growth.
Strains, plasmids, and primers used in this study are listed in Tables 4 and 5. Bacterial cultures were grown on Luria broth (LB) as described previously (12). Phage plating was done on tryptone broth (TB) agar plates with molten TB agar as described previously (7).
TABLE 4.
Phages, strains, plasmids, and used in this study
| Name | Genotype and relevant features | Reference or source |
|---|---|---|
| Bacteriophages | ||
| λ900 | λΔ(stf tfa)::cat cI857 bor::kan, carries Camr and Kanr; wild-type RzRz1 | 7 |
| λ900 Rzam Rz1am | λΔ(stf tfa)::cat cI857 RzQ100am Rz1W38am bor::kan | 7 |
| λ cI857 | λ cI857 SRRzRz1 | Laboratory stock |
| λ910 | λ cI857 bor::kan; synthetic alleles of Rz and Rz1 (SynRz SynRz1)a | This study |
| Strains | ||
| MDS12 | MG1655 with 12 deletions, totalling 376,180 nucleotides, including all cryptic prophages | 16 |
| RY17341 | MDS12 ΔfhuA | 36 |
| MDS12 (λ900) | RY17341 lysogenized with λ900 | This study |
| MDS12 (λ900 Rzam Rz1am) | RY17341 lysogenized with λ900 Rzam Rz1am | This study |
| MDS12 (λ910) | RY17341 lysogenized with λ910 | This study |
| BW25113 | E. coli Keio collection parental strain | 37 |
| BW25113 (λ cI857) | BW25113 lysogenized with λ cI857 | This study |
| Plasmids | ||
| pER157 | pBR322 Δtet (SRRzRz1 bor::kan) | 7 |
| pAK1 | pER157 with tandem synthetic Rz and Rz1 genes | This study |
The Rz1 gene is located downstream of Rz (GenBank accession number KY609225).
TABLE 5.
Primers used in this study
| Primera | Sequence (5′–3′) |
|---|---|
| pRz S20P FOR | TCTGCCTGCCATGGGCTGTTAATC |
| pRz S20P REV | GATTAACAGCCCATGGCAGGCAGA |
| pRz V61A FOR | TCAGCGTGATGCTGCTGCGCTCGATGC |
| pRz V61A REV | GCATCGAGCGCAGCAGCATCACGCTGA |
| pRz L64H FOR | TGTTGCTGCGCACGATGCAAAAT |
| pRz L64H REV | ATTTTGCATCGTGCGCAGCAACA |
| pRz D65G FOR | GCTGCGCTCGGTGCAAAATACAC |
| pRz D65G REV | GTGTATTTTGCACCGAGCGCAGC |
| pRz K70E FOR | GCAAAATACACGGAGGAGTTAGCTG |
| pRz K70E REV | CAGCTAACTCCTCCGTGTATTTTGC |
| pRz L72F FOR | ACGAAGGAGTTCGCTGACGCC |
| pRz L72F REV | GGCGTCAGCGAACTCCTTCGT |
| pRz V86G FOR | ACGGGACGACGGGGCAGCCGGG |
| pRz V86G REV | CCCGGCTGCCCCGTCGTCCCGT |
| pRz L93S FOR | GCGGCGCCGATCACATATTAAGG |
| pRz L93S REV | CCTTAATATGTGATCGGCGCCGC |
| pRz Y127N FOR | AGCGAGACAACTTTACACTTAGGGAAAG |
| pRz Y127N REV | TCCCTAAGTGTAAAGTTGTCTCGCTCGGC |
| pRz G143R FOR | ACAACTGGAACGAACCCAGAAGTAT |
| pRz G143R REV | ATACTTCTGGGTTCGTTCCAGTTGT |
| pRz Y147H FOR | AACCCAGAAGCATATTAATGAGC |
| pRz Y147H REV | GCTCATTAATATGCTTCTGGGTT |
| pRz Q151R FOR | ATTAATGAGCGGTGCAGATAG |
| pRz Q151R REV | CTATCTGCACCGCTCATTAAT |
| pRz1 P32Q FOR | CGTGAAGCAACCACCGCC |
| pRz1 P32Q REV | GGCGGTGGTTGCTTCACG |
| pRz1 P33L FOR | GTGAAGCCACTGCCGCCTCCGGCG |
| pRz1 P33L REV | CGCCGGAGGCGGCAGTGGCTTCAC |
| pRz1 P35H FOR | CCACCACCGCATCCGGCGTGG |
| pRz1 P35H REV | CCACGCCGGATGCGGTGGTGG |
| pRz1 P36Q FOR | CCACCACCGCCTCAGGCGTGGATAATG |
| pRz1 P36Q REV | CATTATCCACGCCTGAGGCGCTGGTGG |
| pRz1 W46R FOR | CCGCCACCTGATCGGCAAACGCCAC |
| pRz1 W46R REV | GTGGCGTTTGCCGATCAGGTGGCGG |
| pRz1 I54N FOR | CTAAATGGAATCAATTCGCCATCGGAAAG |
| pRz1 I54N REV | CTTTCCGATGGCGAATTGATTCCATTTAG |
| pAK Rz1 E58K SDM | CCACTAAATGGAATCATATCGCCATCGAAAAGGGGATGAAAGCTTGCCC |
| Supp Seq REV | GAAGCGCGTGTGTATTGCTCAC |
| Lbd R S121 FWD | CAGCAATATCTGGGCTTCACTGC |
| AphI kan REV | GCAGTTTCATTTGATGCTCGATGAGTTTTTC |
| RzRz1 Seq FOR | CAAAATTCAAAGAAGCGGGCGGAAC |
| pAK Rz R37C FOR | AAGCCAGTGCGACAAAAATGCC |
| pAK Rz R37C REV | GCATTTTTGTCGCACTGGGCTTTG |
FOR, forward; REV, reverse.
Synthesis of disembedded Rz and Rz1 genes.
To separate Rz1 from Rz on the phage λ chromosome, a plasmid (pAK1) was designed that carries synthetic Rz and Rz1 genes in tandem architecture (SynRz and SynRz1) upstream of a bor::kan insertion that is flanked by regions with homology to the phage λ chromosome (Fig. 3). Synthetic Rz and Rz1 genes were synthesized by Genewiz (South Plainfield, NJ). The synthetic sequences and comparisons to the parental Rz and Rz1 genes are provided in Fig. 4. The plasmid pAK1 carrying the synthetic disembedded genes was transformed into strain BW25113 (λ cI857) in which the prophage carries the native embedded RzRz1 arrangement. A Kanr transformant was grown at 30°C in LB medium and then thermally induced to generate a recombinant lysate (as described below). The desired recombinant phages have integrated the kanamycin resistance gene from the pAK1 plasmid along with the disembedded SynRz SynRz1 in place of the embedded RzRz1 (Fig. 3). The recombinant phage was captured by infecting the MDS12 host and selecting for Kanr lysogens as described below. Single lysogens were identified by screening lysogens using colony PCR (34), grown in LB, and thermally induced to generate a phage lysate (described in detail below). To prepare template for sequencing, primers 5′-CAGCAATATCTGGGCTTCACTGC-3′ and 5′-GCAGTTTCATTTGATGCTCGATGAGTTTTTC-3′ were used to amplify the spanin genes using 1 μl of lysate. The amplicons were purified using a QIAquick PCR purification kit (Qiagen) and sequenced at Eton Biosciences (San Diego, CA) using primers 5′-CAAAATTCAAAGAAGCGGGCGGAAC-3′ and 5′-GAAGCGCGTGTGTATTGCTCAC-3′. The final construct, designated λ910, carried the synthetic SynRz and SynRz1 spanin genes. As expected, it was indistinguishable from wild-type phage λ in terms of lysis and plaque formation and was used as the parental phage for the suppressor studies (Fig. 3B).
Identifying spanin mutants suitable for suppression analysis.
The pAK1 vector was used as the template for site-directed mutagenesis. The method described above was used to introduce spanin mutations into the prophage carrying the synthetic Rz and Rz1 architecture described above. Eighteen prophages isogenic to λ910 were generated; of these, 11 were Rz mutants (V61A, L64H, D65G, K70E, L72F, V86G, L93S, Y127N, G143R, Y147H, and Q151R) and 7 were Rz1 mutants (P32Q, P33L, P35H, P36Q, W46R, I54N, and E58K). Two Rz (K70E and Y127N) and three Rz1 (P32Q, P36Q, and E58K) alleles were not suitable for suppression analysis because the plating defect was too leaky; although these mutants block lysis of bulk culture, plating efficiency of these mutants at 6 h was indistinguishable from that of the wild-type phage λ for an unknown reason.
Isolation of plaque-forming pseudorevertants.
Phage plating was performed according to standard techniques with some exceptions (35). Briefly, a 100-μl aliquot of an overnight MDS12 culture was adjusted to 10 mM MgCl2 and mixed with 100 μl of a phage suspension at 108 PFU/ml. After 30 min of incubation at room temperature, this mixture was mixed with 4 ml of molten T-top agar supplemented with 50 mM MgCl2 and immediately poured on thick TB plates. Plates were inverted after 5 min and incubated at 37°C for 6 h.
Suppressor isolation and lysogen generation.
Three revertant plaques were screened per spanin mutant. Plaques were isolated by punching out single plaques using a Pasteur pipette and ejecting them into 200 μl of λ-dil (10 mM Tris-HCl [pH 7.4] 5 mM MgSO4, 0.2 M NaCl, 0.1% gelatin). This suspension was sterilized with 10 μl of chloroform, purified by replating twice, and used to infect MDS12 as described previously (35). Single lysogens that formed Kanr colonies after overnight incubation at 30°C were selected (described above). To sequence putative suppressors, 1 μl of the chloroform-treated phage suspension was used as the template for sequencing of the spanin genes (described above).
Lysis monitoring, phenotype assessment, and lysate collection.
Fresh overnight cultures from a lysogenic colony were diluted 1:200 in 25 ml of LB supplemented with 10 mM Mg++. This mixture was incubated at 30°C in a water bath shaker with the appropriate antibiotic. Lysis was monitored as described previously (6). At an A550 of ∼0.25, cultures were thermally induced by transfer to a 42°C bath for 15 min and then moved to 37°C for an additional 45 to 65 min. The phenotypes of lysogens carrying suppressor mutations were categorized by the rate of bulk culture lysis. In the case of wild-type phage λ, lysis occurs within 10 min of first drop in turbidity (A550). Suppressors that lysed as rapidly as the wild type were assigned a “+++” phenotype. The phenotype “++” was assigned to suppressors that lysed with a 5- to 15-min delay. Lytic cultures with a more pronounced delay in lysis were denoted by “+.” When applicable, 10 ml of lysate was collected in a 15-ml conical tube 65 min after induction. The lysate was sterilized by addition of chloroform to a final concentration of 1%. After a vortexing step for 15 s, the lysate was centrifuged for 10 min at 6,000 × g to pellet chloroform and cell debris. The sterilized supernatant was transferred to a 15-ml conical tube and stored at 4°C.
Evaluating lysis morphology using time-lapse phase-contrast microscopy.
Single-cell lysis was monitored by phase-contrast time-lapse microscopy, as described previously, with modifications (6). Briefly, a 1.5-μl sample was taken prior to lysis, applied to a glass microscope slide, covered with a 22- by 25-mm coverslip, and imaged immediately using a 10× (0.25 numerical aperture [NA]) phase-contrast objective on a Zeiss Axio Observer A1 microscope, with the stage preheated to 37°C. Images were captured every 250 ms for 28 min or until all cells within the field of view lysed. Time-lapse series were saved as MOV files rendered at 4 frames per s with a time stamp. To evaluate the lysis defect of spanin mutants, the time stamp was used as a reference to calculate the lysis kinetics of single cells by the difference in times between the first frame showing cell deformation to the first frame showing breach of cell envelope (loss of phase halo). Representative time-lapse images in Fig. 5 were captured with a 40× (0.75 NA) objective.
Sample collection for Western blotting.
A 1-ml aliquot of whole-cell sample was taken 45 min after induction, precipitated by trichloroacetic acid (TCA), and prepared for Western blotting as described previously (8, 10). Briefly, TCA pellets were resuspended in 1× SDS-PAGE sample loading buffer in a volume normalized to the A550 units recorded at the time of collection. Samples were boiled for 5 min before being resolved on a Novex Wedgewell 4 to 20% Tris-Glycine SDS-PAGE gel (Thermo Fisher). Western blotting with the Rz and Rz1 antibody was performed as previously described (9). Densitometry was performed with ImageJ. The loading control band and primary Rz band were used for area measurements. The reported values are normalized to those of the loading controls.
ACKNOWLEDGMENTS
This work was supported by Public Health Service grant GM27099, National Science Foundation Award number HRD-1304975, a Beckman Scholars Program Award from the Arnold and Mabel Beckman Foundation, and by the Center for Phage Technology at Texas A&M University, jointly sponsored by Texas AgriLife.
We thank Young lab members, past and present, for their valuable input during the course of this study.
REFERENCES
- 1.Young R. 1992. Bacteriophage lysis: mechanism and regulation. Microbiol Rev 56:430–481. [DOI] [PMC free article] [PubMed] [Google Scholar]
- 2.Young R. 2013. Phage lysis: do we have the hole story yet? Curr Opin Microbiol 16:790–797. doi: 10.1016/j.mib.2013.08.008. [DOI] [PMC free article] [PubMed] [Google Scholar]
- 3.Liu X, Jiang H, Gu Z, Roberts JW. 2013. High-resolution view of bacteriophage lambda gene expression by ribosome profiling. Proc Natl Acad Sci U S A 110:11928–11933. doi: 10.1073/pnas.1309739110. [DOI] [PMC free article] [PubMed] [Google Scholar]
- 4.Young R. 2014. Phage lysis: three steps, three choices, one outcome. J Microbiol 52:243–258. doi: 10.1007/s12275-014-4087-z. [DOI] [PMC free article] [PubMed] [Google Scholar]
- 5.Dewey JS, Savva CG, White RL, Vitha S, Holzenburg A, Young R. 2010. Micron-scale holes terminate the phage infection cycle. Proc Natl Acad Sci U S A 107:2219–2223. doi: 10.1073/pnas.0914030107. [DOI] [PMC free article] [PubMed] [Google Scholar]
- 6.Berry JD, Rajaure M, Pang T, Young R. 2012. The spanin complex is essential for lambda lysis. J Bacteriol 194:5667–5674. doi: 10.1128/JB.01245-12. [DOI] [PMC free article] [PubMed] [Google Scholar]
- 7.Zhang N, Young R. 1999. Complementation and characterization of the nested Rz and Rz1 reading frames in the genome of bacteriophage lambda. Mol Gen Genet 262:659–667. doi: 10.1007/s004380051128. [DOI] [PubMed] [Google Scholar]
- 8.Berry JD, Rajaure M, Young R. 2013. Spanin function requires subunit homodimerization through intermolecular disulfide bonds. Mol Microbiol 88:35–47. doi: 10.1111/mmi.12167. [DOI] [PMC free article] [PubMed] [Google Scholar]
- 9.Berry J, Summer EJ, Struck DK, Young R. 2008. The final step in the phage infection cycle: the Rz and Rz1 lysis proteins link the inner and outer membranes. Mol Microbiol 70:341–351. doi: 10.1111/j.1365-2958.2008.06408.x. [DOI] [PMC free article] [PubMed] [Google Scholar]
- 10.Berry J, Savva C, Holzenburg A, Young R. 2010. The lambda spanin components Rz and Rz1 undergo tertiary and quaternary rearrangements upon complex formation. Protein Sci 19:1967–1977. doi: 10.1002/pro.485. [DOI] [PMC free article] [PubMed] [Google Scholar]
- 11.Rajaure M, Berry J, Kongari R, Cahill J, Young R. 2015. Membrane fusion during phage lysis. Proc Natl Acad Sci U S A 112:5497–5502. doi: 10.1073/pnas.1420588112. [DOI] [PMC free article] [PubMed] [Google Scholar]
- 12.Cahill J, Rajaure M, O'Leary C, Sloan J, Marrufo A, Holt A, Kulkarni A, Hernandez O, Young R. 2016. Genetic analysis of the lambda spanins Rz and Rz1: identification of functional domains. G3 (Bethesda) 7:741–753. doi: 10.1534/g3.116.037192. [DOI] [PMC free article] [PubMed] [Google Scholar]
- 13.Podbilewicz B. 2014. Virus and cell fusion mechanisms. Annu Rev Cell Dev Biol 30:111–139. doi: 10.1146/annurev-cellbio-101512-122422. [DOI] [PubMed] [Google Scholar]
- 14.Pobbati AV, Stein A, Fasshauer D. 2006. N-to C-terminal SNARE complex assembly promotes rapid membrane fusion. Science 313:673–676. doi: 10.1126/science.1129486. [DOI] [PubMed] [Google Scholar]
- 15.Poon A, Chao L. 2005. The rate of compensatory mutation in the DNA bacteriophage ϕX174. Genetics 170:989–999. doi: 10.1534/genetics.104.039438. [DOI] [PMC free article] [PubMed] [Google Scholar]
- 16.Kolisnychenko V, Plunkett G III, Herring CD, Feher T, Posfai J, Blattner FR, Posfai G. 2002. Engineering a reduced Escherichia coli genome. Genome Res 12:640–647. doi: 10.1101/gr.217202. [DOI] [PMC free article] [PubMed] [Google Scholar]
- 17.Manson MD. 2000. Allele-specific suppression as a tool to study protein-protein interactions in bacteria. Methods 20:18–34. doi: 10.1006/meth.1999.0902. [DOI] [PubMed] [Google Scholar]
- 18.Zhou NE, Kay CM, Hodges RS. 1993. Disulfide bond contribution to protein stability: positional effects of substitution in the hydrophobic core of the two-stranded alpha-helical coiled-coil. Biochemistry 32:3178–3187. doi: 10.1021/bi00063a033. [DOI] [PubMed] [Google Scholar]
- 19.Kwok SC, Hodges RS. 2004. Stabilizing and destabilizing clusters in the hydrophobic core of long two-stranded α-helical coiled-coils. J Biol Chem 279:21576–21588. doi: 10.1074/jbc.M401074200. [DOI] [PubMed] [Google Scholar]
- 20.Hillar A, Tripet B, Zoetewey D, Wood JM, Hodges RS, Boggs JM. 2003. Detection of α-helical coiled-coil dimer formation by spin-labeled synthetic peptides: a model parallel coiled-coil peptide and the antiparallel coiled coil formed by a replica of the ProP C terminus. Biochemistry 42:15170–15178. doi: 10.1021/bi035122t. [DOI] [PubMed] [Google Scholar]
- 21.Prelich G. 1999. Suppression mechanisms: themes from variations. Trends Genet 15:261–266. doi: 10.1016/S0168-9525(99)01749-7. [DOI] [PubMed] [Google Scholar]
- 22.Chanel-Vos C, Kielian M. 2006. Second-site revertants of a Semliki Forest virus fusion-block mutation reveal the dynamics of a class II membrane fusion protein. J Virol 80:6115–6122. doi: 10.1128/JVI.00167-06. [DOI] [PMC free article] [PubMed] [Google Scholar]
- 23.Kielian M, Chanel-Vos C, Liao M. 2010. Alphavirus entry and membrane fusion. Viruses 2:796–825. doi: 10.3390/v2040796. [DOI] [PMC free article] [PubMed] [Google Scholar]
- 24.Kim C, Schmidt T, Cho E-G, Ye F, Ulmer TS, Ginsberg MH. 2011. Basic amino-acid side chains regulate transmembrane integrin signalling. Nature 481:209–213. doi: 10.1038/nature10697. [DOI] [PMC free article] [PubMed] [Google Scholar]
- 25.Bright JN, Sansom MSP. 2003. The flexing/twirling helix: exploring the flexibility about molecular hinges formed by proline and glycine motifs in transmembrane helices. J Phys Chem B 107:627–636. doi: 10.1021/jp026686u. [DOI] [Google Scholar]
- 26.Russell CJ, Kantor KL, Jardetzky TS, Lamb RA. 2003. A dual-functional paramyxovirus F protein regulatory switch segment activation and membrane fusion. J Cell Biol 163:363–374. doi: 10.1083/jcb.200305130. [DOI] [PMC free article] [PubMed] [Google Scholar]
- 27.Paterson RG, Russell CJ, Lamb RA. 2000. Fusion protein of the paramyxovirus SV5: destabilizing and stabilizing mutants of fusion activation. Virology 270:17–30. doi: 10.1006/viro.2000.0267. [DOI] [PubMed] [Google Scholar]
- 28.West DS, Sheehan MS, Segeleon PK, Dutch RE. 2005. Role of the simian virus 5 fusion protein N-terminal coiled-coil domain in folding and promotion of membrane fusion. J Virol 79:1543–1551. doi: 10.1128/JVI.79.3.1543-1551.2005. [DOI] [PMC free article] [PubMed] [Google Scholar]
- 29.McNew JA, Weber T, Engelman DM, Söllner TH, Rothman JE. 1999. The length of the flexible SNAREpin juxtamembrane region is a critical determinant of SNARE-dependent fusion. Mol Cell 4:415–421. doi: 10.1016/S1097-2765(00)80343-3. [DOI] [PubMed] [Google Scholar]
- 30.Chernomordik LV, Kozlov MM. 2008. Mechanics of membrane fusion. Nat Struct Mol Biol 15:675–683. doi: 10.1038/nsmb.1455. [DOI] [PMC free article] [PubMed] [Google Scholar]
- 31.Martens S, McMahon HT. 2008. Mechanisms of membrane fusion: disparate players and common principles. Nat Rev Mol Cell Biol 9:543–556. doi: 10.1038/nrm2417. [DOI] [PubMed] [Google Scholar]
- 32.Gao Y, Zorman S, Gundersen G, Xi Z, Ma L, Sirinakis G, Rothman JE, Zhang Y. 2012. Single reconstituted neuronal SNARE complexes zipper in three distinct stages. Science 337:1340–1343. doi: 10.1126/science.1224492. [DOI] [PMC free article] [PubMed] [Google Scholar]
- 33.Söllner TH. 2004. Intracellular and viral membrane fusion: a uniting mechanism. Curr Opin Cell Biol 16:429–435. doi: 10.1016/j.ceb.2004.06.015. [DOI] [PubMed] [Google Scholar]
- 34.Powell BS, Rivas MP, Court DL, Nakamura Y, Turnbough CL Jr. 1994. Rapid confirmation of single copy lambda prophage integration by PCR. Nucleic Acids Res 22:5765–5766. doi: 10.1093/nar/22.25.5765. [DOI] [PMC free article] [PubMed] [Google Scholar]
- 35.Johnson-Boaz R, Chang CY, Young R. 1994. A dominant mutation in the bacteriophage lambda S gene causes premature lysis and an absolute defective plating phenotype. Mol Microbiol 13:495–504. doi: 10.1111/j.1365-2958.1994.tb00444.x. [DOI] [PubMed] [Google Scholar]
- 36.White R, Tran TA, Dankenbring CA, Deaton J, Young R. 2010. The N-terminal transmembrane domain of λ S is required for holin but not antiholin function. J Bacteriol 192:725–733. doi: 10.1128/JB.01263-09. [DOI] [PMC free article] [PubMed] [Google Scholar]
- 37.Baba T, Ara T, Hasegawa M, Takai Y, Okumura Y, Baba M, Datsenko KA, Tomita M, Wanner BL, Mori H. 2006. Construction of Escherichia coli K-12 in-frame, single-gene knockout mutants: the Keio collection. Mol Syst Biol 2:2006.008. doi: 10.1038/msb4100050. [DOI] [PMC free article] [PubMed] [Google Scholar]


