ABSTRACT
Eravacycline is a novel fluorocycline antibiotic with potent activity against a broad range of pathogens, including strains with tetracycline and other drug resistance phenotypes. The goal of the studies was to determine which pharmacokinetic/pharmacodynamic (PK/PD) parameter and magnitude best correlated with efficacy in the murine thigh infection model. Six Escherichia coli isolates were utilized for the studies. MICs were determined using CLSI methods and ranged from 0.125 to 0.25 mg/liter. A neutropenic murine thigh infection model was utilized for all treatment studies. Single-dose plasma pharmacokinetics were determined in mice after administration of 2.5, 5, 10, 20, 40, and 80 mg/kg of body weight. Pharmacokinetic studies exhibited maximum plasma concentration (Cmax) values of 0.34 to 2.58 mg/liter, area under the concentration-time curve (AUC) from time zero to infinity (AUC0–∞) values of 2.44 to 57.6 mg · h/liter, and elimination half-lives of 3.9 to 17.6 h. Dose fractionation studies were performed using total drug doses of 6.25 mg/kg to 100 mg/kg fractionated into 6-, 8-, 12-, or 24-h regimens. Nonlinear regression analysis demonstrated that the 24-h free drug AUC/MIC (fAUC/MIC) was the PK/PD parameter that best correlated with efficacy (R2 = 0.80). In subsequent studies, we used the neutropenic murine thigh infection model to determine if the magnitude of the AUC/MIC needed for the efficacy of eravacycline varied among pathogens. Mice were treated with 2-fold increasing doses (range, 3.125 to 50 mg/kg) of eravacycline every 12 h. The mean fAUC/MIC magnitudes associated with the net stasis and the 1-log-kill endpoints were 27.97 ± 8.29 and 32.60 ± 10.85, respectively.
KEYWORDS: eravacycline, pharmacodynamics, Escherichia coli
INTRODUCTION
Diseases due to antibiotic-resistant bacteria are emerging at an alarming rate worldwide, warranting the development of new antimicrobial agents. Eravacycline is a novel synthetic fluorocycline that belongs to the tetracycline class of antibacterial agents and is currently in development for the treatment of complicated intra-abdominal infection (cIAI) (1) and complicated urinary tract infection (cUTI) (2). Oral and intravenous formulations have been developed. As with other tetracyclines, eravacycline inhibits bacterial protein synthesis through binding to the 30S ribosomal subunit and demonstrates potent and broad-spectrum antimicrobial activity. Importantly, the drug maintains activity against many drug-resistant bacteria, including bacteria exhibiting tetracycline-specific efflux and ribosomal protection (2).
Escherichia coli organisms are the predominant pathogens in intra-abdominal infections (3) and urinary tract infections, accounting for 47 to 94% of isolates (4). Given this, we sought to determine the pharmacokinetic (PK)/pharmacodynamic (PD) index predictive of therapeutic success against E. coli and the magnitude of the PK/PD index associated with stasis and cidal outcomes in the neutropenic murine thigh infection model.
RESULTS
In vitro susceptibility testing.
The median MICs of eravacycline ranged from 0.125 to 0.25 μg/ml and are shown in Table 1.
TABLE 1.
In vitro and in vivo efficacies of eravacycline against select E. coli isolatesa
| E. coli isolate | Comment | MIC (mg/liter) | Bacterial burden at start of therapy (log10 no. of CFU/thigh) | Growth in controls at 24 h (log10 no. of CFU/thigh) | No. of CFU/thigh for maximum kill at 24 h from 0 h (Δlog10 no. of CFU/thigh) | Stasis |
1-Log kill |
||||
|---|---|---|---|---|---|---|---|---|---|---|---|
| 24-h dose (mg/kg) | 24-h tAUC/MIC | 24-h fAUC/MIC | 24-h dose (mg/kg) | 24-h tAUC/MIC | 24-h fAUC/MIC | ||||||
| 1-894-1 | Tetr | 0.125 | 7.12 | 2.975 | −1.74 | 15.66 | 92.88 | 30.91 | 26.73 | 119.84 | 37.90 |
| 1135 | Tet(M), ESBL | 0.25 | 7.37 | 3.13 | −1.65 | 27.81 | 60.55 | 19.11 | 49.19 | 88.74 | 25.34 |
| 355 | Tet (B), ESBL | 0.125 | 7.33 | 2.975 | −0.78 | 16.85 | 98.16 | 32.27 | NA | ||
| 14714-1 | ESBL | 0.125 | 7.45 | 2.1875 | −2.13 | 14.82 | 89.18 | 29.95 | 17.13 | 99.39 | 32.59 |
| 102-94090 | ESBL | 0.25 | 7.35 | 2.615 | −1.61 | 18.34 | 52.35 | 16.98 | 31.44 | 62.67 | 19.67 |
| ATCC 25922 | ATCC | 0.125 | 7.31 | 2.26 | −2.17 | 29.08 | 122.58 | 38.61 | 45.87 | 162.23 | 47.52 |
| Mean | 7.32 | 2.69 | −1.68 | 20.43 | 85.95 | 27.97 | 34.07 | 106.58 | 32.60 | ||
| Median | 7.34 | 2.80 | −1.70 | 17.60 | 91.03 | 30.43 | 31.44 | 99.39 | 32.59 | ||
| SD | 0.11 | 0.40 | 0.50 | 6.34 | 25.78 | 8.29 | 13.37 | 37.32 | 10.85 | ||
Δlog10 no. of CFU/thigh, change in the log10 number of CFU per thigh; tAUC, total drug AUC; NA, not achieved.
Drug pharmacokinetics.
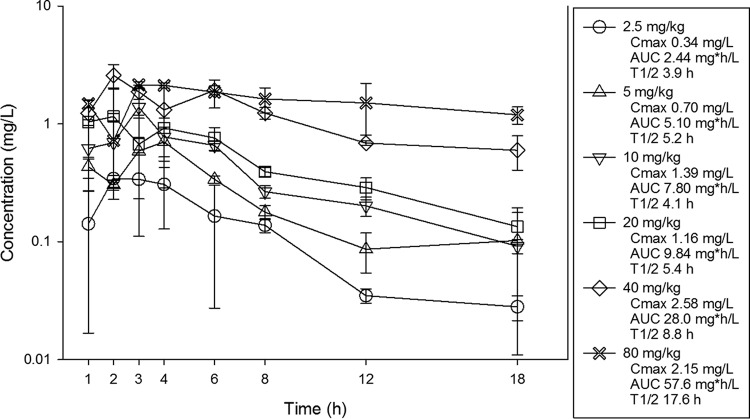
The single-dose pharmacokinetics of eravacycline are shown in Fig. 1. At the doses studied, eravacycline drug concentrations increased in a dose-dependent manner across the dose range. The maximum plasma concentrations (Cmax) ranged from 0.34 to 2.15 mg/liter. The area under the concentration-time curve (AUC) from time zero to infinity (AUC0–∞) values ranged from 2.44 to 57.6 mg · h/liter and were linear across the 2.5- to 80-mg dosing range (R2 = 0.99). The elimination half-life (t1/2) ranged from 3.9 to 17.6 h.
FIG 1.
Single-dose plasma pharmacokinetics of eravacycline. Six different doses that varied by a 2-fold concentration on a milligram-per-kilogram basis were administered to mice by the i.p. route. Groups of three mice were sampled for each time point. Each symbol represents the mean ± SD for three animals. Shown in the legend is the maximum plasma concentration (Cmax), the area under the concentration-time curve from time zero to infinity (AUC0–∞), and the elimination half-life (t1/2).
PK/PD parameter determination.
The dose-response relationships for the four dosing intervals against E. coli ATCC 25922 are shown in Fig. 2. At the start of therapy, mice had 7.31 ± 0.21 log10 CFU/thigh of E. coli ATCC 25922, and the organism grew 2.15 ± 0.38 log10 CFU/thigh after 24 h in untreated control mice. Each fractionation arm demonstrated relatively similar concentration-dependent activity as the dose was escalated, with the highest doses studied resulting in net cidal activity. The similarity in the dose-response curves for each of the fractionated regimens suggests that AUC/MIC is likely the predictive PK/PD index. This is because this parameter is held relatively constant as the total dose administered over 24 h is the same in each fractionation regimen. In contrast, Cmax and the time above the MIC changed proportionally (and inversely) to each other on the basis of dose in each arm.
FIG 2.
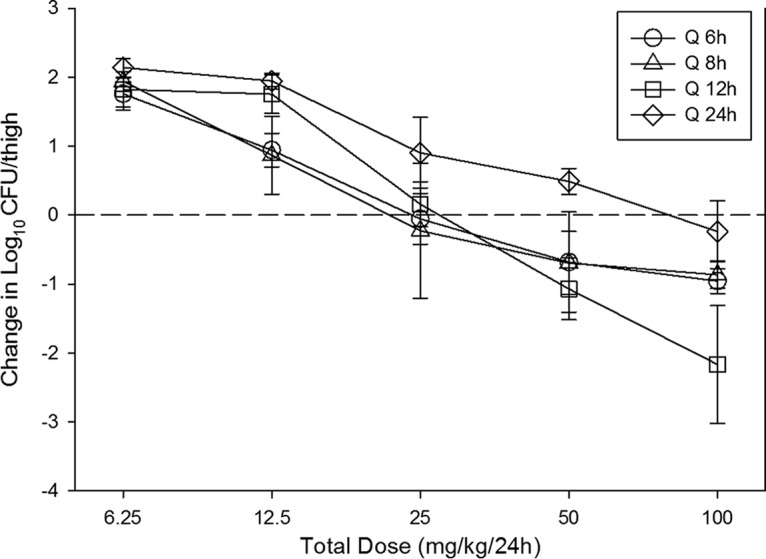
In vivo dose fractionation with eravacycline using a neutropenic murine thigh infection model. Each symbol represents the mean and standard deviation for four thighs infected with E. coli ATCC 25922. The error bars represent the standard deviations. The burden of organisms was measured at the start and end of therapy. Five total drug dose levels (in milligrams per kilogram every 24 h) were fractionated into one of four dosing regimens and are shown on the x axis. The y axis represents the change in organism burden from the start of therapy. The dashed horizontal line represents net stasis over the treatment period. Points above the line represent net growth, and points below the line represent net killing (cidal activity). Q 6h, Q 8h, Q 12h, and Q 24h, dosing every 6, 8, 12, and 24 h, respectively.
The relationships between microbiologic effect and each of the pharmacodynamic parameters 24-h free drug AUC/MIC (fAUC/MIC), 24-h free-drug Cmax/MIC (fCmax/MIC), and the percentage of time that the free drug concentration exceeded the MIC (percent TMIC) over 24 h against E. coli ATCC 25922 are shown in Fig. 3. As with other tetracyclines (5–8), the strongest relationship was seen when the results were correlated with the 24-h fAUC/MIC ratio, with an R2 value of 0.80. Regression with both the percent TMIC and Cmax/MIC resulted in slightly less robust relationships. Consideration of total or free drug levels did not appreciably impact the relationships between efficacy and PK/PD parameters.
FIG 3.
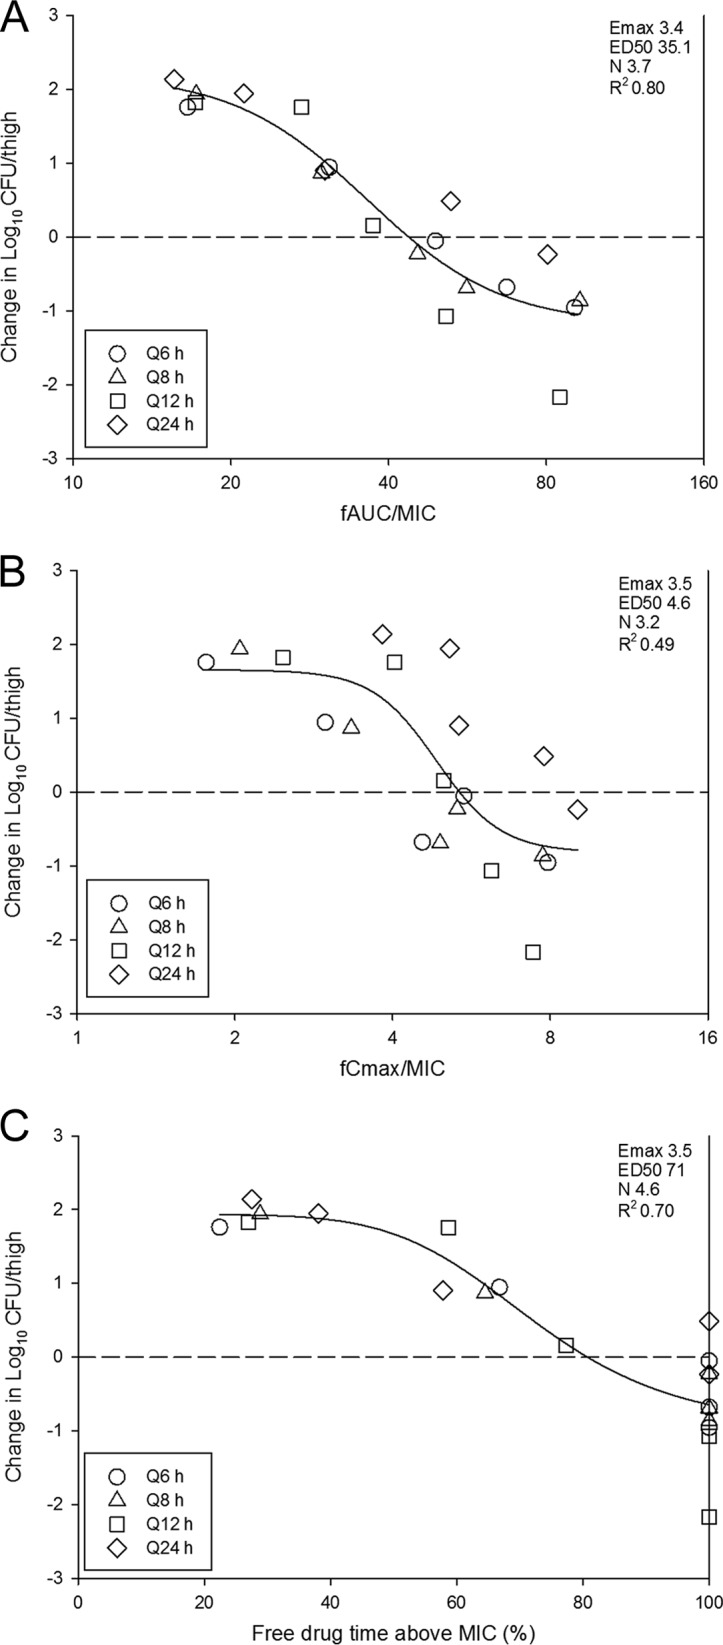
Impact of pharmacodynamic regression of the in vivo dose fractionation study with eravacycline against E. coli ATCC 25922. Each symbol represents the mean and standard deviation for four thighs. The dose data are expressed as fAUC/MIC (A), fCmax/MIC (B), and the percentage of time that the plasma free drug concentrations exceed the MIC (Free drug time above MIC) (C). R2 is the coefficient of determination. Also shown for each PD index is the maximal effect (Emax), the PD index value associated with 50% of the maximal effect (ED50), and the slope of the relationship, or the Hill coefficient (N). The line drawn through the data points is the best-fit line based upon the sigmoid Emax formula. The dashed horizontal line represents net stasis over the treatment period. Points above the line represent net growth, and points below the line represent net killing (cidal activity).
PK/PD magnitude determination.
The dose-response relationships for each of the six E. coli isolates in the neutropenic murine thigh infection model are shown in Fig. 4. The burden at the start of therapy, growth in untreated controls (i.e., fitness), and drug effect were relatively similar for each isolate (Table 1). At the start of therapy, mice had 7.32 ± 0.11 log10 CFU/thigh of E. coli. The organisms grew 2.69 ± 0.40 log10 CFU/thigh in untreated control mice. The maximal reduction in the count of E. coli in eravacycline-treated mice compared to that in the untreated controls was −4.37 ± 0.48 log10 CFU/thigh, and the maximum kill from zero hour was −1.68 ± 0.50 log10 CFU/thigh. Net stasis was achieved against all strains, and a more than 1-log kill was achieved against five of six strains. The relationship between the organism burden in the thigh and the plasma 24-h fAUC/MIC ratio is shown in Fig. 5. The doses necessary to achieve a static and a 1-log-kill effect against multiple organisms are shown in Table 1. Also shown are the associated total and free-drug 24-h AUC/MIC target ratios necessary to achieve these outcomes. The mean 24-h fAUC/MIC values associated with the net stasis and 1-log-kill endpoints were 28 and 33, respectively.
FIG 4.
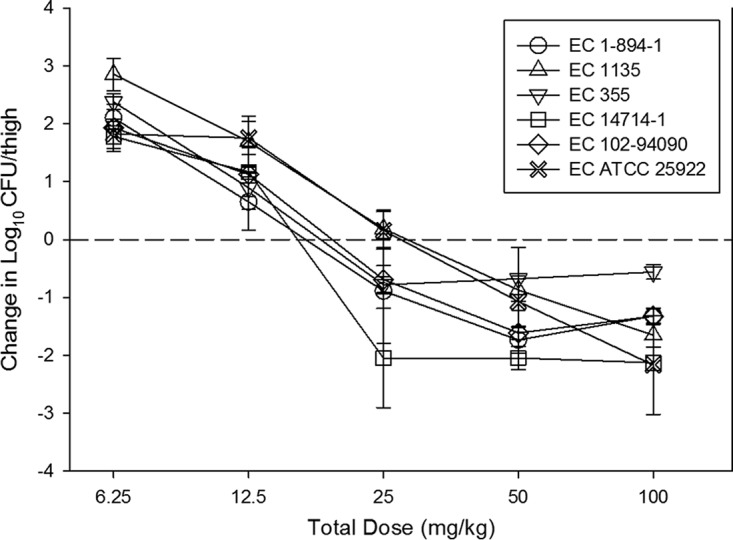
In vivo dose-effect of eravacycline against six E. coli (EC) strains using a neutropenic murine thigh infection model. Each symbol represents the mean and standard deviation for four thighs. Five total drug dose levels were fractionated into a regimen given every 12 h. The burden of organisms was measured at the start and end of therapy. The study period was 24 h. The horizontal dashed line at 0 represents the burden of organisms in the thighs of mice at the start of therapy. Data points below the line represent killing, and points above the line represent growth.
FIG 5.
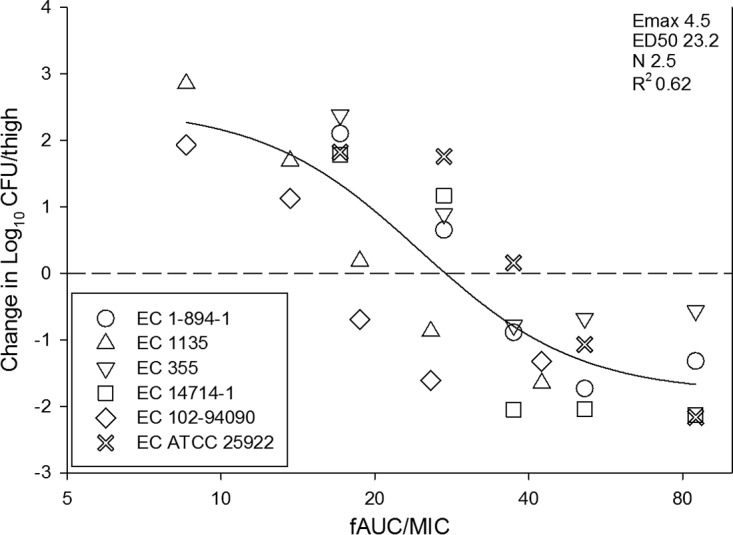
In vivo dose-effect of eravacycline against six E. coli isolates using a neutropenic murine thigh infection model. Eravacycline exposure is expressed as the free drug 24-h AUC/MIC (fAUC/MIC). R2 represents the coefficient of determination. The ED50 represents the AUC/MIC associated with 50% of the maximal effect (Emax), and N is the slope of the relationship, or the Hill coefficient. The line drawn through the data points is the best-fit line based upon the sigmoid Emax formula. The dashed line represents the burden at the start of therapy. Points above the line represent net growth, and those below the line represent killing.
DISCUSSION
Similar to other antibiotic classes, the widespread use of tetracyclines for over 60 years has resulted in an increase in the incidence of tetracycline-resistant infections (9, 10). Recently, the evolution of the tetracycline antibiotic class has been driven by semisynthetic approaches (10). Tigecycline, a glycylcycline derivative, was developed to enhance activity against tetracycline-resistant bacteria (11). More recently, eravacycline, a novel fluorocycline antibiotic, was developed by a total synthetic method (12) and has been shown to be a potent translation inhibitor against strains expressing acquired tetracycline-specific resistance mechanisms (2).
The present studies demonstrated the activity of eravacycline against a diverse group of E. coli strains. This potent activity has been observed in previous in vitro and in vivo studies against both E. coli and methicillin-resistant Staphylococcus aureus (2, 12–14). We observed cidal activity against all isolates, and the shapes of the exposure-response curves were quite steep, with small increases in drug exposure resulting in large increases in cidal activity. Additionally, this in vivo efficacy was observed against multidrug-resistant strains expressing a variety of tetracycline and extended-spectrum β-lactamase (ESBL) genotypes and phenotypes. Similar to previous studies, we demonstrated that the PK/PD parameter 24-h AUC/MIC was the most predictive of efficacy (5–7). Specifically, the dose-response relationship against E. coli was not impacted by a change in the dosing interval, and pharmacodynamic regression was the strongest with the 24-h AUC/MIC index.
There is a paucity of pharmacodynamic target identification studies with the tetracycline class, especially with Gram-negative pathogens. In vitro and in vivo studies with doxycycline against S. aureus identified an fAUC/MIC target value near 25 to be associated with net stasis (15). A similar study using doxycycline for Streptococcus pneumoniae found that an fAUC/MIC target of 24 was associated with net stasis (16). Eravacycline itself has been studied in a previous thigh infection model exploring the PK/PD target against a single strain of methicillin-resistant S. aureus (17). The AUC/MIC value associated with stasis was relatively similar to the doxycycline target at a total drug AUC/MIC value of 38.4 (fAUC/MIC, approximately 10). The total drug AUC/MIC target needed to achieve a 1-log kill was modestly higher than that needed to achieve stasis at 46.9. The pharmacodynamic characteristics of eravacycline against multiple E. coli isolates in the present study were quite similar. Importantly, the PK/PD target was similar across wild-type strains as well as those with distinct resistance mechanisms. Specifically, the fAUC/MIC numeric targets for the net stasis and 1-log-kill endpoints were noted at values of 28 and 33, respectively. The steep nature of the exposure-response relationship across these treatment endpoints was also congruent with the findings of the earlier investigations. These values are also comparable to the targets for the glycylcycline tigecycline in clinical trials. An exposure-response study of tigecycline in patients with community-acquired pneumonia found that a free drug AUC/MIC of >12.5 increased the likelihood of cure (18). A pharmacodynamic AUC/MIC value near 25 is likely to be relevant in clinical studies with eravacycline and should be considered in the design of optimal dosing regimens.
In conclusion, eravacycline exhibited potent in vitro and in vivo efficacy against E. coli. The PK/PD index AUC/MIC was the index that was the most strongly associated with efficacy. Free drug AUC/MIC targets were 28 and 33 for the stasis and 1-log-kill endpoints, respectively. These animal model PK/PD targets should be useful for dosing regimen design and the development of susceptibility breakpoints.
MATERIALS AND METHODS
Organisms, media, and antibiotic.
Six E. coli strains were used for these studies (Table 1). The strains were chosen to include those with common tetracycline and beta-lactam resistance phenotypes. They were grown, subcultured, and quantified using Mueller-Hinton broth (MHB) and agar (Difco Laboratories, Detroit, MI). Eravacycline for in vitro and in vivo studies was supplied by the study sponsor (Tetraphase Pharmaceuticals, Inc., Watertown, MA). The compound was prepared by reconstitution in sterile water and subsequent dilution in sterile 0.9% normal saline solution.
In vitro susceptibility testing.
The MICs of eravacycline for the various isolates were determined using Clinical and Laboratory Standards Institute (CLSI) microdilution methods (19, 20). All MIC assays were performed in duplicate on three separate occasions. The median MIC from replicate assays is reported and was utilized in the PK/PD analyses.
Murine thigh infection model.
Animals for the present studies were maintained in accordance with the criteria of the Association for Assessment and Accreditation of Laboratory Animal Care (21). All animal studies were approved by the Animal Research Committee of the William S. Middleton Memorial VA Hospital.
Six-week-old, specific-pathogen-free, female ICR/Swiss mice weighing 23 to 27 g were used for all studies (Harlan Sprague-Dawley, Indianapolis, IN). Mice were rendered neutropenic (neutrophil count, <100/mm3) by injecting them with cyclophosphamide (Mead Johnson Pharmaceuticals, Evansville, IN) subcutaneously 4 days (150 mg/kg) and 1 day (100 mg/kg) before thigh infection. Previous studies have shown that this regimen produces neutropenia in this model for 5 days (22). Broth cultures of freshly plated bacteria were grown overnight to logarithmic phase to an absorbance at 580 nm of 0.3 (Spectronic 88; Bausch and Lomb, Rochester, NY). After 1:10 dilution into fresh Mueller-Hinton broth, the bacterial counts of the inoculum ranged from 107.0 to 107.4 CFU/ml. Thigh infections with each of the isolates were produced by injection of 0.1 ml of inoculum into the thighs of isoflurane-anesthetized mice. Eravacycline therapy was initiated 2 h after the infection procedure. After 24 h, the animals were euthanized and the thighs were aseptically removed, homogenized, and plated for determination of the number of CFU. No-treatment and zero-hour controls were included in all experiments.
Drug pharmacokinetics.
The single-dose plasma pharmacokinetics of eravacycline were determined in uninfected mice. Animals were administered single intraperitoneal doses (0.2 ml/dose) of eravacycline at dose levels of 2.5, 5, 10, 20, 40, and 80 mg/kg of body weight. Groups of three mice were sampled at each time point (eight time points, consisting of 1, 2, 3, 4, 6, 8, 12, and 18 h) and dose level. Samples were then centrifuged for 5 min at 4,000 rpm, and plasma was removed and frozen at −20°C until assay. Plasma concentrations were determined by the sponsor using liquid chromatography-tandem mass spectrometry (LC-MS/MS). Internal standards ranged from 10 to 5,000 ng/ml and were linear (R2 = 0.99) over the measurement range. The lower limit of detection was 10 ng/ml. The inter- and intra-assay coefficient of variation (CV) was <10%. Pharmacokinetic parameters, including elimination half-life (t1/2), the area under the concentration-time curve from time zero to infinity (AUC0–∞), and the maximum plasma concentration (Cmax), were calculated using a noncompartmental model. t1/2 was determined by linear least-squares regression. AUC0–∞ was calculated from the mean concentrations using the trapezoidal rule. Pharmacokinetic estimates for dose levels that were not directly measured were calculated using linear interpolation for dose levels between those with measured kinetics and linear extrapolation for dose levels above or below the highest and lowest dose levels with kinetic measurements. A previous study of eravacycline demonstrated a nonlinear relationship between the eravacycline concentration and the level of protein binding (23). This relationship was well described by the formula y = −0.085 ln(x) + 0.2752, where x is the eravacycline total drug concentration and y is the percent free drug. This equation was used in the current study to calculate free drug concentrations for analysis.
PK/PD parameter determination.
A dose fractionation study was undertaken to determine the PK/PD index (AUC/MIC, Cmax/MIC, or time above the MIC) that was predictive of efficacy for eravacycline. Twofold increasing doses (range, 6.25 mg/kg to 100 mg/kg) of eravacycline were fractionated into regimens of dosing every 6, 8, 12, and 24 h. Mice were infected with isolate ATCC 25922 as described above and administered eravacycline by intraperitoneal (i.p.) injection according to the dosing regimen prescribed in the fractionation design. After 24 h the mice were euthanized and the numbers of CFU in the thighs were determined. To determine which PK/PD index was the most closely linked with efficacy, the number of bacteria in the thigh at the end of 24 h of therapy was correlated with (i) the free drug Cmax/MIC ratio (fCmax/MIC), (ii) the 24-h free drug AUC/MIC ratio (fAUC/MIC), and (iii) the percentage of the dosing interval during which plasma free drug levels exceeded the MIC for each of the dosage regimens studied (percent TMIC). The correlation between efficacy and each of the three PK/PD indices was determined by nonlinear least-squares multivariate regression derived from the Hill equation, as follows: E = (Emax × DN)/(ED50N + DN), where E is the effector, in this case, the log change in the number of CFU per thigh between treated mice and untreated controls after the 24-h period of study, Emax is the maximum effect, D is the 24-h total dose, ED50 is the dose required to achieve 50% of the Emax, and N is the slope of the dose-effect curve. The values for the indices Emax, ED50, and N were calculated using nonlinear least-squares regression. The coefficient of determination (R2) was used to estimate the variance that might be due to regression with each of the PK/PD indices. Given the prolonged half-life in the animals, drug accumulation was accounted for in multidosing regimens. The fraction of drug remaining prior to the next administration was calculated using the formula f = e−k · tau, where f is the fraction of drug remaining, e is Euler's number (2.71828), k is the terminal elimination rate constant, and tau is the dosing interval (24).
PK/PD parameter magnitude studies.
Dose-response experiments were performed for six E. coli isolates using the thigh infection model as described above. The dose range consisted of 2-fold increases (range, 3.125 to 50 mg/kg/12 h) in the drug concentration with administration by the i.p. route. The dose-response relationships were quantified and the relationship between the PK/PD parameter AUC/MIC and treatment efficacy was determined using the sigmoid Emax (Hill) model in SigmaPlot software (version 12.3; Systat Software, San Jose, CA). These PK/PD relationships were examined utilizing the plasma total and free drug concentrations from the pharmacokinetic studies. The coefficient of determination (R2) from this model was used to numerically quantify the strength of this relationship. This coefficient represents the percentage of the variance in bacterial numbers that can be attributed to the PK/PD parameter. The doses required for a static effect (static dose) and 1-log kill (1-log-kill dose) compared to the number of bacteria at the start of therapy for multiple E. coli pathogens in the thigh infection model were determined utilizing the plasma total and free drug concentrations and the following equation: log10 D = {log10[E/(Emax − E)]/N} + log10 ED50, where E is the growth from zero hour, Emax is the maximum effect, ED50 is the dose required to achieve 50% of the Emax, N is the slope of the dose-effect curve, and D is the dose required to achieve net stasis. For 1-log kill, E was set to growth from zero hour plus 1 in order to calculate the dose (D) for 1-log kill. The associated 24-h total and free drug AUC/MIC targets for each organism were calculated.
ACKNOWLEDGMENT
This study was funded by Tetraphase Pharmaceuticals, Inc.
REFERENCES
- 1.Solomkin JS, Ramesh MK, Cesnauskas G, Novikovs N, Stefanova P, Sutcliffe JA, Walpole SM, Horn PT. 2014. Phase 2, randomized, double-blind study of the efficacy and safety of two dose regimens of eravacycline versus ertapenem for adult community-acquired complicated intra-abdominal infections. Antimicrob Agents Chemother 58:1847–1854. doi: 10.1128/AAC.01614-13. [DOI] [PMC free article] [PubMed] [Google Scholar]
- 2.Zhanel GG, Cheung D, Adam H, Zelenitsky S, Golden A, Schweizer F, Gorityala B, Lagace-Wiens PR, Walkty A, Gin AS, Hoban DJ, Karlowsky JA. 2016. Review of eravacycline, a novel fluorocycline antibacterial agent. Drugs 76:567–588. doi: 10.1007/s40265-016-0545-8. [DOI] [PubMed] [Google Scholar]
- 3.Syue LS, Chen YH, Ko WC, Hsueh PR. 2016. New drugs for the treatment of complicated intra-abdominal infections in the era of increasing antimicrobial resistance. Int J Antimicrob Agents 47:250–258. doi: 10.1016/j.ijantimicag.2015.12.021. [DOI] [PubMed] [Google Scholar]
- 4.Wada K, Uehara S, Yamamoto M, Sadahira T, Mitsuhata R, Araki M, Kobayashi Y, Ishii A, Kariyama R, Watanabe T, Nasu Y, Kumon H. 2016. Clinical analysis of bacterial strain profiles isolated from urinary tract infections: a 30-year study. J Infect Chemother 22:478–482. doi: 10.1016/j.jiac.2016.04.004. [DOI] [PubMed] [Google Scholar]
- 5.Craig WA. 1998. Pharmacokinetic/pharmacodynamic parameters: rationale for antibacterial dosing of mice and men. Clin Infect Dis 26:1–10. doi: 10.1086/516284. [DOI] [PubMed] [Google Scholar]
- 6.Passarell JA, Meagher AK, Liolios K, Cirincione BB, Van Wart SA, Babinchak T, Ellis-Grosse EJ, Ambrose PG. 2008. Exposure-response analyses of tigecycline efficacy in patients with complicated intra-abdominal infections. Antimicrob Agents Chemother 52:204–210. doi: 10.1128/AAC.00813-07. [DOI] [PMC free article] [PubMed] [Google Scholar]
- 7.Meagher AK, Passarell JA, Cirincione BB, Van Wart SA, Liolios K, Babinchak T, Ellis-Grosse EJ, Ambrose PG. 2007. Exposure-response analyses of tigecycline efficacy in patients with complicated skin and skin-structure infections. Antimicrob Agents Chemother 51:1939–1945. doi: 10.1128/AAC.01084-06. [DOI] [PMC free article] [PubMed] [Google Scholar]
- 8.van Ogtrop ML, Andes D, Stamstad TJ, Conklin B, Weiss WJ, Craig WA, Vesga O. 2000. In vivo pharmacodynamic activities of two glycylcyclines (GAR-936 and WAY 152,288) against various gram-positive and gram-negative bacteria. Antimicrob Agents Chemother 44:943–949. doi: 10.1128/AAC.44.4.943-949.2000. [DOI] [PMC free article] [PubMed] [Google Scholar]
- 9.Roberts MC. 2005. Update on acquired tetracycline resistance genes. FEMS Microbiol Lett 245:195–203. doi: 10.1016/j.femsle.2005.02.034. [DOI] [PubMed] [Google Scholar]
- 10.Thaker M, Spanogiannopoulos P, Wright GD. 2010. The tetracycline resistome. Cell Mol Life Sci 67:419–431. doi: 10.1007/s00018-009-0172-6. [DOI] [PMC free article] [PubMed] [Google Scholar]
- 11.Peterson LR. 2008. A review of tigecycline—the first glycylcycline. Int J Antimicrob Agents 32(Suppl 4):S215–S222. doi: 10.1016/S0924-8579(09)70005-6. [DOI] [PubMed] [Google Scholar]
- 12.Xiao XY, Hunt DK, Zhou J, Clark RB, Dunwoody N, Fyfe C, Grossman TH, O'Brien WJ, Plamondon L, Ronn M, Sun C, Zhang WY, Sutcliffe JA. 2012. Fluorocyclines. 1. 7-Fluoro-9-pyrrolidinoacetamido-6-demethyl-6-deoxytetracycline: a potent, broad spectrum antibacterial agent. J Med Chem 55:597–605. doi: 10.1021/jm201465w. [DOI] [PubMed] [Google Scholar]
- 13.Grossman TH, Murphy TM, Slee AM, Lofland D, Sutcliffe JA. 2015. Eravacycline (TP-434) is efficacious in animal models of infection. Antimicrob Agents Chemother 59:2567–2571. doi: 10.1128/AAC.04354-14. [DOI] [PMC free article] [PubMed] [Google Scholar]
- 14.Monogue ML, Thabit AK, Hamada Y, Nicolau DP. 2016. Antibacterial efficacy of eravacycline in vivo against Gram-positive and Gram-negative organisms. Antimicrob Agents Chemother 60:5001–5005. doi: 10.1128/AAC.00366-16. [DOI] [PMC free article] [PubMed] [Google Scholar]
- 15.LaPlante KL, Leonard SN, Andes DR, Craig WA, Rybak MJ. 2008. Activities of clindamycin, daptomycin, doxycycline, linezolid, trimethoprim-sulfamethoxazole, and vancomycin against community-associated methicillin-resistant Staphylococcus aureus with inducible clindamycin resistance in murine thigh infection and in vitro pharmacodynamic models. Antimicrob Agents Chemother 52:2156–2162. doi: 10.1128/AAC.01046-07. [DOI] [PMC free article] [PubMed] [Google Scholar]
- 16.Christianson J, Andes D, Craig W. 2001. Magnitude of the 24-h AUC/MIC required for efficacy of doxycycline (doxy) against Streptococcus pneumoniae (SP) in a murine thigh-infection model, abstr 475. Abstr 39th Infect Dis Soc Am Annu Meet, San Francisco, CA. Infectious Diseases Society of America, Arlington, VA. [Google Scholar]
- 17.Weiss WJ, Pulse M, Renick P, Sutcliffe J. 2010. Efficacy of fluorocyclines TP-434 in the neutropenic thigh infection model is predicted by AUC/MIC, abstr F1-2164. Abstr 50th Intersci Conf Antimicrob Agents Chemother, Boston, MA American Society for Microbiology, Washington, DC. [Google Scholar]
- 18.Rubino CM, Bhavnani SM, Forrest A, Dukart G, Dartois N, Cooper A, Korth-Bradley J, Ambrose PG. 2012. Pharmacokinetics-pharmacodynamics of tigecycline in patients with community-acquired pneumonia. Antimicrob Agents Chemother 56:130–136. doi: 10.1128/AAC.00277-10. [DOI] [PMC free article] [PubMed] [Google Scholar]
- 19.Clinical and Laboratory Standards Institute. 2015. Methods for dilution antimicrobial susceptibility tests for bacteria that grow aerobically; approved standard, 10th ed CLSI document M07-A10. Clinical and Laboratory Standards Institute Wayne, PA. [Google Scholar]
- 20.Clinical and Laboratory Standards Institute. 2016. Performance standards for antimicrobial susceptibility testing, 26th ed CLSI supplement M100S. Clinical and Laboratory Standards Institute, Wayne, PA. [Google Scholar]
- 21.National Research Council Committee on the Care and Use of Laboratory Animals, Institute of Laboratory Animal Resources, and Commission on Life Sciences. 1996. Guide for the care and use of laboratory animals. National Academy Press, Washington, DC. [Google Scholar]
- 22.Leggett JE, Fantin B, Ebert S, Totsuka K, Vogelman B, Calame W, Mattie H, Craig WA. 1989. Comparative antibiotic dose-effect relations at several dosing intervals in murine pneumonitis and thigh-infection models. J Infect Dis 159:281–292. doi: 10.1093/infdis/159.2.281. [DOI] [PubMed] [Google Scholar]
- 23.Thabit AK, Monogue ML, Nicolau DP. 2016. Eravacycline pharmacokinetics and challenges in defining humanized exposure in vivo. Antimicrob Agents Chemother 60:5072–5075. doi: 10.1128/AAC.00240-16. [DOI] [PMC free article] [PubMed] [Google Scholar]
- 24.Shargel L, Yu A. 1993. Applied biopharmaceutics and pharmacokinetics, 3rd ed Appleton & Lange, Norwalk, CT. [Google Scholar]


