

Abstract
A genetic diagnosis of autosomal‐dominant polycystic kidney disease (ADPKD) is challenging due to allelic heterogeneity, high GC content, and homology of the PKD1 gene with six pseudogenes. Short‐read next‐generation sequencing approaches, such as whole‐genome sequencing and whole‐exome sequencing, often fail at reliably characterizing complex regions such as PKD1. However, long‐read single‐molecule sequencing has been shown to be an alternative strategy that could overcome PKD1 complexities and discriminate between homologous regions of PKD1 and its pseudogenes. In this study, we present the increased power of resolution for complex regions using long‐read sequencing to characterize a cohort of 19 patients with ADPKD. Our approach provided high sensitivity in identifying PKD1 pathogenic variants, diagnosing 94.7% of the patients. We show that reliable screening of ADPKD patients in a single test without interference of PKD1 homologous sequences, commonly introduced by residual amplification of PKD1 pseudogenes, by direct long‐read sequencing is now possible. This strategy can be implemented in diagnostics and is highly suitable to sequence and resolve complex genomic regions that are of clinical relevance.
Keywords: ADPKD, complex genomic regions, DNA diagnostics, long‐read sequencing, PacBio, PKD1, single‐molecule real‐time sequencing, variant detection
1. INTRODUCTION
DNA sequencing technologies have widely been applied in biomedical and biological research as well as diagnostics. Relatively low‐cost and high‐throughput are major advantages of next‐generation sequencing (NGS) over standard diagnostic assays (Mardis, 2013; Oliver, Hart, & Klee, 2015; Su et al., 2011). However, despite widespread use of NGS‐based diagnostics strategies (Chang & Li, 2013; Codina‐Solà et al., 2015; Dewey et al., 2014; LaDuca et al., 2014; Ligt et al., 2012; Ozsolak & Milos, 2011; Sun et al., 2015; von Kanel & Huber, 2013; Willig et al., 2015; Yang et al., 2013), short‐read sequencing approaches such as whole‐genome sequencing (WGS) and whole‐exome sequencing (WES), often fail at reliably characterizing complex regions of the human genome (Chaisson et al., 2015; Lee & Schatz, 2012). These regions are often associated with extreme GC content, segmental duplications (SDs), low‐complexity sequences, and gaps in the human reference sequence (Chaisson et al., 2015; Lee & Schatz, 2012; Steinberg et al., 2014). Single‐molecule long‐read sequencing can improve our understanding of genetic variations in complex but clinically relevant genomic regions (Guo et al., 2013; Laver et al., 2016; Loomis et al., 2013; Qiao et al., 2016).
In this study, we aim to show the value of single‐molecule long‐read sequencing as a tool to characterize genetic variants associated with autosomal‐dominant polycystic kidney disease (ADPKD). ADPKD is a common inherited disease that accounts for 5%–10% of end‐stage renal disease (Harris & Rossetti, 2010; Spithoven et al., 2014). Most ADPKD pathogenic variants occur in PKD1 (MIM# 601313) and PKD2 (MIM# 173910) genes with a reported prevalence of 85% and 15%, respectively (Barua et al., 2009; Harris & Rossetti, 2010). The mutation spectrums in PKD1 and PKD2 are highly heterogeneous, with no mutation hotspots present, indicating that pathogenic variants in either PKD1 or PKD2 are usually private (Gout, Martin, Brown, & Ravine, 2007; Harris & Rossetti, 2010). The screening of PKD1 is challenging due to difficulties in amplification and low resolution of its complex locus (Qi et al., 2013; Rossetti et al., 2007; Tan et al., 2009). This is partly due to its high homology for most of PKD1 sequence with six pseudogenes as well as high GC content (Qi et al., 2013; Rossetti et al., 2007; Tan et al., 2009). In this study, we used PKD1 as an excellent example of a challenging and complex locus.
Several attempts have been made to improve the screening of PKD1 gene by using short‐read NGS approaches to replace the standard diagnostics based on Sanger sequencing and multiplex ligation‐dependent probe amplification (MLPA) assays (Eisenberger et al., 2015; Mallawaarachchi et al., 2016; Qi et al., 2013; Rossetti et al., 2012; Tan et al., 2014; Trujillano et al., 2014). These strategies provided a clear diagnosis with high sensitivity and specificity (97%–100%) for 115 out of 183 (Rossetti et al., 2012), 16 out of 25 (Tan et al., 2014), 10 out of 12 (Trujillano et al., 2014), 35 out of 55 (Eisenberger et al., 2015), and 24 out of 28 (Mallawaarachchi et al., 2016) screened ADPKD patients. Duplicated and high GC content genomic regions, such as that of PKD1 gene, can lead to ambiguous identification of variants when analyzed with short‐read NGS strategies (Lee & Schatz, 2012). These ambiguities produced low true‐positive variant detection rates of 28%–50% for the duplicated region of PKD1 (Qi et al., 2013), and many false positives (10%) due to misalignments, low‐quality alignments, and contamination by residual amplification of pseudogenes (Rossetti et al., 2012). Hence, diagnostic assays based on NGS short reads (e.g., Sanger or Illumina) may not be fully suited for reliable ADPKD diagnostics.
Here, we utilized the single‐molecule long‐read Pacific Biosciences RSII (PacBio) sequencing technology to assess its potential value in molecular diagnostics of ADPKD patients. We show that direct sequencing of long‐range PCR (LR‐PCR) products eliminates the interference of residual amplification of PKD1 pseudogenes, as well as alignment ambiguities. This also enabled a reliable identification of pathogenic variants, from single‐nucleotide variants (SNVs) to large deletions.
2. MATERIALS AND METHODS
2.1. Selection of subjects and DNA isolation
Nineteen genotyped patient samples were selected for this study from the diagnostic laboratory in which at least one pathogenic mutation was detected by Sanger sequencing or MLPA. The selection aimed to include different types of variants (e.g., SNVs, as well as small and larger insertions and deletions [indels]) that are located in exons or in immediately flanking intronic sequences, for both the duplicated regions as well as the unique part of PKD1. Although PKD2 is not a complex gene and is not the focus of this study, the sequencing of LR‐PCR fragments for PKD2 was performed as a proof of principle of long‐read sequencing and detection of variants also for PKD2. Genomic DNA isolation was performed from peripheral blood samples using PUREGENEۛ nucleic acid purification chemistry on the AUTOPURE LS 98 Instrument (Qiagen).
2.2. Long‐read sequencing and variant identification for ADPKD genes
2.2.1. LR‐PCR amplification
To cover the entire PKD1 and PKD2 coding regions (including exon boundaries), a total of five and nine LR‐PCR fragments were designed, respectively. Primers were optimized to produce amplicons of similar sizes (>4Kb) that could be pooled to improve sequencing efficiency and loading capacity for SMRT sequencing (Supp. Table S1; Supp. Fig. S1). The major part of PKD1 intron 1 was excluded from the design due to its large size and the lack of previously reported pathogenic variants in this region. Fragments were amplified from 50 ng of genomic DNA using 1× Extensorۛ Hi‐Fidelity Long Range PCR Master Mix (Thermo Scientific, Massachusetts, USA) on a 25 μl of PCR reaction volume with 200 nM of M13‐tagged primers. Initial denaturation was performed for 10 min at 98°, followed by 35 cycles of 15 sec at 98° and 10 min at 68°, respectively. Final extension was 10 min at 68°. Products were size selected using the BluePippin DNA size selection system to classify them in three different groups of sizes 4.3–6.1, 7.1–7.5, and 7.6–8.1 Kb (Supp. Table S1; Supp. Fig. S1). Fragments of equal size were pooled equimolar, and were visually inspected by band intensity on agarose gel. Finally, all pools were purified with a 0.6× v/v ratio of AMPure XP Beads (Beckman‐Coulter, Woerden, Netherlands).
2.2.2. SMRT sequencing library preparation
Sample indexes for patient tracking were added to the LR‐PCR fragments using an additional five‐cycle PCR with the previous LR‐PCR conditions. Barcoded pools were then purified with AMPure XP Beads, and pooled equimolar according to their size. Molar concentration was verified on a Bioanalyzer 12000 chip (Agilent, California, USA). For each barcoded pool, a SMRT‐bell library was prepared according to the PacBio's 5‐ or 10‐Kb Template Preparation procedures. Pooled amplicons were sequenced on five SMRT cells on the PacBio RSII system with the P6 sequencing chemistry. Data collected from 360‐min movie time was preprocessed using the standard primary analysis tools (Fig. 1).
Figure 1.
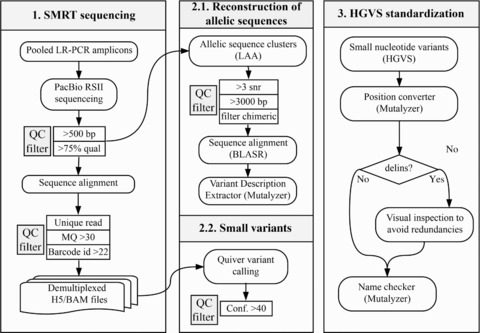
Flowchart of the applied analytical approach for the identification of potentially pathogenic variants and VUCS in ADPKD patient samples. Key processes in the workflow describe details and thresholds used for (1) sequencing of pooled LR‐PCR amplified fragments with PacBio RSII and postprocessing of reads including alignments and read quality filters; (2) identification of variants using two independent strategies including the reconstruction of allelic sequences, and small variant calling using Quiver; (3) standardization of variant nomenclature to represent a correct HGVS description and facilitate the comparison between datasets; (4) enrichment of variant annotations with VEP (including effect prediction, ClinVar, SIFT, PolyPhen, 1000 Genomes Project, dbSNP, and SwissProt annotations among others), and selection of high‐confidence variants; (5) identification of potentially pathogenic variants and VUCS based on their confidence, effect prediction, and population frequencies
2.2.3. Sequence alignment and variant calling
We used the RS_Resequencing protocol from SMRT Analysis Suite v.2.3 to align long reads against the human reference genome, downloaded from the Genome Reference Consortium version 37 patch 13 (GRCh37.p13). Samples were demultiplexed into individual files (H5 and BAM formats) using known barcode sequences and a minimum barcode identity score of 22 (Fig. 1). Alignments were filtered to contain mapped reads with a mapping quality threshold of 30 Phred score using Samtools v.1.2 (Supp. Table S2). Read coverage and targeted PCR statistics for LR‐PCR amplicons were computed with BedTools v.2.25.0, and PicardTools v.1.1.40 (Supp. Tables S2–S4). Variant calling was performed using Quiver (allowing for diploid calling and maximum coverage of 10,000). Variants with a Quiver confidence score lower than 40 were filtered out from downstream analysis (Fig. 1).
2.2.4. Reconstruction of allelic sequences
PKD1 and PKD2 allelic sequences were reconstructed using the Long Amplicon Analysis available in SMRT Analysis Suite 2.3. Only reads longer than 3,000 base pairs (bp) and average signal to noise ratio of three were used for the reconstruction (Fig. 1). Based on this reference‐free subread (full‐length and nonfull‐length reads) clustering, chimeric sequences were identified and comprehended ≤0.85% (6,288/738,822) of subreads that were subsequently removed from the analysis. Allelic sequences of PKD1 and PKD2 were aligned to the human reference genome GRCh37.p13 using BLASR (Chaisson & Tesler, 2012), and reporting a single best‐scoring alignment. Variants were extracted by comparison between the reconstructed alleles and the human reference sequence with the Variant Description Extractor from the Mutalyzer Suite 2.0.21 (Vis, Vermaat, Taschner, Kok, & Laros, 2015).
2.2.5. Loss of heterozygosity analysis
Loss of heterozygosity (LoH) for each amplified fragment was assessed to identify patients with potential large deletions for PKD1. We first identified heterozygous substitutions within the amplified fragments with a variant frequency between 25% and 75%. Amplified fragments with zero heterozygous substitutions were identified as LoH. Large deletions produce multiple LR‐PCR fragments dropouts, and were identified by the detection of consecutive LoH fragments. The detection of consecutive LoH fragments was not a direct identification of large deletions per se, rather than an indication of the presence of large deletions in the amplified LR‐PCR fragment regions. Identified LoH regions were then compared with large deletions detected by MLPA.
3. ADPKD VARIANT NOMENCLATURE AND GENOTYPING
Variant descriptions were standardized to concord with HGVS guidelines (den Dunnen et al., 2016), using the Mutalyzer Name Checker tool (Wildeman, van Ophuizen, Dunnen, & Taschner, 2008). Genomic HGVS descriptions were converted to coding notations using the Position Converter from Mutalyzer (Wildeman et al., 2008). Only changes in RefSeq‐annotated canonical transcripts for PKD1 (NM_001009944.2) and PKD2 (NM_000297.3) were further analyzed. HGVS descriptions of deletion–insertions (delins) were manually inspected to avoid variant redundancies and undesired clustering of neighboring independent events (Fig. 1; Supp. Table S5). Then, standardized variants were annotated using the Variant Effect Predictor (VEP), from Ensembl tools v.83 (McLaren et al., 2010), with additional parameters “‐everything,” and “‐refseq” (Fig. 1). All variant annotations reported by VEP are fully disclosed in the raw VCF files (EGAS00001002106). Variant frequency and coverage were used to filter low‐confidence variants by applying thresholds for: (1) sequencing depth of ≥50× subreads and ≥15× reads that ensures a sufficient control over the SMRT sequencing random error rate (1% mismatches and 13% indels) and (2) minimum variant frequency of 10% for substitutions and 15% for delins (Fig. 1). For interpreting insertion and deletion frequencies, neighboring bases were also examined. The selection of strong pathogenic variant candidates or variants of unknown clinical significance (VUCS) was based on the following criteria: (1) high predicted effect on the coding sequence or splice‐site region (e.g., missense, in‐frame indels, frameshifts, and splice‐site acceptor or donor variants); (2) population frequency in the 1000 genomes project <1%; (3) unique occurrence (1/19) (∼5%) in the patient cohort since, in ADPKD, no single disease‐causing variant accounts for more than 2% of affected families (Harris & Rossetti, 2010), or more than 1.7% of ADPKD reported cases in the ADPKD database (PKDB) (http://pkdb.mayo.edu/; accessed version 3.1) (Gout et al., 2007) (Fig. 1).
3.1. Clinical diagnostics pipeline for ADPKD genotyping
3.1.1. Sanger sequencing
The current diagnostics pipeline for ADPKD genotyping, including Sanger sequencing and MLPA, uses a different set of LR‐PCR primers to target the duplicated part of PKD1 (exons 1–32) (Supp. Table S6). The nonduplicated region of PKD1 (exons 33–46), and PKD2 regions (exons 1–5) were amplified using targeted standard PCR reactions (Supp. Fig. S1), with 100 ng of input genomic DNA with M13 tail primers. The nested and standard PCR amplicons were designed to cover the complete coding regions and splice sites with at least 20 bp of flanking intronic sequences (Supp. Tables S7 and S8). The duplicated part of PKD1, which includes exons 1–32, was amplified using four different LR‐PCR fragments that covered exons 1, 2–13, 14–21, and 22–32, respectively (Supp. Table S6). LR‐PCR amplification was performed using Thermo Scientific (Massachusetts, USA) 2× Extensor Long Range PCR Master Mix on 50 ng of DNA. Then, a nested PCR was carried out on 4 μl 100–250× of diluted product to obtain the final Sanger sequencing fragments. The nested PCR primers with an M13 tail were used to amplify the coding region including 5–20 bp of intronic sequences (Supp. Fig. S1). Large exons such as exon 5, 10, 11, 15, and 23 were amplified using overlapping nested PCR products, although 10 bases of exon 15 (c.6503‐6514) were not covered. Nested PCR and standard PCR of the nonduplicated part of PKD1, and PKD2, was carried out in a final volume of 15 μl in GoTaq Colorless Taq Reaction buffer with 0.6 U of Taq DNA polymerase (Promega, Leiden, Netherlands) at a final concentration 5 pM for each primer, 200 μM of each dNTP. After a hot start at 95°C, a denaturation was performed for 5 min at 95°C, followed by 35 cycles of 45 sec at 94°C, 45 sec at 60°C, and 30 sec at 72°C. The final extension was of 5 min at 72°C in a T‐Professional Thermocycler (Biometra, Göttingen, Germany; Westburg, Leusden, Netherlands). All liquid handling steps were automated using the SciClone (ALH‐HV96 pipetting station; Perkin Elmer, Massachusetts, USA) or Biomek FX workstation (Beckman‐Coulter, Woerden, Netherlands). PCR products (20–50 ng) were purified using an Ampure XP PCR purification kit and sequenced using BigDye Terminator v3.1 sequencing reactions (Applied Biosystems, California, USA) with PAGE purified –21M13 or M13REV sequencing primer. The excess of dye terminatiors was removed by gel filtration using the Edge Biosystem Dye Terminator Removal (DTR) with a 96‐well plate. After electrophoresis on an ABI Prism 3730 (XL) DNA analyzer (Life technologies, California, USA; Applied Biosystems, California, USA), data processing was automated using SeqPatient software (Sequence Pilot, JSI Medical Systems GMbH, Ettenheim, Germany).
3.1.2. MLPA
To detect large deletions and duplications, two commercially available MLPA kits (P351‐B2 and P352‐C1; MRC‐Holland, Amsterdam, The Netherlands) were used following manufacturer's protocols and manuals.
3.2. Comparative analysis of SMRT sequencing and current ADPKD diagnostic assay
The overlap between identified variants based on PacBio and Sanger sequencing data was achieved by assessing identical standardized HGVS descriptions. Only variants with predicted effects on coding DNA or splice‐site regions were considered (Supp. Table S5). PacBio and Sanger variants were manually inspected to detect overlapping variants with discordant descriptions between the two datasets. To facilitate interpretation, each unique variant was further annotated with its PKDB clinical significance, single‐nucleotide polymorphism database version 144 (dbSNP) identifier, and the number of patients where it was detected in the cohort. Surrounding bases were evaluated to identify and remove potential sequencing artifacts occurring in homopolymer stretches. Finally, variants were considered as high‐confident variants if previously reported in PKDB or dbSNP, showed strong PacBio sequencing evidence of being present, or detected in any patient by both Sanger and PacBio sequencing.
3.3. Short‐read loss of power for known PKD1 pathogenic variants in WGS and WES
Previously known pathogenic variants for PKD1 gene were obtained from PKDB. Only variants that were classified as “definitely pathogenic” were selected for further analysis. Large deletions (few hundred bp to several Kbp long) were excluded from the analysis as they are not usually detected with common variant calling algorithms. For the genomic position of each pathogenic variant, sequencing depth was extracted from nine publicly available WGS and WES datasets (Sun et al., 2015). In addition, we included the sequencing depth of nine randomly selected libraries from the study of Rossetti et al. (2012), in which the authors used a similar strategy based on LR‐PCR and followed by short‐read sequencing. Each library represents an equimolar pool of DNA from four different patient samples that were not possible to further demultiplex because individuals were not barcoded. Variant positions with low sequencing depth (<8 reads, or <32 for the short‐read LR‐PCR approach) were marked as inaccessible positions of clinical significance using BedTools v2.25.0. Finally, variant positions were classified into three categories based on the number of individuals with poor coverage at each position: (1) variants with sufficient coverage in all nine individuals; (2) variants reported inaccessible in two to four individuals; and (3) variants reported inaccessible in five or more individuals.
3.4. Data availability
Sequencing data and alignments in BAM format can be accessed through the European Genome‐phenome Archive (EGA), as well as raw variants in VCF file format, under the EGA study identifier EGAS00001002106. Coding or splice‐site variants were also uploaded to the Leiden Open Variation Database (LOVD). Description and examples of custom scripts used in this manuscript are accessible upon request from a local GitLab repository.
4. RESULTS
4.1. Targeted sequencing of ADPKD genes
Direct sequencing of LR‐PCR fragments (designed to specifically and uniquely amplify PKD1, and PKD2 gene regions) (Supp. Fig. S1; Supp. Table S1) was performed to evaluate the utility of long‐read sequencing in resolving ADPKD for molecular diagnostics. All PKD1 and PKD2 exons (including the duplicated part of PKD1, as well as 20 bp of flanking intron regions) from 19 ADPKD patients could be completely covered using long reads, sequenced on the PacBio RSII platform (Fig. 2; Supp. Fig. S2). Most of the long reads (94.4%) were uniquely mapped to PKD1 and PKD2 (Supp. Table S2). Reads originating from residual off‐target amplification (5.6%; Supp. Table S2) introduced during the LR‐PCR steps were identified, and discriminated, by their unique alignment to the PKD1 pseudogenes (Fig. 2; Supp. Table S2). All PKD1 and PKD2 protein coding and flanking intron sequences (±20 bp) were covered at average sequencing depth ≥421× (minimum ≥19×; maximum 1,528×), with ≥97.36% of bases over ≥30×, which was well above the applied threshold of ≥15× reads (Supp. Tables S2 and S4). Amplicons that cover the first and last exons of PKD1 were underrepresented when compared with other LR‐PCR fragments, with a total of ≥593 average reads (minimum ≥300; maximum 1,580) and ≥87 (minimum ≥35; maximum 153) for PKD1 fragments A and E, respectively (Fig. 2B; Supp. Table S3). The usually difficult to sequence first exons of both PKD1 and PKD2 genes were covered, on average ≥55× (minimum ≥24×; maximum 91×) and ≥71× (minimum ≥43×; maximum 111×), respectively (Supp. Table S4). Most of the sequenced reads (>99.9%) were uniquely mapped to PKD1 and PKD2 (Fig. 2B; Supp. Fig. S2).
Figure 2.
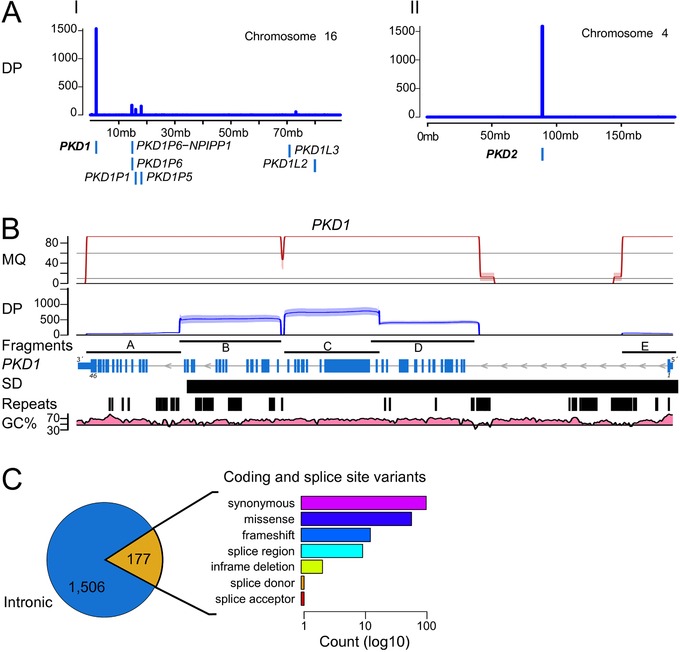
SMRT sequencing and variant calling of LR‐PCR amplicons. A: Sequencing depth (DP; in number of reads) of the alignments to chromosome 16 and chromosome 4. Number of uniquely aligned reads (y axis, blue line) sequenced with PacBio that mapped to PKD1 and PKD2. Off‐target amplification is discriminated from the main PKD1 gene sequences showing alignments to pseudogene homologous sequences at proximal loci (e.g., PKD1P1, PKD1P5, PKD1P6) (blue boxes). B: Mapping quality (MQ; in Phred quality scores; values >90 were scaled down for visualization purposes), and sequencing depth (DP; in number of reads) of uniquely aligned molecules to PKD1 (NM_001009944.2) for the five LR‐PCR fragments amplified. Mapping quality of alignments with even coverage distribution along the amplified fragments (fragments), including regions with SDs, repetitive elements (repeats), and high GC content (GC%). Despite fragments A and E showing lower coverage, compared with the average sequencing depth of ≥421× (minimum ≥19×; maximum 1,528×), they had sufficient coverage for variant calling within the exon regions, including the first exons of PKD1, with average coverage of ≥55× (minimum ≥24×; maximum 91×) (Supp. Table S4). C: We detected 1,506 intron variants (blue) and 177 coding or splice‐site variants (yellow). The predicted transcript effects of coding and splice‐site variants were quantified (bar chart) as log10 count (x axis)
4.2. Sensitive detection of ADPKD small variants
PKD1 is known to be a highly polymorphic gene with many variants reported in addition to the disease‐causing or pathogenic variants (Gout et al., 2007). Hence, the required sensitivity to resolve PKD1 was achieved by the combination of variant calling using Quiver and the reconstruction of amplified allelic sequences. Overall, we identified 1,683 variants (404 SNVs) across 19 ADPKD patients, from which 177 variants (119 SNVs) were located in coding or splice‐site regions (Fig. 2C). Variants were distributed along PKD1 (Supp. Fig. S3A) including regions with large SDs and high GC content. The mismatch rate of PacBio data was empirically assessed based on average frequency of mismatches at each position. We observed an average of 1.2% mismatch rate across the entire PKD1 gene (Supp. Fig. S3A). This correlates with the random sequencing mismatch rate of 1% for PacBio, and thus the applied minimum frequency threshold of 10% for substitutions is well above the observed noise introduced by random PacBio errors.
4.3. Large deletions in PKD1
Detection of allele dropouts and large deletions in PKD1 was assessed by performing a LoH analysis for each of the amplified regions (Fig. 3). We identified 17 LR‐PCR fragments with LoH among all 19 patients sequenced. Most of LoH regions (10) were identified in fragment E (Fig. 3). Only two patients showed consecutive LoH fragments indicating the presence of large deletions spanning between two or more LR‐PCR fragments. These consecutive LoH fragments are not a direct identification of the deletions per se but an indication of the presence of large deletions in the amplified region. The two patients that showed two or more consecutive fragments with LoH (Fig. 3) were in concordance with large deletions identified by MLPA as pathogenic variants in the same ADPKD patients. A deletion of ≥1,543 bp (c.(2097+1_2098‐1)_3640del; exons 11–15) and a deletion of ≥9,108 bp (c.(287+1_288‐1)_(9397+1_9398‐1)del; exons 3–26) were detected by MLPA for patient sample 7 and 13, respectively. With the current experimental design, however, the exact location of the breakpoints for each large deletion could not be determined with either method.
Figure 3.
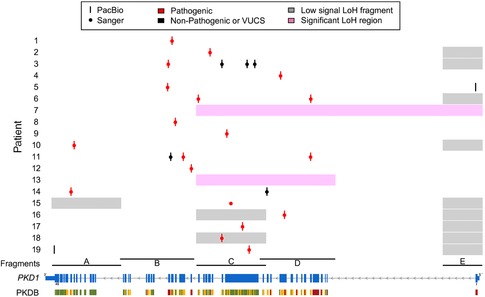
Comparison of long‐read detected pathogenic variants or VUCS, uniquely identified per patient (y axis), with the screening results for the PKD1 gene locus (x axis; NM_001009944.2). Most of the pathogenic variants (red) could be confirmed by our long‐read strategy (red bars) with high sensitivity for PKD1. Only a single insertion could not be confirmed for patient 16. Other identified nonpathogenic variants or VUCS are shown as black bars and dots for PacBio and Sanger, respectively. The LoH analysis performed (pink or gray boxes) support the presence of the two large deletions also reported by MLPA (pink boxes). LoH regions are not a direct identification of large deletions but a clear indication of their presence within the amplified LR‐PCR fragments
4.4. Comparative analysis between SMRT‐Seq and the ADPKD diagnostic assay
The evaluation of 167 coding or splice‐site variants identified by standard ADPKD diagnostic assay showed that 159 out of 167 were correctly detected by PacBio (Supp. Fig. S3C). The overall observed sensitivity and specificity in detecting coding variants was of 95.2% (159/167) and 88.8% (159/179), respectively. Eight variants were solely detected by Sanger (Supp. Fig. S3A: crosses), from which, despite the high sequencing depth, the majority (6/8) had low number of reads supporting the presence of these variants in PacBio sequencing data with variant frequency below the applied frequency thresholds (Supp. Fig. S3B: yellow dots). The remaining 2/8 variants (Supp. Fig. S3B: red dots) constitute a pathogenic insertion (c.6223_6224insTT) and one polymorphic substitution (c.12630T > C) (Supp. Table S9; Supp. Fig. S4).
From 179 variants detected by PacBio, 20 were solely identified by PacBio (Supp. Fig. S3C; Supp. Table S9). Of these, 17/20 were high‐confident variants not detected in Sanger. The remaining 3/20 were low‐confidence variants from the reconstruction of allelic sequences for the variant c.6657_6671del (Supp. Table S9).
The sensitivity assessment for PKD1 pathogenic variants was performed by comparing the list of potentially pathogenic variants and VUCS, uniquely identified by our direct long‐read sequencing approach, with the results from the standard ADPKD diagnostic assay. Although we expected a single dominant pathogenic variant per patient, two of the patients had a combination of two pathogenic variants resulting in 21 PKD1 pathogenic variants. We identified 20 out of 21 pathogenic variants (95.2%) in addition to seven VUCS from which two were uniquely detected by PacBio (Table 1; Fig. 3). Only a single pathogenic insertion (c.6223_6224insTT) was missed by PacBio variant calling despite sufficient read support (43.3% variant frequency; read depth 1,203) (Table 1). In summary, 18 out of 19 ADPKD patients could be resolved by our method (Fig. 3). This provided a diagnosis for 94.7% of the patients, resulting in the correct detection of all PKD1 substitutions, single‐nucleotide deletions, large deletions, one delin, and three out of four insertions or duplications (Table 1).
Table 1.
Uniquely identified pathogenic variants or variants of unknown clinical significance identified by PacBio sequencing
| Patient | Genomic position | Exon | c. notation | p. notation | SNP ID | Freq (%) | Depth | PolyPhen | VEP impact | Comparison with Sanger sequencing | |
|---|---|---|---|---|---|---|---|---|---|---|---|
| 1 | chr16 | 2,152,543 | 25 | c.9034_9039del | p.(Thr3012_Ser3013del) | 40.9 | 314 | Moderate | Overlap | ||
| 2 | chr16 | 2,156,674 | 18 | c.7214G > T | p.(Trp2405Leu) | 29.4 | 666 | Probably damaging (0.983) | Moderate | Overlap | |
| 3 | chr16 | 2,161,525 | 15 | c.3643C > G | p.(Leu1215Val) | rs144338515 | 49.2 | 576 | Possibly damaging (0.899) | Moderate | Overlap |
| 3 | chr16 | 2,160,693 | 15 | c.4475G > C | p.(Arg1492Pro) | 32.8 | 563 | Possibly damaging (0.665) | Moderate | Overlap | |
| 3 | chr16 | 2,157,963 | 16 | c.6986G > A | p.(Arg2329Gln) | rs575211353 | 43.3 | 538 | Benign (0.37) | Moderate | Overlap |
| 3 | chr16 | 2,152,134 | 26 | c.9324del | p.(Ile3109SerfsTer207) | rs780284643 | 26 | 302 | High | Overlap | |
| 4 | chr16 | 2,164,333 | 11 | c.2681_2690del | p.(Phe894Ter) | 53.7 | 143 | High | Overlap | ||
| 5 | chr16 | 2,185,509 | 1 | c.182C > T | p.(Pro61Leu) | 28.8 | 43 | Benign (0.119) | Moderate | PacBio | |
| 5 | chr16 | 2,152,061 | 26 | c.9397 + 1G > A | 23.3 | 330 | High | Overlap | |||
| 6 | chr16 | 2,167,614 | 6 | c.1261C > T | p.(Arg421Cys) | 38.7 | 273 | Possibly damaging (0.836) | Moderate | Overlap | |
| 6 | chr16 | 2,155,399 | 21 | c.7940C > T | p.(Thr2647Met) | rs748496650 | 44 | 357 | Probably damaging (1) | Moderate | Overlap |
| 7 | chr16 | 2,161,527 | c.(2097 + 1_2098‐1)_3640del | PacBio | |||||||
| 8 | chr16 | 2,152,903 | 24 | c.8859dup | p.(Glu2954Ter) | 44.1 | 583 | High | Overlap | ||
| 9 | chr16 | 2,158,496 | 15 | c.6657_6671del | p.(Arg2220_Pro2224del) | 41.5 | 466 | Moderate | Overlap | ||
| 10 | chr16 | 2,141,910 | 40 | c.11412‐3C > A | 27.7 | 20 | Low | Overlap | |||
| 11 | chr16 | 2,167,589 | 6 | c.1286G > T | p.(Trp429Leu) | 32.7 | 313 | Probably damaging (0.999) | Moderate | Overlap | |
| 11 | chr16 | 2,153,765 | 23 | c.8293C > T | p.(Arg2765Cys) | CM092156 rs144979397 | 41.1 | 572 | Probably damaging (0.988) | Moderate | Overlap |
| 11 | chr16 | 2,152,396 | 25 | c.9187C > T | p.(Arg3063Cys) | rs145906459 | 36.1 | 557 | Benign (0.39) | Moderate | Overlap |
| 12 | chr16 | 2,154,643 | 21 | c.8017‐2_8017‐1del | 48.5 | 527 | High | Overlap | |||
| 13 | chr16 | 2,152,062 | c.(287 + 1_288‐1)_(9397 + 1_9398‐1)del | PacBio | |||||||
| 14 | chr16 | 2,141,581 | 42 | c.11554del | p.(Leu3852TrpfsTer93) | rs724159823 | 41.3 | 46 | High | Overlap | |
| 14 | chr16 | 2,162,850 | 13 | c.3100A > G | p.(Asn1034Asp) | rs369180760 | 36.5 | 321 | Benign (0.098) | Moderate | Overlap |
| 15 | chr16 | 2,158,944 | 15 | c.6223_6224insTT | p.(Arg2075LeufsTer42) | 43.3 | 1,203 | High | Sanger | ||
| 16 | chr16 | 2,164,754 | 11 | c.2269del | p.(Gln757SerfsTer28) | rs775710328 | 28.4 | 519 | High | Overlap | |
| 17 | chr16 | 2,160,198 | 15 | c.4968_4969delinsC | p.(Arg1657GlyfsTer65) | 41.2 | 1,120 | High | Overlap | ||
| 18 | chr16 | 2,157,954 | 16 | c.6994_7000dup | p.(Ala2332GlyfsTer90) | 23.4 | 913 | High | Overlap | ||
| 19 | chr16 | 2,139,750 | 46 | c.12890A > G | p.(Lys4297Arg) | rs758833703 | 14.1 | 46 | Benign (0.07) | Moderate | PacBio |
| 19 | chr16 | 2,160,919 | 15 | c.4248dup | p.(Gly1417TrpfsTer14) | 24.8 | 979 | High | Overlap | ||
Notes:. Sanger‐detected pathogenic variants are shown in bold. PacBio variants were filtered by coding sequence predicted effects (frameshifts, missense, in‐frame deletions, and splicing variants), as well as DP>15 and >50 subreads, and variant frequency (>10% for substitutions, and >15% for insertions and deletions) (RefSeq NM_001009944.2).
Additional information of each variant including SIFT classification, and 1000G frequencies among other annotations can be obtained from the VCF files uploaded to EGA with accession number EGAS00001002106.
4.5. Loss of PKD1 diagnostic power in short‐read (Illumina) NGS
The potential loss of diagnostic power when resolving PKD1 by short‐read NGS was evaluated based on 797 pathogenic variants that were previously reported and validated, and are publicly available in PKDB. The repetitive nature of PKD1 gene hampers proper alignment of short Illumina NGS reads (Supp. Fig. S5). Over 12% of the reported pathogenic variants would have been missed in WGS and WES data purely due to poor sequencing depth (Supp. Fig. S6). In comparison, other short‐read approaches based on LR‐PCR enrichment show lower percentage (1.3%) of reported pathogenic variants that would have been missed because of low sequencing depth. However, this approach required very high sequencing depth, which can be appreciated from the observed high variability in coverage ranging from <8× to >30,000× (Supp. Fig. S6). Moreover, several exonic regions may be expected to be missed in many samples, irrespective of the short‐read sequencing strategy used (Supp. Fig. S6).
5. DISCUSSION
Accurate diagnosis is a difficult task when performed in complex genetic regions such as PKD1 (Qi et al., 2013; Rossetti et al., 2007; Tan et al., 2009). To facilitate the diagnosis, we have developed and applied a new methodology using direct long‐read sequencing of amplified LR‐PCR fragments on PacBio. Because of the repetitive nature of PKD1, current diagnostics is performed by Sanger sequencing using LR‐PCR fragments generated for approximately two thirds of the PKD1 gene that serve as a template for the exon‐specific nested PCR amplification. In contrast, in this study, we directly sequenced all LR‐PCR fragments amplified from the duplicated and unique parts of PKD1 gene as well as PKD2. On top of reducing the PCR amplification steps required and limiting the implicit PCR artifacts, single‐molecule sequencing improves sequence alignments and aids in discriminating between homologous or repeated sequences, such as PKD1 pseudogenes. This provides a cleaner dataset for variant calling, free of chimeric (0.85%) and pseudogene (5.6%; Supp. Table S2) reads that are introduced by the LR‐PCR amplification. Finally, by using this approach, we identified 20 out of 21 (95.2%) PKD1 disease‐causing variants diagnosed by Sanger sequencing or MLPA, providing a correct diagnosis for 18 out of 19 ADPKD patients (94.7%) with at least one pathogenic variant in PKD1.
In comparison to current ADPKD diagnostic assays, based on Sanger sequencing and MLPA, we show that direct long‐read sequencing can aid in resolving PKD1 for ADPKD diagnostics. Longer sequencing reads discriminate between PKD1 and pseudogenes (Fig. 2A), and improve the mapping quality of PKD1 (Fig. 2B). The improved mappability reduced the interference of homologous sequences, high GC content, or repetitive elements for ADPKD diagnosis (Qi et al., 2013). This allowed us to develop a long‐read‐based sequencing assay for detecting a broad spectrum of variants, from SNVs to large deletions (Table 1). In contrast, Sanger sequencing is very labor‐intensive and requires many phases of overlapping PCR amplification steps prior to sequencing, including LR‐PCR and nested PCR. Despite the amplification of PKD1 being based on unique PCR primers, these are of limited number for PKD1 and have been shown to produce residual amplification of homologous regions that would still interfere with the aggregated signal of Sanger sequencing (Rossetti et al., 2012; Tan et al., 2014). Based on our approach, we confirmed the presence of residual amplification of PKD1 pseudogenes, introduced by the LR‐PCR (5.6%) (Fig. 2A; Supp. Table S2). This, most likely, led to the identification of 24 false‐positive or false‐negative variants detected by Sanger sequencing (Supp. Table S9; Supp. Fig. S4). One of the major drawbacks of our method, however, is the noise associated with PacBio sequencing, and the sophisticated algorithms required to overcome it. This noise is likely to be the cause of most of the 324 homopolymer deletion artifacts that were solely identified by PacBio (Supp. Table S10). In addition, this noise was the most likely cause of the single pathogenic insertion that was missed despite ample sequencing depth. However, based on a recent release of the new circular consensus calling algorithm for PacBio sequencing data (www.pacb.com: “An improved circular consensus algorithm with an application to detect HIV‐1 drug‐resistance associated with mutations (DRAMS)”), we expect that calling of true homopolymer‐associated variants will be significantly improved.
In recent years, several attempts have been made to replace the standard ADPKD diagnostics by NGS approaches that would improve the screening of PKD1 gene (Eisenberger et al., 2015; Mallawaarachchi et al., 2016; Qi et al., 2013; Rossetti et al., 2012; Tan et al., 2014; Trujillano et al., 2014). These screenings were based on analyzing WGS or WES data (Mallawaarachchi et al., 2016; Qi et al., 2013), on the enrichment of PKD1 using LR‐PCR (Rossetti et al., 2012; Tan et al., 2014), or the hybridization capture of PKD1 (Eisenberger et al., 2015; Trujillano et al., 2014). Two of these studies were performed on short‐read NGS using targeted enrichment of PKD1 or PKD2 genes by LR‐PCR (Rossetti et al., 2012; Tan et al., 2014). In both studies, the use of short reads was the source of difficulties associated with misalignments and lack of sufficient coverage, such as the PKD1 exon 1 region (Tan et al., 2014), as well as false‐positive (10%) and false‐negative variant calls (5%) (Rossetti et al., 2012). We show that these challenges were mitigated with long‐read sequencing that provided 100% coverage >10× (minimum >19×; average >421×; maximum 1,528×) for all PKD1 and PKD2 exons and flanking intron regions (±20 bp) (Supp. Tables S2 and S4), including 100% of PKD1 exon 1 at average coverage of >55× (±20 bp of flanking intron regions included) (Supp. Table S4). Other WES‐based strategies were reported to resolve only 50% of true‐positive variants in the duplicated regions of PKD1 (Qi et al., 2013). It was argued that increasing the sequencing depth was insufficient to overcome the limitations and pitfalls of short‐read NGS approaches (Eisenberger et al., 2015; Qi et al., 2013). Similar to these short‐read NGS strategies (Eisenberger et al., 2015; Mallawaarachchi et al., 2016; Qi et al., 2013; Rossetti et al., 2012; Tan et al., 2014; Trujillano et al., 2014), our targeted approach combined with multiplexed sequencing can further accelerate ADPKD diagnostics, compared with the labor‐intensive Sanger sequencing (Rossetti et al., 2012; Tan et al., 2014). Despite the rather limited sample size, sufficient numbers were included in this study for a methodology evaluation. However, future studies including larger cohorts would be needed to reliably implement the proposed methodology into the clinic. In addition, our method can benefit from recent advancements in library preparation methods with minimal or no amplification, such as single‐strand adaptor ligation (Karlsson et al., 2015), which would eliminate most of the biases introduced during LR‐PCR amplification steps (Hestand, Houdt, Cristofoli, & Vermeesch, 2016; Laver et al., 2016; Schirmer et al., 2015). Overall, our method provides high sensitivity in identifying PKD1 genetic variants when compared with the standard ADPKD diagnostic assay and showed an added value to become a reliable alternative. In addition, the method presented here is comparable to other Illumina short‐read NGS‐based approaches. However, further studies including a larger cohort may be required to decipher the true diagnostic power of our approach compared with that of standard ADPKD diagnostic assays using Sanger and MLPA, and to Illumina short‐read NGS‐based methods.
In conclusion, we showed that direct sequencing of LR‐PCR fragments for the screening of ADPKD patients in a single diagnostic test application is now possible. Accurate screening of PKD1 with high sensitivity and low interference of homologous sequences constitutes a clear example. This method is highly valuable for a diagnostic setting, as it increases the resolution power of clinically relevant but difficult to sequence or to resolve genomic regions.
Supporting information
Supplementary Information
ACKNOWLEDGMENTS
This study was performed within the scope of the iMODE‐CKD Initial Training Network (ITN) (Clinical and system‐omics for the identification of the Molecular Determinants of established Chronic Kidney Disease).
Data obtained from Rossetti et al. (2012) was kindly provided by Peter C. Harris and Christina M. Heyer (Mayo Clinic College of Medicine).
Patient samples were kindly provided by the DIPAK Consortium, an interuniversity collaboration in The Netherlands, established to study ADPKD and to develop rational treatment strategies for this disease (www.nierstichting.nl/dipak). Principal investigators are (in alphabetical order): J. P. H. Drenth (Department of Gastroenterology and Hepatology, Radboud University Medical Center Nijmegen), J. W. de Fijter (Department of Nephrology, Leiden University Medical Center), R. T. Gansevoort (Department of Nephrology, University Medical Center Groningen), D. J. M. Peters (Department of Human Genetics, Leiden University Medical Center), J. Wetzels (Department of Nephrology, Radboud University Medical Center Nijmegen), and R. Zietse (Department of Internal Medicine, Erasmus Medical Center Rotterdam).
We acknowledge the continued support of Joost P. Schanstra (Inserm; Université Toulouse III Paul Sabatier, Institut de Médicine Moléculaire de Rangueil).
DISCLOSURE STATEMENT
The authors declare no conflict of interest.
Borràs DM, Vossen R, Liem M, et al. Detecting PKD1 variants in polycystic kidney disease patients by single‐molecule long‐read sequencing. Human Mutation. 2017;38:870–879. https://doi.org/10.1002/humu.23223
Contract grant sponsor: European Union's Seventh Framework Programme FP7/2007‐2013 (FP7‐PEOPLE‐2013‐ITN‐608332).
Communicated by Graham R. Taylor
REFERENCES
- Barua, M. , Cil, O. , Paterson, A. D. , Wang, K. , He, N. , Dicks, E. , … Pei, Y. (2009). Family history of renal disease severity predicts the mutated gene in ADPKD. Journal of the American Society of Nephrology, 20, 1833–1838. [DOI] [PMC free article] [PubMed] [Google Scholar]
- Chaisson, M. J. , & Tesler, G. (2012). Mapping single molecule sequencing reads using basic local alignment with successive refinement (BLASR): Application and theory. BMC Bioinformatics, 13, 238. [DOI] [PMC free article] [PubMed] [Google Scholar]
- Chaisson, M. J. P. , Huddleston, J. , Dennis, M. Y. , Sudmant, P. H. , Malig, M. , Hormozdiari, F. , … Stamatoyannopoulos, J. A. (2015). Resolving the complexity of the human genome using single‐molecule sequencing. Nature, 517, 608–611. [DOI] [PMC free article] [PubMed] [Google Scholar]
- Chang, F. , & Li, M. M . (2013). Clinical application of amplicon‐based next‐generation sequencing in cancer. Cancer Genetics, 206, 413–419. [DOI] [PubMed] [Google Scholar]
- Codina‐Solà, M. , Rodríguez‐Santiago, B. , Homs, A. , Santoyo, J. , Rigau, M. , Aznar‐Laín, G. , … Antiñolo, G. (2015). Integrated analysis of whole‐exome sequencing and transcriptome profiling in males with autism spectrum disorders. Molecular Autism, 6, 21. [DOI] [PMC free article] [PubMed] [Google Scholar]
- den Dunnen, J. T. , Dalgleish, R., Maglott, D. R. , Hart, R. K. , Greenblatt, M. S. , McGowan‐Jordan, J. , … Taschner, P. E. M . (2016). HGVS recommendations for the description of sequence variants: 2016 update. Human Mutation, 37, 564–569. [DOI] [PubMed] [Google Scholar]
- de Ligt, J. , Willemsen, M. H. , van Bon, B. W. M. , Kleefstra, T. , Yntema, H. G. , Kroes, T. , … Hoischen, A. (2012). Diagnostic exome sequencing in persons with severe intellectual disability. The New England Journal of Medicine, 367, 1921–1929. [DOI] [PubMed] [Google Scholar]
- Dewey, F. E. , Grove, M. E. , Pan, C. , Goldstein, B. A. , Bernstein, J. A. , Chaib, H. , … Ormond, K. E. (2014). Clinical interpretation and implications of whole‐genome sequencing. JAMA, 311, 1035. [DOI] [PMC free article] [PubMed] [Google Scholar]
- Eisenberger, T. , Decker, C. , Hiersche, M. , Hamann, R. C. , Decker, E. , Neuber, S. , … Mache, C. (2015). An efficient and comprehensive strategy for genetic diagnostics of polycystic kidney disease. PLoS One, 10, e0116680. [DOI] [PMC free article] [PubMed] [Google Scholar]
- Gout, A. M. , Martin, N. C. , Brown, A. F. , & Ravine, D. (2007). PKDB: Polycystic kidney disease mutation database—A gene variant database for autosomal dominant polycystic kidney disease. Human Mutation, 28, 654–659. [DOI] [PubMed] [Google Scholar]
- Guo, X. , Zheng, S. , Dang, H. , Pace, R. G. , Stonebraker, J. R. , Jones, C. D. , … Seibold, M. A. (2013). Genome reference and sequence variation in the large repetitive central exon of human muc5ac. American Journal of Respiratory Cell and Molecular Biology, 50, 223–232. [DOI] [PMC free article] [PubMed] [Google Scholar]
- Harris, P. C. , & Rossetti, S . (2010). Molecular diagnostics for autosomal dominant polycystic kidney disease. Nature Reviews Nephrology, 6, 197–206. [DOI] [PMC free article] [PubMed] [Google Scholar]
- Hestand, M. S. , Houdt, J. V. , Cristofoli, F. , & Vermeesch, J. R. (2016). Polymerase specific error rates and profiles identified by single molecule sequencing. Mutation Research/Fundamental and Molecular Mechanisms of Mutagenesis, 784–785, 39–45. [DOI] [PubMed] [Google Scholar]
- Karlsson, K. , Sahlin, E. , Iwarsson, E. , Westgren, M. , Nordenskjöld, M. , & Linnarsson, S. (2015). Amplification‐free sequencing of cell‐free DNA for prenatal non‐invasive diagnosis of chromosomal aberrations. Genomics, 105, 150–158. [DOI] [PubMed] [Google Scholar]
- LaDuca, H. , Stuenkel, A. J. , Dolinsky, J. S. , Keiles, S. , Tandy, S. , Pesaran, T. , … Speare, V. (2014). Utilization of multigene panels in hereditary cancer predisposition testing: Analysis of more than 2,000 patients. Genetics Medicine, 16, 830–837. [DOI] [PMC free article] [PubMed] [Google Scholar]
- Laver, T. W. , Caswell, R. C. , Moore, K. A. , Poschmann, J. , Johnson, M. B. , Owens, M. M. , … Weedon, M. N. (2016). Pitfalls of haplotype phasing from amplicon‐based long‐read sequencing. Scientific Reports, 6, 21746. [DOI] [PMC free article] [PubMed] [Google Scholar]
- Lee, H. , & Schatz, M. C . (2012). Genomic dark matter: The reliability of short read mapping illustrated by the genome mappability score. Bioinformatics, 28, 2097–2105. [DOI] [PMC free article] [PubMed] [Google Scholar]
- Loomis, E. W. , Eid, J. S. , Peluso, P. , Yin, J. , Hickey, L. , Rank, D. , … Hagerman, P. J . (2013). Sequencing the unsequenceable: Expanded CGG‐repeat alleles of the fragile X gene. Genome Research, 23, 121–128. [DOI] [PMC free article] [PubMed] [Google Scholar]
- Mallawaarachchi, A. C. , Hort, Y. , Cowley, M. J. , McCabe, M. J. , Minoche, A. , Dinger, M. E. , … Furlong, T. J. (2016). Whole‐genome sequencing overcomes pseudogene homology to diagnose autosomal dominant polycystic kidney disease. European Journal of Human Genetics, 24, 1584–1590. [DOI] [PMC free article] [PubMed] [Google Scholar]
- Mardis, E. R. (2013). Next‐Generation sequencing platforms. Annual Review of Analytical Chemistry, 6, 287–303. [DOI] [PubMed] [Google Scholar]
- McLaren, W. , Pritchard, B. , Rios, D. , Chen, Y. , Flicek, P. , & Cunningham, F. (2010). Deriving the consequences of genomic variants with the Ensembl API and SNP Effect Predictor. Bioinformatics, 26, 2069–2070. [DOI] [PMC free article] [PubMed] [Google Scholar]
- Oliver, G. R. , Hart, S. N. , & Klee, E. W. (2015). Bioinformatics for clinical next generation sequencing. Clinical Chemistry, 61, 124–135. [DOI] [PubMed] [Google Scholar]
- Ozsolak, F. , & Milos, P. M. (2011). Single‐molecule direct RNA sequencing without cDNA synthesis. Wiley Interdisciplinary Reviews: RNA, 2, 565–570. [DOI] [PMC free article] [PubMed] [Google Scholar]
- Qi, X.‐P. , Du, Z.‐F. , Ma, J.‐M. , Chen, X.‐L. , Zhang, Q. , Fei, J. , … Chen, Z.‐G. (2013). Genetic diagnosis of autosomal dominant polycystic kidney disease by targeted capture and next‐generation sequencing: Utility and limitations. Gene, 516, 93–100. [DOI] [PubMed] [Google Scholar]
- Qiao, W. , Yang, Y. , Sebra, R. , Mendiratta, G. , Gaedigk, A. , Desnick, R. J. , & Scott, S. A. (2016). Long‐read single molecule real‐time full gene sequencing of cytochrome P450‐2D6: Human mutation. Human Mutation, 37, 315–323. [DOI] [PMC free article] [PubMed] [Google Scholar]
- Rossetti, S. , Consugar, M. B. , Chapman, A. B. , Torres, V. E. , Guay‐Woodford, L. M. , Grantham, J. J. , … Thompson, P. A. (2007). Comprehensive molecular diagnostics in autosomal dominant polycystic kidney disease. Journal of the American Society Nephrology, 18, 2143–2160. [DOI] [PubMed] [Google Scholar]
- Rossetti, S. , Hopp, K. , Sikkink, R. A. , Sundsbak, J. L. , Lee, Y. K. , Kubly, V. , … Harris, P. C. (2012). Identification of gene mutations in autosomal dominant polycystic kidney disease through targeted resequencing. Journal of the American Society of Nephrology, 23, 915–933. [DOI] [PMC free article] [PubMed] [Google Scholar]
- Schirmer, M. , Ijaz, U. Z. , D'Amore, R. , Hall, N. , Sloan, W. T. , & Quince, C. (2015). Insight into biases and sequencing errors for amplicon sequencing with the Illumina MiSeq platform. Nucleic Acids Research, 43, e37–e37. [DOI] [PMC free article] [PubMed] [Google Scholar]
- Spithoven, E. M. , Kramer, A. , Meijer, E. , Orskov, B. , Wanner, C. , Abad, J. M. , … Heaf, J. (2014). Renal replacement therapy for autosomal dominant polycystic kidney disease (ADPKD) in Europe: Prevalence and survival—An analysis of data from the ERA‐EDTA Registry. Nephrology Dialysis Transplantation, 29, iv15–iv25. [DOI] [PMC free article] [PubMed] [Google Scholar]
- Steinberg, K. M. , Schneider, V. A. , Graves‐Lindsay, T. A. , Fulton, R. S. , Agarwala, R. , Huddleston, J. , … Eichler, E. E. (2014). Single haplotype assembly of the human genome from a hydatidiform mole. Genome Research, 24, 2066–2076. [DOI] [PMC free article] [PubMed] [Google Scholar]
- Su, Z. , Ning, B. , Fang, H. , Hong, H. , Perkins, R. , Tong, W. , Shi, L . (2011). Next‐generation sequencing and its applications in molecular diagnostics. Expert Review of Molecular Diagnosis, 11, 333–343. [DOI] [PubMed] [Google Scholar]
- Sun, Y. , Ruivenkamp, C. A. L. , Hoffer, M. J. V. , Vrijenhoek, T. , Kriek, M. , van Asperen, C. J. , … Santen, G. W. E. (2015). Next‐generation diagnostics: Gene panel, exome, or whole genome? Human Mutation, 36, 648–655. [DOI] [PubMed] [Google Scholar]
- Tan, A. Y. , Michaeel, A. , Liu, G. , Elemento, O. , Blumenfeld, J. , Donahue, S. , … Rennert, H. (2014). Molecular diagnosis of autosomal dominant polycystic kidney disease using next‐generation sequencing. The Journal of Molecular Diagnostics, 16, 216–228. [DOI] [PMC free article] [PubMed] [Google Scholar]
- Tan, Y.‐C. , Blumenfeld, J. D. , Anghel, R. , Donahue, S. , Belenkaya, R. , Balina, M. , … Rennert, H. (2009). Novel method for genomic analysis of PKD1 and PKD2 mutations in autosomal dominant polycystic kidney disease. Human Mutation, 30, 264–273. [DOI] [PubMed] [Google Scholar]
- Trujillano, D. , Bullich, G. , Ossowski, S. , Ballarín, J. , Torra, R. , Estivill, X. , & Ars, E. (2014). Diagnosis of autosomal dominant polycystic kidney disease using efficient PKD1 and PKD2 targeted next‐generation sequencing. Molecular Genetics Genomic Medicine, 2, 412–421. [DOI] [PMC free article] [PubMed] [Google Scholar]
- Vis, J. K. , Vermaat, M. , Taschner, P. E. M. , Kok, J. N. , & Laros, J. F. J. (2015). An efficient algorithm for the extraction of HGVS variant descriptions from sequences. Bioinformatics, 31, 3751–3757. [DOI] [PubMed] [Google Scholar]
- von Kanel, T. , & Huber, A. R . (2013). DNA methylation analysis. Swiss Medical Weekly, 143, w13799. [DOI] [PubMed] [Google Scholar]
- Wildeman, M. , van Ophuizen, E. , den Dunnen, J. T. , & Taschner, P. E. M. (2008). Improving sequence variant descriptions in mutation databases and literature using the Mutalyzer sequence variation nomenclature checker. Human Mutation, 29, 6–13. [DOI] [PubMed] [Google Scholar]
- Willig, L. K. , Petrikin, J. E. , Smith, L. D. , Saunders, C. J. , Thiffault, I. , Miller, N. A. , … Kingsmore, S. F. (2015). Whole‐genome sequencing for identification of Mendelian disorders in critically ill infants: A retrospective analysis of diagnostic and clinical findings. The Lancet Respiratory Medicine, 3, 377–387. [DOI] [PMC free article] [PubMed] [Google Scholar]
- Yang, Y. , Muzny, D. M. , Reid, J. G. , Bainbridge, M. N. , Willis, A. , Ward, P. A. , … Eng, C. M. 2013. Clinical whole‐exome sequencing for the diagnosis of Mendelian disorders. The New England Journal of Medicine, 369, 1502–1511. [DOI] [PMC free article] [PubMed] [Google Scholar]
Associated Data
This section collects any data citations, data availability statements, or supplementary materials included in this article.
Supplementary Materials
Supplementary Information
Data Availability Statement
Sequencing data and alignments in BAM format can be accessed through the European Genome‐phenome Archive (EGA), as well as raw variants in VCF file format, under the EGA study identifier EGAS00001002106. Coding or splice‐site variants were also uploaded to the Leiden Open Variation Database (LOVD). Description and examples of custom scripts used in this manuscript are accessible upon request from a local GitLab repository.