Abstract
We introduce a general method to transform antibodies into ratiometric, bioluminescent sensor proteins for the no‐wash quantification of analytes. Our approach is based on the genetic fusion of antibody fragments to NanoLuc luciferase and SNAP‐tag, the latter being labeled with a synthetic fluorescent competitor of the antigen. Binding of the antigen, here synthetic drugs, by the sensor displaces the tethered fluorescent competitor from the antibody and disrupts bioluminescent resonance energy transfer (BRET) between the luciferase and fluorophore. The semisynthetic sensors display a tunable response range (submicromolar to submillimolar) and large dynamic range (ΔR max>500 %), and they permit the quantification of analytes through spotting of the samples onto paper followed by analysis with a digital camera.
Keywords: antibodies, bioluminescence, point-of-care monitoring, sensors, therapeutic drug monitoring
The precise and reliable quantification of analytes in point‐of‐care (PoC) settings without the need for specialized instrumentation benefits public health in developed as well as developing countries. One of the challenges in the field is the development of generally applicable approaches to quantify drugs for PoC therapeutic drug monitoring (TDM).1 TDM is mostly based on mass‐spectrometry or antibody‐based immunoassays, both of which require specialized instrumentation or multiple assay steps, thus making their use for PoC applications by non‐expert users problematic.2, 3 Even though the generation of specific antibodies against various analytes is a routine procedure, approaches to transfer the specific binding of antibodies into a signal readout compatible with cheap and portable devices are needed.
We recently introduced a new class of ratiometric and bioluminescent biosensors for PoC TDM.4 These luciferase‐based indicators of drugs (LUCIDs) are comprised of a SNAP‐tag, a blue‐emitting NanoLuc luciferase, and a binding protein for the drug of interest. SNAP‐tag is labeled with a molecule composed of a ligand for the binding protein and a red‐emitting fluorophore suitable for BRET.5, 6, 7 Binding of the drug by the sensor displaces the tethered fluorescent competitor from the binding protein, which disrupts bioluminescent resonance energy transfer (BRET) between the luciferase and the fluorophore and thus shifts the color from red to blue in a drug‐concentration‐dependent manner, thereby permitting the quantification of drugs by spotting samples onto paper, followed by analysis with a digital camera (Figure 1 a). However, up to now, no general strategy exists to identify suitable binding proteins. Here, we demonstrate how antibodies can be used as the binding proteins in LUCIDs, thereby establishing a general design principle for PoC‐compatible biosensors towards a basically unlimited number of analytes. Antibodies have three features that make them ideal binding proteins for LUCIDs: 1) all antibodies share a common three‐dimensional structure, which removes the need to optimize the sensor geometry for each individual senor; 2) the generation of antibodies against antigens of interest, including small molecules, is a routine procedure; 3) small‐molecule antigens need to be tethered to a carrier via a linker for antibody generation, thereby automatically providing a tethered ligand for sensor generation.
Figure 1.
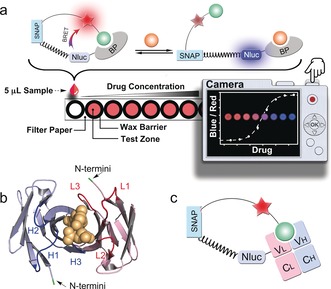
The design of LUCIDs for PoC diagnostics. a) Schematic representation of the paper‐based device. The LUCID is a fusion protein of SNAP‐tag, NanoLuc luciferase (NLuc), and a binding protein (BP). SNAP‐tag is labeled with a molecule containing a fluorophore (red star) and a ligand (green ball) that binds to BP. The filter paper was printed with wax circles and the signal was collected by a digital camera. b) The variable fragment of the methotrexate antibody (PDB ID: 4OCX) bound to methotrexate (yellow). The N‐termini of both chains are indicated in green. The three CDRs (H1‐3, blue) on the heavy chain (light blue) and three CDRs (L1‐3, red) on the light chain (pink) are involved in antigen binding. c) In Fab‐based LUCIDs, the binding protein is an antibody Fab fragment. SNAP‐tag and NanoLuc are attached to the light chain.
To generate antibody‐based LUCIDs, we focused on the antigen‐binding (Fab) fragment of antibodies. Fabs, which contain the complementary‐determining regions (CDRs) of antibodies, can be expressed as fusion proteins and are monovalent.8, 9, 10 The latter fact facilitates their use as LUCIDs. The N termini of both the heavy and light chains are in close proximity to the binding site, which should result in high BRET in the closed state of the biosensor (Figure 1 b). The CDR loop 3 of both chains are close to the respective N termini of each chain, but CDR H3s generally show much more variation in both length and space.11, 12, 13 In order to make the approach as general as possible, we therefore decided to attach SNAP‐tag and NanoLuc luciferase to the light chain of the Fab fragment (Figure 1 c). A rigid proline linker (Pro30) was introduced between SNAP‐tag and NanoLuc to lower the BRET efficiency in the open state of the sensor by increasing the distance between NanoLuc and the tethered fluorophore.14 We validated our design principle by generating Fab‐based sensor proteins for three distinct drugs, methotrexate, theophylline and quinine (Figure 2),15 and used the sensors for paper‐based PoC quantification of drug levels in human serum and blood samples.
Figure 2.
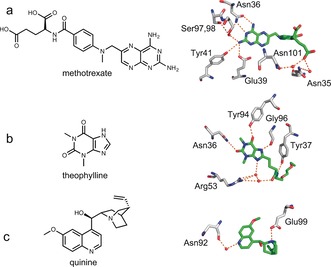
Antibody‐binding of methotrexate (a), theophylline (b), and quinine (c). The chemical structures of the three drugs are shown on the left. The crystal structures of antibodies with the methotrexate (PDB ID: 4OCX), theophylline derivative (PDB ID: 5BMF), and quinine (PDB ID: 4UIN) were superimposed, showing the interactions of the residues with the ligands (carbon atoms in green). Extensive hydrogen bonding (dotted orange lines) links the three antigens to the antibodies, either directly or via water molecules (red balls).
The response range of LUCIDs can be tuned by modifying the tethered ligand. When raising antibodies against small molecules, the affinity for the tethered molecule is usually higher than that for the free small molecule. The effective molarity of tethered ligands in our sensors can be estimated to be around 100 μm. Assuming that the same tethered molecule would be used for antibody and LUCID generation, the response range for antibody‐based LUCIDs would be more than 100 μm and therefore above the therapeutic concentration of most drugs. We show here how modification of the structure of the tethered ligand or mutagenesis of the antibody binding site permits lowering of the response range of LUCIDs to the nanomolar range. Taking advantage of structural information on the antibody–drug interactions (Figure 2),16, 17, 18 we prepared two tethered ligands for each sensor protein (Figure 3). For the methotrexate LUCID, we first decreased the picomolar binding affinity of the antibody towards methotrexate by introducing the mutation N36S on the heavy chain of the anti‐methotrexate Fab. The first tethered ligand (MTX1, Figure 3) for the methotrexate LUCID was then generated by attaching an ethylene glycol linker directly to 4‐amino‐4‐deoxy‐N‐methylpteroic acid (DAMPA), thereby removing hydrogen bonding between the glutamic acid of methotrexate and two asparagine residues of the antibody. For the second tethered ligand (MTX2), we also removed the methyl group to further decrease the binding affinity of the ligand. The anti‐theophylline Fab fragment binds to its antigen through several hydrogen bonds, including those between the amide bond on the linker and Tyr37 on the light chain and Arg53 on the heavy chain (Figure 2 b). Attaching a linker to N7 of theophylline (Theo1) or shifting the position of the amide bond (Theo2) should thus decrease the binding affinity of the tethered ligands (Figure 3). In the structure of anti‐quinine Fab fragment (Figure 2 c), the quinine interacts directly with Glu99 on the heavy chain and indirectly with Asn92 on the light chain of the Fab. Alkylation of the quinolinic or quinuclidinic nitrogen was thereby performed to yield the ligands Quin1 and Quin2 (Figure 3).
Figure 3.
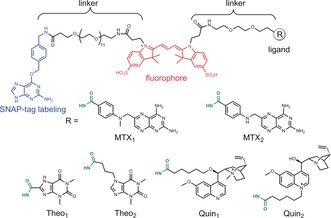
Molecules used for semisynthesis of the sensor proteins. The benzylguanine group serves as the reactive moiety for SNAP‐tag labeling (blue). The fluorophore Cy3 is colored in red. The ligands for different analytes are shown as R groups, which conjugate to the polyethylene glycol linker through amide bonds (green).
All of the sensor proteins were obtained through co‐expression of heavy and light chains from mammalian cells (Table S1 and Figure S1 in the Supporting Information). After labeling SNAP‐tag with the benzylguanine derivatives, the bioluminescence response of the resulting six LUCIDs in human serum was measured as a function of the corresponding analyte concentrations (Table 1). For all LUCIDs, titration with increasing concentrations of analyte led to a decrease in the emission of Cy3 and an increase in NanoLuc emission, which is in line with the free analyte displacing the tethered ligands (Figure 4 a–c and Figures S2–4). The maximal emission ratio changes (ΔR max) were all larger than 500 %, and up to 2155 % for the theophylline sensor Theo1‐Lucid (Table 1). To the best of our knowledge, this is the highest dynamic range for any BRET‐based ratiometric biosensor reported so far. For each sensor protein, tuning the binding affinities of the tethered ligands shifted the c50 values, defined as the analyte concentration that resulted in 50 % of the maximum ratio change, and permitted the detection of analyte levels from submicromolar to submillimolar concentrations (Table 1).
Table 1.
The ΔR max, c 50, and response range of the LUCIDs for the three drugs.[a]
| Sensor | ΔR max [%] | c 50 [μm] | Response Range[b] |
|---|---|---|---|
| MTX1‐Lucid | 1064 | 12.74±1.55 | 53 nm −0.13 mm |
| MTX2‐Lucid | 863 | 0.53±0.05 | |
| Theo1‐Lucid | 2155 | 92.96±5.02 | 0.84 μm −0.93 mm |
| Theo2‐Lucid | 933 | 8.44±0.17 | |
| Quin1‐Lucid | 562 | 4.87±0.90 | 0.49 μm −0.59 mm |
| Quin2‐Lucid | 1036 | 59.12±8.51 |
[a] The measurements were performed in human serum (50 mm HEPES, 50 mm NaCl, pH 7.45, 50 % (v/v) serum) and the sensor concentration is 5 nm. [b] The response range represents the combined response ranges of two LUCIDs for each analyte.
Figure 4.
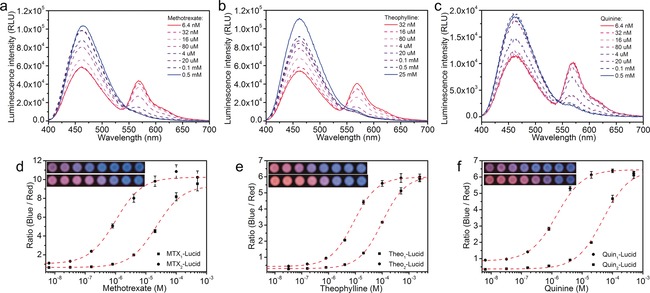
LUCIDs for methotrexate, theophylline, and quinine. Emission spectra of 5 nm MTX1‐Lucid (a), Theo1‐Lucid (b), and Quin2‐Lucid (c) in human serum spiked with known concentrations of the corresponding analyte. Emission ratios of methotrexate LUCIDs (d), theophylline LUCIDs (e), and quinine LUCIDs (f) as a function of analyte concentration. The measurements were performed on paper spotted with 5 μL sample (50 mm HEPES, 50 mm NaCl, pH 7.45, 50 % (v/v) serum, 1/100 furimazine). The data (mean±SD) are fitted to a single‐site binding isotherm (dashed line). Insets: pictures of the paper‐based devices in the detection of serum samples with the corresponding analytes (Top: LUCIDs with low c50 values; Bottom: LUCIDs with high c50 values).
It is noteworthy that the high performance of the Fab‐based LUCIDs was achieved without any complex geometry optimization, such as circular permutation of the binding proteins, thus underlining the generality of the approach to transform the antibodies into bioluminescent sensors.
Kinetic experiments showed that for all these sensors, the signal reached equilibrium within 15 min (Figure S5), thus making them suitable for rapid PoC testing. To evaluate the sensors for possible cross‐reactivity, we next titrated them with different potential drug metabolites or known interference compounds. 7‐hydroxy methotrexate, which is the major metabolite of methotrexate,19 did not induce an obvious ratio response in either methotrexate sensor, while the minor metabolite 4‐amino‐4‐deoxy‐N‐ methylpteroic acid (DAMPA) showed a five‐fold larger c50 and should not interference with the detection of methotrexate (Figure S6).20 Key metabolites of theophylline and compounds structurally similar to theophylline, including 1,3‐dimethyluric acid, 1‐methylxanthine, and 3‐methylxanthine,21 did not interfere with the measurements of theophylline (using Theo1 as tethered ligand) in the therapeutic relevant concentration range of the drug (Figure S7). The key metabolite of quinine, 3‐hydroxyquinine,22 and other quinoline‐based antimalaria drugs commonly used in a combination with quinine for medical treatments, also showed negligible signal response, thus indicating that the quinine LUCIDs show excellent specificity (Figure S8). These data showed that the antibodies preserved their high specificity during the transformation into bioluminescent sensors.
In order to transfer these antibody‐based biosensors into PoC devices suitable for easy, portable, and inexpensive diagnostics, we constructed paper‐based devices that allowed simple quantification with a digital camera.4 We therefore investigated whether the Fab‐based sensors would be compatible with measurements on paper. For this, we pretreated paper with bovine serum albumin and the non‐ionic detergent TWEEN 20 to reduce adsorption of the sensor and analytes, as well as to improve diffusion of the spotted liquid.23 The LUCIDs were then lyophilized on the pre‐treated paper for later use. Titrations with samples (5 μL each) on paper exhibited similar results to those observed in serum buffer (Table S2). Using a digital camera, the analyte‐dependent color transition from red to blue was also recorded (Figure 4 d–f, inset). When transferring the RGB pixel data of the pictures into the CIE1931 xy chromaticity diagram, which is an objective specification of the quality of a color regardless of its luminance, the analyte‐dependent color transitions displayed good linearity, confirming the color mixing of red and blue with different ratios (Figure S9).24, 25 The ratio values between the average intensity per pixel in the blue and red color channel were calculated according to the known method (Figure 4 d–f).4 The c50 values obtained by the camera‐based measurements agreed well with those measured by the microplate reader (Table S2), thus suggesting that the digital‐camera‐based testing was a reliable method to provide laboratory‐quality results for the quantification of drugs on paper with a minimal sample volume.
We next spiked the three drugs in HEPES buffer and measured the concentrations using the paper‐based devices. By comparing the results to those obtained with a UV/Vis spectrophotometric method, we observed a very good correlation (R=0.994) between the results measured by the two methods (Figure 5). Furthermore, the LUCIDs also exhibited a very good average inter‐assay coefficient of variation of 14.8 %. The paper strips with the dried LUCIDs did not show a significant decrease in performance after 35 days of storage at room temperature (Table S2). These results clearly demonstrated the suitability of the paper‐based devices for PoC TDM.
Figure 5.
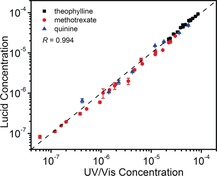
Correlation of the results obtained for the spiked samples (black: theophylline, red: methotrexate, and blue: quinine) using a traditional UV/Vis spectrophotometric method and LUCID. The LUCID measurements were performed on paper by spotting 5 μL sample/serum mixture (50 mm HEPES, 50 mm NaCl, pH 7.45, 50 % (v/v) serum, 1/100 furimazine), and the UV/Vis measurements in HEPES buffer (50 mm HEPES, 50 mm NaCl, pH 7.45). Each LUCID measurement is given as the mean±SD of three independent measurements. Regression analysis yielded a Pearson correlation coefficient R=0.994.
We further used our paper‐based devices for the analysis of whole‐blood samples. Blood components such as hemoglobin are known to interfere with luciferase‐based measurements.26 However, we found that a simple dilution of the blood into HEPES buffer (1/10) sufficiently removed this effect in our diagnostic scheme. We successfully set up calibration curves from the diluted blood samples (Figure S10) for all three drugs. For these experiments, we used the LUCIDs with smaller c50 values, since they are more suitable for the analysis of ten‐fold diluted samples. The good match of the c50 values with those observed from serum samples and high maximal ratio changes demonstrate that the paper‐based devices permit the direct PoC quantification of drugs in diluted blood samples.
In summary, we devised a general approach to transform antibodies into bioluminescent sensor proteins for therapeutic drugs. The sensors show high specificity, a tunable response range, and a large dynamic range. On paper‐based devices, they permit the PoC quantification of drug levels in serum/blood by using a low‐cost digital camera. The generation of specific antibodies towards almost any molecule is a well‐established technique, and our work therefore establishes a general design principle for PoC therapeutic drug monitoring that should ultimately improve patient care and bring benefits to low‐resource locations.
Conflict of interest
The authors declare no conflict of interest.
Supporting information
As a service to our authors and readers, this journal provides supporting information supplied by the authors. Such materials are peer reviewed and may be re‐organized for online delivery, but are not copy‐edited or typeset. Technical support issues arising from supporting information (other than missing files) should be addressed to the authors.
Supplementary
Acknowledgements
This work was supported by funding from the Swiss National Science Foundation, the NCCR Chemical Biology, and EPFL. We thank Dr. David Hacker, Laurence Durrer, and Soraya Quinche for the help of protein expression.
L. Xue, Q. Yu, R. Griss, A. Schena, K. Johnsson, Angew. Chem. Int. Ed. 2017, 56, 7112.
References
- 1. Sanavio B., Krol S., Front. Bioeng. Biotechnol. 2015, 3, 20. [DOI] [PMC free article] [PubMed] [Google Scholar]
- 2. Saint-Marcoux F., Sauvage F.-L., Marquet P., Anal. Bioanal. Chem. 2007, 388, 1327–1349. [DOI] [PubMed] [Google Scholar]
- 3. Dasgupta A., Datta P., Handbook of Drug Monitoring Methods, Humana, Totowa, NJ, 2008, pp. 67–86. [Google Scholar]
- 4. Griss R., Schena A., Reymond L., Patiny L., Werner D., Tinberg C. E., Baker D., Johnsson K., Nat. Chem. Biol. 2014, 10, 598–603. [DOI] [PubMed] [Google Scholar]
- 5. Arts R., den Hartog I., Zijlema S. E., Thijssen V., van der Beelen S. H. E., Merkx M., Anal. Chem. 2016, 88, 4525–4532. [DOI] [PubMed] [Google Scholar]
- 6. Arts R., Aper S. J. A., Merkx M., Methods Enzymol. 2017, 589, 87–114. [DOI] [PubMed] [Google Scholar]
- 7. Bacart J., Corbel C., Jockers R., Bach S., Couturier C., Biotechnol. J. 2008, 3, 311–324. [DOI] [PubMed] [Google Scholar]
- 8. Zhao Y., Gutshall L., Jiang H., Baker A., Beil E., Obmolova G., Carton J., Taudte S., Amegadzie B., Protein Expression Purif. 2009, 67, 182–189. [DOI] [PubMed] [Google Scholar]
- 9. Biela B. H., Khawli L. A., Hu P., Epstein A. L., Cancer Biother. Radiopharm. 2003, 18, 339–353. [DOI] [PubMed] [Google Scholar]
- 10. Holliger P., Hudson P. J., Nat. Biotechnol. 2005, 23, 1126–1136. [DOI] [PubMed] [Google Scholar]
- 11. Shirai H., Kidera A., Nakamura H., FEBS Lett. 1999, 455, 188–197. [DOI] [PubMed] [Google Scholar]
- 12. Chothia C., Lesk A. M., J. Mol. Biol. 1987, 196, 901–917. [DOI] [PubMed] [Google Scholar]
- 13. Xu J. L., Davis M. M., Immunity 2000, 13, 37–45. [DOI] [PubMed] [Google Scholar]
- 14. Brun M. A., Griss R., Reymond L., Tan K.-T., Piguet J., Peters R. J. R. W., Vogel H., Johnsson K., J. Am. Chem. Soc. 2011, 133, 16235–16242. [DOI] [PubMed] [Google Scholar]
- 15. Schulz M., Iwersen-Bergmann S., Andresen H., Schmoldt A., Crit. Care 2012, 16, R136. [DOI] [PMC free article] [PubMed] [Google Scholar]
- 16. Gayda S., Longenecker K. L., Manoj S., Judge R. A., Saldana S. C., Ruan Q., Swift K. M., Tetin S. Y., Biochemistry 2014, 53, 3719–3726. [DOI] [PubMed] [Google Scholar]
- 17. Bujotzek A., Fuchs A., Qu C., Benz J., Klostermann S., Antes I., Georges G., mAbs 2015, 7, 838–852. [DOI] [PMC free article] [PubMed] [Google Scholar]
- 18. Zhu J., Zhu J., Bougie D. W., Aster R. H., Springer T. A., Blood 2015, 126, 2138–2145. [DOI] [PMC free article] [PubMed] [Google Scholar]
- 19. Johns D. G., Loo T. L., J. Pharm. Sci. 1967, 56, 356–359. [Google Scholar]
- 20. Donehower R. C., Hande K. R., Drake J. C., Chabner B. A., Clin. Pharmacol. Ther. 1979, 26, 63–72. [DOI] [PubMed] [Google Scholar]
- 21. Haley T. J., Drug Metab. Rev. 1983, 14, 295–335. [DOI] [PubMed] [Google Scholar]
- 22. Heaton J., Rahmioglu N., Ahmadi K. R., Legido-Quigley C., Smith N. W., J. Pharm. Biomed. Anal. 2011, 55, 494–499. [DOI] [PubMed] [Google Scholar]
- 23. Pardee K., Green A. A., Ferrante T., Cameron D. E., DaleyKeyser A., Yin P., Collins J. J., Cell 2014, 159, 940–954. [DOI] [PMC free article] [PubMed] [Google Scholar]
- 24. Mao Z., Yang Z., Mu Y., Zhang Y., Wang Y. F., Chi Z., Lo C. C., Liu S., Lien A., Xu J., Angew. Chem. Int. Ed. 2015, 54, 6270–6273; [DOI] [PubMed] [Google Scholar]; Angew. Chem. 2015, 127, 6368–6371. [Google Scholar]
- 25. Malacara D., Color Vision and Colorimetry: Theory and Applications , 2nd ed., SPIE, Bellingham, WA, 2011. [Google Scholar]
- 26. Colin M., Moritz S., Schneider H., Capeau J., Coutelle C., Brahimi-Horn M. C., Gene Ther. 2000, 7, 1333–1336. [DOI] [PubMed] [Google Scholar]
Associated Data
This section collects any data citations, data availability statements, or supplementary materials included in this article.
Supplementary Materials
As a service to our authors and readers, this journal provides supporting information supplied by the authors. Such materials are peer reviewed and may be re‐organized for online delivery, but are not copy‐edited or typeset. Technical support issues arising from supporting information (other than missing files) should be addressed to the authors.
Supplementary


