Abstract
Single‐molecule fluorescence resonance energy transfer (sm‐FRET) has become a widely used tool to reveal dynamic processes and molecule mechanisms hidden under ensemble measurements. However, the upper limit of fluorescent species used in sm‐FRET is still orders of magnitude lower than the association affinity of many biological processes under physiological conditions. Herein, we introduce single‐molecule photoactivation FRET (sm‐PAFRET), a general approach to break the concentration barrier by using photoactivatable fluorophores as donors. We demonstrate sm‐PAFRET by capturing transient FRET states and revealing new reaction pathways during translation using μm fluorophore labeled species, which is 2–3 orders of magnitude higher than commonly used in sm‐FRET measurements. sm‐PAFRET serves as an easy‐to‐implement tool to lift the concentration barrier and discover new molecular dynamic processes and mechanisms under physiological concentrations.
Keywords: FRET, photoactivatable fluorophores, proteins, single-molecule studies, RNA translation
Single‐molecule techniques have become widely used tools to reveal unique properties of individual molecules hidden under ensemble measurements. Total internal reflection fluorescence (TIRF) microscopy based single‐molecule fluorescence resonance energy transfer (sm‐FRET) is commonly used to examine internal conformational dynamics of surface‐attached molecules or interactions between attached and freely‐diffusing molecules.1 TIRF microscopy restricts its excitation volume to a thin layer of evanescent field, which decays within a few hundred nanometers above the microscope coverslip surface, and presents a better signal‐to‐noise ratio (SNR) than Epi‐illumination. However, to obtain optimal SNR under TIRF illumination, the concentrations of fluorophore‐labeled freely‐diffusing species are limited to 10 nm or lower, which are still orders of magnitude lower than the association affinity of many biological processes under physiological conditions. To address this conflict, several techniques have been developed,2 however, a simple method to perform sm‐FRET at μm concentrations or higher in a non‐confined environment is still lacking. In this work, using photoactivatable organic fluorophores as donors, we developed a new general and easy‐to‐implement approach named single molecule photoactivation FRET (sm‐PAFRET), which lifts the concentration barrier by 2–3 orders of magnitude. We demonstrated that sm‐PAFRET can reveal new molecular mechanisms at close to physiological concentrations.
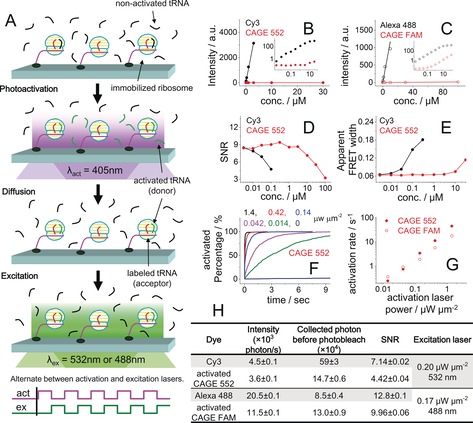
The concept of sm‐PAFRET is shown in Figure 1 A. A photoactivatable fluorophore serves as the donor, which can be converted into an activated form by a laser pulse. Unbound activated fluorophores quickly diffuse out from the glass surface and are diluted by non‐activated molecules, whereas activated fluorophores attached onto the microscope slide are continuously excited by the excitation laser and give out fluorescence and FRET signals. Alternating illumination between activation and excitation lasers is used to avoid exciting unbound activated fluorophores and to swiftly activate photoactivatable fluorophores once they bind.
Figure 1.

A) A cartoon demonstrating the alternating activation and excitation lasers to perform sm‐PAFRET measurements. B, C) Standard curves of fluorescence intensity versus concentration for Cy3 and CAGE 552 (B), and for Alexa 488 and CAGE FAM (C). The insets show intensity and concentration, both on a log scale. D) Average signal‐to‐noise ratio (SNR) of individual Cy3 fluorophore. E) Width of the observed FRET distribution of Cy3/Cy5 obtained from dye‐labeled DNA duplex standards in the presence of free Cy3 or CAGE 552 in solution. Distributions of SNR and FRET are shown in Figure S3 and S4, respectively. F) Photoactivation curves for CAGE 552 at various activation laser (405 nm) powers. G) Photoactivation rates of CAGE 552 and CAGE FAM under various activation laser powers. H) Fluorescence brightness, photostability, and average SNR of individual fluorophores attached to a DNA duplex standard collected at 100 ms per frame. Standard error of mean (SEM) is shown.
To achieve our concept, the photoactivatable fluorophores need to have extremely low fluorescence signals in their non‐activated form, their photoactivation rates have to be fast enough to capture initial dynamic processes upon binding to surface attached molecules, and the activated fluorophores need to be bright and stable enough for single‐molecule fluorescence measurements. We tested two commercial photoactivatable fluorophores, CAGE 552 and CAGE FAM. Once activated, their excitation and emission spectra are similar to the commonly used Cy3 and Alexa 488, respectively. The fluorescence signals of non‐activated CAGE 552 and CAGE FAM were (1.03±0.07)×104 and 790±90 fold lower than their counterparts as measured with a fluorescence spectrometer (Figure 1 B, C). Similarly, TIRF‐based single‐molecule fluorescence and FRET measurements showed that the concentrations of free CAGE 552 and CAGE FAM can be 2–3 orders of magnitude higher than Cy3 and Alexa 488, respectively, while maintaining similar SNR (Figure 1 D, E, Figures S1–S6 and Tables S1, S2 in the Supporting Information). In addition, the photoactivation rates of CAGE 552 and CAGE FAM increased almost linearly with increasing activation laser (405 nm) power (Figure 1 F, G, Figure S7, and Table S3), whereas activation by the excitation laser (532 nm or 488 nm) was almost negligible. Although the brightness, photostability, and SNR of single‐molecule trajectories of activated CAGE 552 and CAGE FAM were not as good as their commonly used counterparts (Figure 1 H), they still could serve as decent fluorophores for single‐molecule fluorescence and FRET measurements (Figure S8).
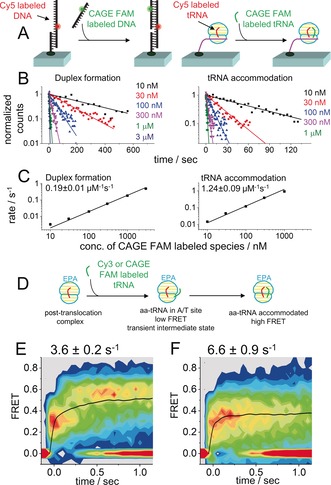
Next, we demonstrated that sm‐PAFRET can break the traditional concentration barrier and be applied to a broad range of concentrations for labeled species. 10 nm–3 μm of CAGE FAM labeled single‐stranded DNA were applied to the immobilized complementary strand to capture appearance of FRET caused by duplex formation, and 10 nm–1 μm of CAGE FAM labeled aminoacyl tRNA (aa‐tRNA) were applied to immobilized ribosomal post‐translocation complexes to capture the accommodation rates of aa‐tRNA through the appearance of FRET between adjacent tRNAs (Figure 2 A–C). The appearance rates of sm‐PAFRET signals in both assays increased almost linearly with increasing concentrations of CAGE FAM labeled species for two orders of magnitude (Figure 2 C). The second‐order reaction rates for duplex formation and aa‐tRNA accommodation under our experimental conditions were 0.19±0.01 μm −1 s−1 and 1.24±0.09 μm −1 s−1, respectively, which are generally consistent with reported values.3 We did notice that the accommodation of CAGE FAM labeled aa‐tRNA was several‐fold slower than Cy5‐labeled aa‐tRNA (3.3±0.2 μm −1 s−1, Figure S9), which might due to the steric hindrance caused by the larger molecular size of CAGE FAM over Cy5. The highest concentration (3 μm) used here, which was a couple of hundred times higher than the traditional concentration barrier, was no longer restricted by the amount of fluorescence background we could tolerate, but was limited by the amount of labeled materials we could afford.
Figure 2.

A) An illustration of the experimental design. B) Logarithms of the number of appeared FRET events plotted as a function of time. Curves represent single‐exponential fittings, and number of events in the first bin were normalized to 1. C) Apparent reaction rates of duplex formation and aa‐tRNA accommodation under various concentrations of CAGE FAM labeled species. D) An illustration of delivering donor‐labeled aa‐tRNA to ribosomal POST complexes with Cy5–tRNA in the P site to capture transient intermediate state containing aa‐tRNA in the A/T site. E, F) Time‐dependent FRET contour plots constructed from Cy3/Cy5 sm‐FRET (E) and CAGE FAM/Cy5 sm‐PAFRET (F) to capture process shown in (D). Data were collected at 25 ms per frame with 0.80 μW μm−2 532 nm laser excitation (E) or 0.52 μW μm−2 405 nm laser activation and 0.68 μW μm−2 488 nm laser excitation (F). All single‐molecule trajectories were aligned to the beginning of FRET events as t=0, when both donor and FRET signals appeared simultaneously. Average FRET values of the remaining events at each time point were calculated and used to plot the black curves, from which transition rates from the initial low FRET to the stable high FRET were fitted by single‐exponential decay and listed. SEM values are shown.
Under the highest activation laser power of our microscope, the maximum activation rates were 45±2 s−1 (CAGE 552) and 18±1 s−1 (CAGE FAM), which set the upper limit for the fastest dynamic process we can track upon the binding of photoactivatable fluorophore labeled species. These activation rates were fast enough and would not compromise the time resolution of our microscope, the highest full‐frame collecting rate of which is 40 Hz. As a demonstration for the capture of fast dynamic processes upon binding, we examined aa‐tRNA accommodation through FRET between adjacent tRNAs again. Aa‐tRNA transiently stays in an A/T site before it is fully accommodated into the ribosomal A site.4 Therefore, sm‐FRET between Cy5‐labeled tRNA in the ribosomal P site and Cy3‐labeled aa‐tRNA delivered to the ribosome showed a transient low FRET state upon Cy3–aa‐tRNA binding, which corresponds to the intermediate state containing aa‐tRNA in the A/T site, and its evolution to a stable high FRET state representing the fully accommodated complex (Figure 2 D, E).5 The transition rate from the initial low FRET to the stable high FRET was 3.6±0.2 s−1. A similar FRET pattern was found when CAGE FAM replaced Cy3 to serve as the donor on aa‐tRNA (Figure 2 F). The transient low FRET state was still captured by sm‐PAFRET. The transition rate from low to the high FRET was 6.6±0.9 s−1 and was barely changed when doubling the activation laser power (Figure S10), which implies that the photoactivation was fast enough to fully capture the transient dynamics during aa‐tRNA accommodation. The difference between transition rates might be caused by different properties between Cy3 and CAGE FAM attached to aa‐tRNA.
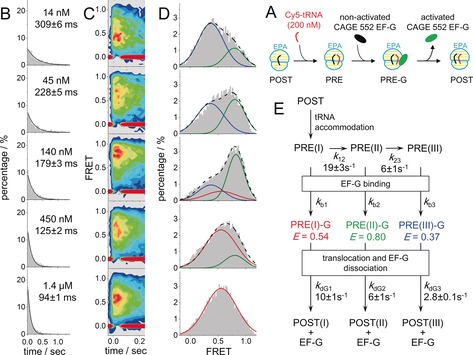
Under normal physiological conditions, aa‐tRNA and elongation factor G (EF‐G) were present at μm concentrations or higher to support rapid protein synthesis.6 However, due to the concentration barrier, most smFRET experiments had to be performed with labeled aa‐tRNA and EF‐G at around 10 nm, are far below the physiological concentrations. Now, with sm‐PAFRET, we captured transient FRET between A‐site Cy5–aa‐tRNA and CAGE 552 labeled EF‐G during translocation (Figure 3 A), with concentrations of labeled EF‐G ranging from 14 nm to 1.4 μm. A mixture of Cy5–aa‐tRNA and CAGE‐552–EF‐G was supplied to immobilized ribosomal post‐translocation (POST) complexes while collecting sm‐PAFRET trajectories, so that CAGE‐552–EF‐G could catalyze translocation as soon as Cy5–aa‐tRNA accommodated on the ribosomes to form pre‐translocation (PRE) complexes (Figure 3 A). Interestingly and surprisingly, the dwell times of FRET between aa‐tRNA and EF‐G significantly decreased as the concentration of EF‐G increased from 14 nm to 1.4 μm (Figure 3 B). In addition, the distributions of FRET between them also profoundly changed as the EF‐G concentration varied (Figure 3 C, D). At least three major FRET states were discovered. A low‐FRET state (energy transfer efficiency, E=0.37) mainly appeared at low concentrations (14 and 45 nm), a high‐FRET state (E=0.80) mainly appeared at low and medium concentrations (14–450 nm), and a middle‐FRET state (E=0.54) dominated at high concentrations (450 nm and 1.4 μm). Due to its flexible nature,7 the ribosome has been shown to transit between several PRE conformational states, from which parallel translocation pathways can be initiated.8 Therefore, we proposed a reaction model to reconcile our new discoveries (Figure 3 E), in which the ribosome starts to transit to different PRE states once aa‐tRNA is fully accommodated. Binding of EF‐G to different PRE states leads to parallel translocation pathways and results in different FRET dwell times and FRET values between aa‐tRNA and EF‐G. Assuming EF‐G binding rates are the same (150 μm −1 s−1) for all PRE complexes,9 the transition rates of other steps were estimated through global fitting and are listed in Figure 3 E (for details, see the Supporting Information).
Figure 3.

A) An illustration of how to use sm‐PAFRET between A‐site tRNA and EF‐G to capture transient interactions between EF‐G and the ribosome. A mixture of Cy5–aa‐tRNA and CAGE‐552–EF‐G was supplied to immobilized POST complexes together so that EF‐G could catalyze translocation as soon as the PRE complex was formed, the lifetime of which would highly depend on EF‐G concentration. B, C, D) Dwell‐time distributions (B), time‐dependent FRET contour plots (C) constructed from trajectories aligned to the beginning of FRET events as t=0, and FRET distributions (D) of sm‐PAFRET between Cy5–aa‐tRNA and CAGE‐552–EF‐G under various concentrations of CAGE‐552–EF‐G. Increasing the EF‐G concentration shifts the major FRET population from a low‐FRET state (blue, E=0.37) to a high‐FRET state (green, E=0.80), and finally to a middle‐FRET state (red, E=0.54) as shown in (D). Total numbers of events were normalized to 100 % in (B) and (D). E) A proposed reaction scheme to reconcile EF‐G concentration‐dependent FRET dwell times and distributions. Assuming EF‐G binding rates are the same (150 μm −1 s−1) for all PRE complexes, transition rates between PRE complexes and dissociation rates of EF‐G from three transient intermediate complexes were estimated through global fitting from our sm‐PAFRET measurements and listed. SEM values are shown.
Here, TIRF microscopy based sm‐PAFRET was demonstrated as a general, powerful, and easy‐to‐implement approach to lift the concentration barrier by 2–3 orders of magnitude. Both sm‐PAFRET and PhADE2c are methods based on photoactivation to break the concentration barrier, however, using photoactivatable organic fluorophores instead of photoconvertible proteins and optimizing activation laser power to ensure fast activation of the bound fluorophores are key elements for performing sm‐PAFRET. In addition, our sm‐PAFRET has the potential to combine with zero‐mode waveguides (ZMWs)2a,2f and convex‐lens‐induced confinements (CLIC)2b to further extend the concentration limit to the mm range. We expect that single‐molecule experiments performed under physiological concentrations will reveal more unknown mechanisms.
Conflict of interest
The authors declare no conflict of interest.
Supporting information
As a service to our authors and readers, this journal provides supporting information supplied by the authors. Such materials are peer reviewed and may be re‐organized for online delivery, but are not copy‐edited or typeset. Technical support issues arising from supporting information (other than missing files) should be addressed to the authors.
Supplementary
Acknowledgements
This project was supported by funds from the National Natural Science Foundation of China (31570754), Tsinghua‐Peking Joint Center for Life Sciences and Beijing Advanced Innovation Center for Structural Biology to CC and Lab Innovation Funding from Lab and Instrument Department, Tsinghua University to WW.
S. Peng, R. Sun, W. Wang, C. Chen, Angew. Chem. Int. Ed. 2017, 56, 6882.
References
- 1. Roy R., Hohng S., Ha T., Nat. Methods 2008, 5, 507–516. [DOI] [PMC free article] [PubMed] [Google Scholar]
- 2.
- 2a. Levene M. J., Korlach J., Turner S. W., Foquet M., Craighead H. G., Webb W. W., Science 2003, 299, 682–686; [DOI] [PubMed] [Google Scholar]
- 2b. Leslie S. R., Fields A. P., Cohen A. E., Anal. Chem. 2010, 82, 6224–6229; [DOI] [PMC free article] [PubMed] [Google Scholar]
- 2c. Loveland A. B., Habuchi S., Walter J. C., van Oijen A. M., Nat. Methods 2012, 9, 987–992; [DOI] [PMC free article] [PubMed] [Google Scholar]
- 2d. Boukobza E., Sonnenfeld A., Haran G., J. Phys. Chem. B 2001, 105, 12165–12170; [Google Scholar]
- 2e. Chiu D. T., Lorenz R. M., Jeffries G. D., Anal. Chem. 2009, 81, 5111–5118; [DOI] [PMC free article] [PubMed] [Google Scholar]
- 2f. Goldschen-Ohm M. P., White D. S., Klenchin V. A., Chanda B., Goldsmith R. H., Angew. Chem. Int. Ed. 2017, 56, 2399–2402; [DOI] [PMC free article] [PubMed] [Google Scholar]; Angew. Chem. 2017, 129, 2439–2442. [Google Scholar]
- 3.
- 3a. Jungmann R., Steinhauer C., Scheible M., Kuzyk A., Tinnefeld P., Simmel F. C., Nano Lett. 2010, 10, 4756–4761; [DOI] [PubMed] [Google Scholar]
- 3b. Chen C. L., Wang W. J., Wang Z., Wei F., Zhao X. S., Nucleic Acids Res. 2007, 35, 2875–2884; [DOI] [PMC free article] [PubMed] [Google Scholar]
- 3c. Pape T., Wintermeyer W., Rodnina M. V., EMBO J. 1998, 17, 7490–7497; [DOI] [PMC free article] [PubMed] [Google Scholar]
- 3d. Chen C. L., Zhang H. B., Broitman S. L., Reiche M., Farrell I., Cooperman B. S., Goldman Y. E., Nat. Struct. Mol. Biol. 2013, 20, 582–588. [DOI] [PMC free article] [PubMed] [Google Scholar]
- 4.
- 4a. Valle M., Sengupta J., Swami N. K., Grassucci R. A., Burkhardt N., Nierhaus K. H., Agrawal R. K., Frank J., EMBO J. 2002, 21, 3557–3567; [DOI] [PMC free article] [PubMed] [Google Scholar]
- 4b. Schmeing T. M., Voorhees R. M., Kelley A. C., Gao Y. G., Murphy F. V., Weir J. R., Ramakrishnan V., Science 2009, 326, 688–694. [DOI] [PMC free article] [PubMed] [Google Scholar]
- 5. Geggier P., Dave R., Feldman M. B., Terry D. S., Altman R. B., Munro J. B., Blanchard S. C., J. Mol. Biol. 2010, 399, 576–595. [DOI] [PMC free article] [PubMed] [Google Scholar]
- 6.
- 6a. Dong H. J., Nilsson L., Kurland C. G., J. Mol. Biol. 1996, 260, 649–663; [DOI] [PubMed] [Google Scholar]
- 6b. Ishihama Y., Schmidt T., Rappsilber J., Mann M., Hartl F. U., Kerner M. J., Frishman D., BMC Genomics 2008, 9, 102. [DOI] [PMC free article] [PubMed] [Google Scholar]
- 7. Fischer N., Konevega A. L., Wintermeyer W., Rodnina M. V., Stark H., Nature 2010, 466, 329–333. [DOI] [PubMed] [Google Scholar]
- 8.
- 8a. Adio S., Senyushkina T., Peske F., Fischer N., Wintermeyer W., Rodnina M. V., Nat. Commun. 2015, 6, 7442; [DOI] [PMC free article] [PubMed] [Google Scholar]
- 8b. Chen C. L., Stevens B., Kaur J., Smilansky Z., Cooperman B. S., Goldman Y. E., Proc. Natl. Acad. Sci. USA 2011, 108, 16980–16985. [DOI] [PMC free article] [PubMed] [Google Scholar]
- 9. Savelsbergh A., Katunin V. I., Mohr D., Peske F., Rodnina M. V., Wintermeyer W., Mol. Cell 2003, 11, 1517–1523. [DOI] [PubMed] [Google Scholar]
Associated Data
This section collects any data citations, data availability statements, or supplementary materials included in this article.
Supplementary Materials
As a service to our authors and readers, this journal provides supporting information supplied by the authors. Such materials are peer reviewed and may be re‐organized for online delivery, but are not copy‐edited or typeset. Technical support issues arising from supporting information (other than missing files) should be addressed to the authors.
Supplementary


