Abstract
A covalently linked organic dye–cobaloxime catalyst system based on mesoporous NiO is synthesized by a facile click reaction for mechanistic studies and application in a dye‐sensitized solar fuel device. The system is systematically investigated by photoelectrochemical measurements, density functional theory, time‐resolved fluorescence, transient absorption spectroscopy, and photoelectron spectroscopy. The results show that irradiation of the dye–catalyst on NiO leads to ultrafast hole injection into NiO from the excited dye, followed by a fast electron transfer process to reduce the catalyst. Moreover, the dye adopts different structures with different excited state energies, and excitation energy transfer occurs between neighboring molecules on the semiconductor surface. The photoelectrochemical experiments also show hydrogen production by this system. The axial chloride ligands of the catalyst are released during photocatalysis to create the active sites for proton reduction. A working mechanism of the dye–catalyst system on the photocathode is proposed on the basis of this study.
Keywords: click chemistry, dye-sensitized solar cells, hydrogen, photocatalysis, reaction mechanisms
Introduction
Owing to limited reserves and the “footprint” of fossil fuels, the development of sustainable energies in our society is required. Solar energy, as an attractive sustainable energy source, is abundant and clean. Converting solar energy into solar fuels (e.g., H2, CH4, CO) from stable and abundant substrates (e.g., H2O, CO2) is an important strategy to implement sustainable energy conversion and storage.1, 2, 3, 4, 5, 6, 7, 8, 9, 10, 11, 12, 13 Dye‐sensitized solar fuel devices (DSSFDs) constitute a kind of photoelectrochemical cell11, 12, 14, 15, 16, 17 based on large band gap semiconductors sensitized with molecular dyes and catalysts for solar fuel production.1, 9, 18, 19, 20, 21, 22, 23, 24 For an efficient DSSFD, photocurrent match between the photocathode and photoanode is desirable. The photoanode has been intensively investigated and rapidly developed,1, 25, 26, 27, 28, 29, 30 with a record high photocurrent density of 3 mA cm−2 at pH 8.26 However, the progress in the production of a working photocathode is still unsatisfactory,31, 32, 33 which causes the performance of the final DSSFD to be less than ideal.34, 35 The way that the photosensitizer and catalyst are arranged on the electrode definitely affects the performance of the photocathode. Most of the reported photocathodes based on the dye/catalyst concept adopt the co‐sensitization method reported by Sun and co‐workers,34, 35 which is beneficial for intimate interaction between dye and catalyst, and is synthetically simpler. However, the co‐sensitized catalysts occupy partial sites of the semiconductor surface and are also are near the electrode surface, probably leading to insufficient dye loadings as well as fast recombination between the injected holes in the semiconductor and electrons in the reduced catalyst, which could limit the obtainable photocurrent. Wu and co‐workers reported a coordination linkage between a Ru dye and a cobaloxime catalyst on NiO films with an atomic‐layer‐deposited (ALD) Al2O3 coating, which solves some of the aforementioned issues.32 However, the axial coordination bond of a pyridine group on the cobalt center could become unstable upon reduction.36 Wasielewski and co‐workers recently reported a strategy using ALD Al2O3 to protect the dye on NiO for use as a photocathode for photodriven hydrogen evolution, which increased the stability of the dye under aqueous conditions.37 Subsequently, Meyer and co‐workers reported a photocathode with a “donor–dye–catalyst” assembly on NiO for water reduction with a photocurrent density of −56 μA cm−2 and a Faradaic yield of 53 %.38
Herein, we report a covalently linked dye–catalyst system on a photocathode for H2 evolution. The study of such a covalent system would be beneficial for our understanding of the different interfacial electron transfer processes, and for comparison with other systems, which would guide us in the design and development of more efficient photocathodes in the future. With this motivation in mind, we searched for a method for facile linkage of the dye and catalyst for NiO sensitization. In 2013, Artero and co‐workers reported the immobilization of a cobaloxime (also named as cobalt diamine–dioxime) catalyst (Figure 1) on carbon nanotubes through a “click” reaction for electrocatalytic hydrogen production.39 This would provide us with a useful building block and inspired us to build up a photoactive dye–catalyst system by click chemistry. Interestingly, during the preparation of our manuscript, a similar but different system was reported by Artero and co‐workers,40 in which the cobaloxime catalyst was linked with dyes through the acceptor unit. In our system, we put the catalyst near the acceptor group and also carried out more mechanistic studies of the covalently linked dye–catalyst system. Figure 1 shows the molecular structures of the compounds used in this study. PB‐1 is the dye compound without the catalyst linked, in which carboxylate is employed as an anchoring group, the triphenylamine (TPA) unit acts as an electron donor, dicyanovinyl is used as the electron acceptor, and dibenzylcyclooctyne (DBCO) is introduced in the reaction site for posterior catalyst linkage. PB‐2 is the dye–catalyst compound synthesized by the Cu‐free click reaction between PB‐1 and the cobaloxime–azide catalyst (Co‐N3). The in situ click reaction of PB‐1 with Co‐N3 on NiO, denoted as [PB‐2], was also carried out for comparison with PB‐2 synthesized before attachment to the NiO film.
Figure 1.
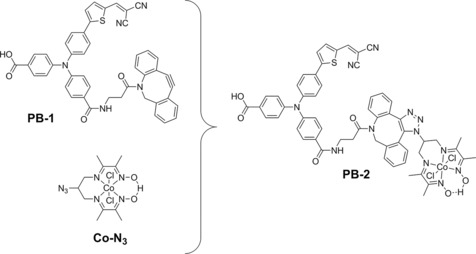
Molecular structures of the dye (PB‐1), catalyst (Co‐N3), and dye–catalyst (PB‐2) compounds used in this study.
Experimental Section
General
Chemicals and solvents were purchased from Sigma–Aldrich and used without further purification unless specified. All the organic reactions were performed under an inert atmosphere of nitrogen, and the prepared chemicals were dried under vacuum. 1H NMR spectra of the compounds were measured on a JEOL Eclipse+ 400 MHz spectrometer with CD3OD as solvent. Chemical shifts are reported in parts per million (ppm) relative to tetramethylsilane by referencing to the residual signal of the deuterated solvent. High resolution mass spectral analyses (HRMS) were performed on a high resolution pneumatically‐assisted electrospray ionization Fourier transform (FTMS+pNSI) mass spectrometer (OrbitrapXL). UV/Vis spectra were acquired with an Agilent Cary 50 UV/Vis–NIR spectrophotometer. Fluorescence spectra were measured on a Horiba FluoroLog instrument in 1 cm standard quartz cuvettes.
Synthesis
Synthesis of PB‐1
(Benzotriazol‐1‐yloxy)tris(dimethylamino)phosphonium hexafluorophosphate (BOP; 38.4 mg, 0.0868 mmol), triethylamine (12 μL, 0.0868 mmol) and dibenzocyclooctyne‐amine41 (DBCO‐amine, 2; 24 mg, 0.0868 mmol) were added to the solution of compound 1 42 (42.7 mg, 0.0868 mmol) in dry DMF under a N2 atmosphere. The mixture was stirred for 1 h at room temperature (RT). The solvent was removed by a rotary evaporator. The crude product was purified by silica gel column chromatography (60 mesh) using dichloromethane/methanol (DCM/MeOH; 90:10) as eluent. The obtained red solid was washed three times with a mixture of ethyl acetate and pentane (2:98), to yield PB‐1 as a dark red solid (16 mg, 0.0216 mmol, yield 25 %). 1H NMR (400 MHz, CD3OD): δ=8.28 (s, 1 H, cyanovinylic proton) 7.94–7.97 (m, 2 H, Ar‐H), 7.84 (d, J=4.0 Hz, 1 H, Ar−H), 7.75–7.78 (m, 3 H, Ar−H), 7.66 (d, J=8.0 Hz, 1 H, Ar‐H), 7.61 (m, 1 H, Ar−H), 7.52 (d, J=8.0 Hz, 1 H, Ar−H), 7.41–7.48 (m, 2 H, Ar−H), 7.32–7.34 (m, 1 H, Ar−H), 7.06–7.26 (m, 10 H, Ar−H), 5.13 (d, J=13.9 Hz, 1 H, −CH2), 3.69 (d, J=13.9 Hz, 1 H, −CH2), 3.39–3.60 (m, 2 H, −CH2), 2.53–2.57 (m, 1 H, −CH2), 2.20–2.25 ppm (m, 1 H, −CH2); HR‐MS: [M+Na]+ calcd for C46H31N5O4SNa: 772.1994; found: 772.1994.
Synthesis of PB‐2
Co‐N3 (50 mg, 0.12 mmol) was added to 15 mL dry acetonitrile solution containing PB‐1 (75 mg, 0.1 mmol). The reaction mixture was stirred at RT overnight under a N2 atmosphere. The solvent was removed under reduced pressure and the crude product was subsequently washed with ethyl acetate/pentane (2:98) and ice‐cold acetonitrile to remove excess dye and unreacted catalyst, affording PB‐2 as a red powder (75 mg, 65 % yield). As there is a chance of forming isomers depending on the triazole substitution, the characterization of PB‐2 by 1H‐NMR was extremely difficult. The HR‐MS spectrum was only used to characterize PB‐2. HR‐MS: [M+Na]+ calcd for C57H49CoCl2N12O6SNa: 1181.2220; found: 1181.2239.
Preparation of buffer solutions
Stock solutions of 1 m K2HPO4 and 1 m KH2PO4 were prepared. 1 m K2HPO4 (49.7 mL) and 1 m KH2PO4 (50.3 mL) were mixed and the combined solution was diluted to 1000 mL with distilled water. The pH of the prepared phosphate buffer solution was 6.8. Acetate buffer was prepared by mixing 0.1 N acetic acid (80 mL) with 0.1 N sodium acetate (120 mL) and the pH was 4.8.
General electrochemical methods
Electrochemical measurements were carried out by using an AUTOLAB potentiostat and a general purpose electrochemical system (GPES) electrochemical interface (Eco Chemie) with a traditional three‐electrode system with Ag/AgNO3 (10 mm AgNO3) as the reference electrode, glassy carbon as the working electrode, and a platinum rod as the counter electrode. The compound (0.1 mm) in acetonitrile was used as a solution and 0.1 m tetrabutylammonium hexafluorophosphate (TBAPF6) was employed as supporting electrolyte with a scan rate of 100 mV s−1. Ferrocene (Fc) was used as reference in the background solution to calibrate the potential of the Ag/AgNO3 electrode to the normal hydrogen electrode (NHE) by adding =0.63 V vs. NHE.43 The E 1/2 of Fc0/+ was determined by cyclic voltammetry under the same conditions, as the average of the anodic and cathodic peak potentials [E 1/2=(E pa+E pc)/2].
Preparation of the photocathode
Mesoporous, nanostructured NiO films with a thickness of 3.5 μm on fluorine‐doped tin oxide (FTO) substrates were prepared by doctor‐blading method using a NiO paste prepared according to a previously reported method.44. The active areas of the prepared NiO film were 1 cm2. Subsequently, the NiO films were sensitized by dipping the films into a 0.2 mm methanol solution of PB‐1 and PB‐2 overnight to form photocathodes. The photocathodes were rinsed with MeOH to remove excess weakly deposited dye on the surface, then dried under a nitrogen flow. The in situ prepared PB‐2 on the NiO surface, [PB‐2], was prepared as follows: the PB‐1‐sensitized NiO film was dipped into a 0.1 mm acetonitrile solution of Co‐N3 overnight and then the film was washed with acetonitrile to remove excess catalyst and dried under a nitrogen flow.
Photoelectrochemical (PEC) measurement
To investigate the molecular photocathode, PEC measurements were carried out in a home‐made cell set up with two compartments separated by a Nafion proton exchange membrane (DuPont™ Nafion® NR211), in which the photocathode was used as the working electrode, Pt foil was introduced as the counter electrode, and Ag/AgCl electrode (saturated KCl) acted as the reference electrode. The area of the photocathode was fixed to 0.5 cm2 by a metal mask. A white LED PAR38 lamp (17 W, 5000 K, Zenaro Lighting GmbH) was used as a light source. Before every experiment, the PEC cell was degassed by Ar for at least 15 min.
Hydrogen detection
Hydrogen was detected by using Unisense microsensor. Before calibration and measurements, the sensor was polarized at +1000 mV until stable. The calibration was carried out by injecting different volumes of hydrogen‐saturated water in a calibration chamber with known amount of water.
Time‐resolved fluorescence
Time‐correlated single photon counting (TCSPC) measurements were carried out by using a pulsed diode laser source (Edinburgh Instruments EPL470) operating at 470.4 nm with a pulse full width half maximum (FWHM) of approximately 87.3 ps. A neutral density filter was used to attenuate the beam to obtain photon counts of approximately 1 % or less of the incoming light intensity. The detector used was a Hamamatsu MCP‐photomultiplier tube R3809U‐51 (cooled to approximately −40 °C), the signal was passed to a discriminator (Ortec 9307) and then into a time‐to‐ amplitude converter (TAC) (Ortec 566, 50 ns time range used). The electrical trigger signal from the laser was also passed through a discriminator (Tennelec TC454) and on to the TAC (Ortec 566). The TAC output was read by a DAQ‐1 multi‐channel analyzer computer card using 4096 channels and collected with Horiba Jobin Yvon DataStation 2.3 software. All measurements were done in reverse mode at 20 MHz and under magic angle polarization. A cut‐off filter was used to block the scattered excitation light. The instrument response function (IRF) was obtained by using a blank microscopy glass slide. Fluorescence lifetimes were obtained by iterative re‐convolution of the IRF and the collected decay curves, by fitting to a multiexponential decay model using either in‐house scripts or with the help of the SpectraSolve 2.01 software.
The streak camera setup used for time‐resolved fluorescence measurements has been described previously in detail.45 Briefly, the sample was excited at 400 nm by the frequency‐doubled output of a Ti:Sa oscillator (Coherent Mira 900) with a repetition rate of 76 MHz. Solutions were measured using a 1 cm quartz cuvette, and the laser beam was directed into the cuvette close to the cuvette wall on the emission side, thus reducing the efficient cuvette length to 1–2 mm. Films were measured by exciting at an angle of approximately 30°. The excitation energies at the sample were in the order of approximately 15 pJ after removal of residual IR light with a CC8 glass filter. The emitted light was focused at a right angle and passed through a 435 nm long‐pass filter to a Bruker SPEC 250IS spectrograph with approximately 200 nm observation windows, and onto the streak camera (Hamamatsu). The observed time windows for different time ranges were approximately 160 or 2000 ps, and the FWHM of the response functions were approximately 5 or 50 ps, respectively. The data was processed in Igor Pro 6.37 and fitted to a multiexponential decay model (up to 2 components) convoluted with a Gaussian response function, with the FWHM as a fitted parameter, and analyzed using in‐house global fitting procedures.
Ultrafast laser spectroscopy
The preparation of PB‐1 and PB‐2 sensitized films (ZrO2, TiO2, and NiO) for the femtosecond transient absorption measurements were similar to ones used for the PEC experiments, but with a thinner layer (ca. 1 μm) to have sufficient transparency for pump‐probe measurements. During the measurements, a drop of propylene carbonate (PC) was added to the sensitized film and covered with a thin glass by capillary force. The absorbance of the sample was controlled between 0.3–0.8. Femtosecond time‐resolved measurements were carried out in transient absorption mode. A detailed description of the setup has been reported previously by Petersson et al.46 Briefly, the output from a Coherent Legend Ti:Sapphire amplifier (1 kHz, λ=800 nm, FWHM 100 fs) was split into a pump and a probe part. The desired pump wavelengths were obtained with a TOPAS‐white non‐colinear optical parametric amplifier. The energy of each pulse was controlled to 200 nJ over approximately 3 mm2. A white light continuum was used as the probe and obtained by focusing part of the 800 nm light on a moving CaF2 plate. The polarization of the pump was set at the magic angle, 54.7°, relative to the probe. Instrumental response time depends on the pump and probe wavelengths but was typically approximately 150 fs.
Data analyses were carried out in MATLAB (The MathWorks, Inc.), with a robust trust region reflective Newton nonlinear‐least‐squares method used for the fits of time traces. Traces (ΔA vs. t) were fitted to a sum of exponentials convolved with a Gaussian shaped response. Also included in the fits is an artifact signal that is due to the cross phase modulation during pump and probe overlap. All spectra are chirp corrected in the white light probe. The time zero was set at the maximum pump–probe temporal overlap.
Photoelectron spectroscopy
Hard X‐ray photoelectron spectroscopy (HAXPES) measurements were carried at the photon source BESSY II (Helmholtz Zentrum Berlin, Germany) at the KMC‐1 beamline47 using the HIKE end‐station.48 The end‐station was provided with a usable photon energy range from 2 keV to 12 keV. The photon energy was selected by using a double‐crystal monochromator (Oxford‐Danfysik) and the photoelectron kinetic energies (KE) were measured using a Model R4000 analyzer (Scienta) optimized for high kinetic energies. In this work, a photon energy of 2100 eV was used by selecting the first‐order light from a Si(111) crystal.
Overview spectra (see the Supporting Information, Figure S13) were measured with a pass energy (E p) of 500 eV and the core level peaks with an Ep of 200 eV. The spectra presented in this work were energy calibrated versus the Fermi level at zero binding energy, which was determined by measuring a gold plate in electric contact with the sample and setting the Au 4f7/2 core level peak to 84.0 eV after curve fitting. The core‐level spectra were all intensity normalized versus the background at the lower binding energy side. Overview spectra are normalized to the background value at 525 eV.
Result and Discussion
Synthesis
The copper‐free click reaction49 was adapted to make the linkage between the dye core and the catalyst owing to its moderate reaction conditions. The synthetic routes of PB‐1 and PB‐2 are depicted in Scheme 1. Compound 1 and DBCO‐amine (2) were synthesized by following the reported literature method.41, 42 Condensation between compound 1 and DBCO‐amine afforded PB‐1 by using a condensing reagent [benzotriazol‐1‐yloxy)tris(dimethylamino)phosphonium hexafluorophosphate] in dry DMF solution under a nitrogen atmosphere. The coupling reaction yielded both mono‐ and di‐coupled products in 25 % and 28 % yield, respectively. Other coupling reagents, such as N‐(3‐dimethylaminopropyl)‐N′‐ethylcarbodiimide hydrochloride (EDC), dicyclohexylcarbodiimide (DCC), and 1‐hydroxybenzotriazole hydrate (HOBt), were also tested for this reaction, but none of them were suitable because they yielded inseparable product mixtures. The reaction between the azide unit and DBCO resulted in a mixture of two isomers (the 1,5‐ and the 1,4‐disubstituted tetrazoles), which were difficult to separate. To monitor the reaction rate of PB‐1 with Co‐N3, UV/Vis spectra of the reaction mixture of PB‐1 (40 μM) and Co‐N3 (100 μM) in dry acetonitrile were recorded as a function of reaction time (see Figure 2 a). The spectrum was measured every 30 min by keeping the reaction mixture at room temperature with stirring. The peak absorbance at 310 nm gradually decreased as the reaction between PB‐1 and Co‐N3 proceeded, which is assigned to the structural change of the cyclooctyne of PB‐1 into the triazole.50 The reaction was therefore completed within 6 h when the absorbance at 310 nm reached a plateau. By kinetically fitting the absorption data to second order reaction kinetic model according to Equation (1), we obtained a rate constant, k = 3 s−1M−1 (Figure 2 b). It was difficult to obtain the reaction rate constant of the in situ click reaction on NiO due to the overlap between the absorption of cyclooctyne and the strong absorption of NiO in the UV region.
| (1) |
Scheme 1.
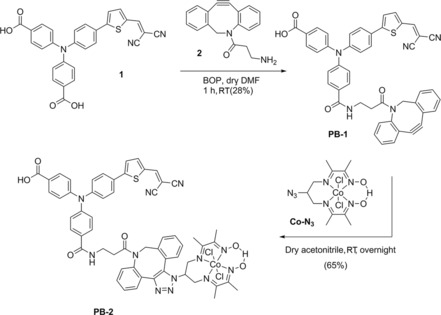
Synthetic procedures for the preparation of compounds PB‐1 and PB‐2.
Figure 2.
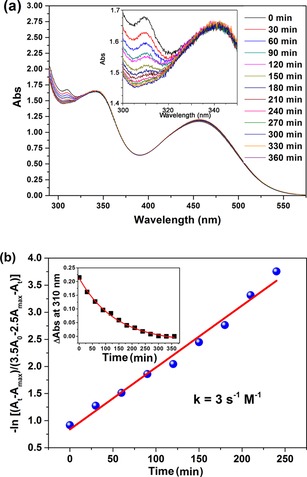
a) Cu‐free click reaction between PB‐1 (40 μm) and Co‐N3 (100 μm) in dry acetonitrile solution monitored by UV/Vis absorption spectroscopy with respect to time; the inset is a magnification of the near‐UV region. b) The change in UV/Vis absorbance at 310 nm as a function of time during the reaction (points) and second order reaction kinetic fittings (lines); the inset shows the absorption vs. time whereas the main figure is a plot according to Equation (1).
Equation (1) represents the second‐order analysis of the click reaction in solution, in which, and are the initial concentration and concentration at time t of PB‐1, respectively. and are the intinal concentration and concentration at time t of Co‐N3, respectively. A 0 and At are the initial absorbance and absorbance at time t, respectively. at 310 nm. A max is the final absorbance at 310 nm.
Optical properties
The absorption spectra of the compounds in methanol solution and on a NiO film are shown in Figure 3 and the corresponding physical and electrochemical properties are summarized in Table 1. We observed a characteristic band in the high‐energy region with an absorption maximum at 310 nm, which we attributed to the strained cyclooctyne ring. In the case of PB‐2, the characteristic band at 310 nm was absent, as expected, confirming the formation of the triazole ring after click reaction. Dyes PB‐1 and PB‐2 both show only one broad emission in methanol (500–800 nm), with very similar emission maxima at 684 and 689 nm, respectively. However, the fluorescence of PB‐2 is quenched by 40 % compared to that of PB‐1 in solution under the same conditions (Figure S1). The detailed fluorescence study of dyes on films will be described and discussed in sections on time‐resolved fluorescence and transient absorption spectroscopy. The absorption spectra of both compounds bound to NiO films are essentially the same as the solution spectra in terms of the shape and position of the bands, and the absorption spectrum of [PB‐2]/NiO recorded after the in situ click reaction on the NiO surface is similar to that of PB‐2/NiO.
Figure 3.
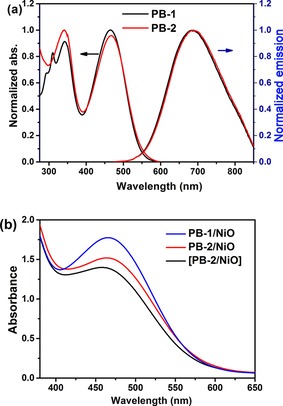
Normalized absorption and emission spectra in methanol solution (a) and absorption spectra (b) of different samples on NiO films (PB‐1/NiO, PB‐2/NiO, and [PB‐2]/NiO) using bare NiO as a baseline.
Table 1.
Optical and electrochemical data of PB‐1 and PB‐2
| Dye | λ abs (ϵ×104 m −1 cm−1)a | λ abs [nm][b] | λ em [nm][c] | E 0‐0 [eV][d] | E [V][e] | E [V][e] | E [V][e] | E [V][e] | E [V][f] | E [V][f] |
|---|---|---|---|---|---|---|---|---|---|---|
| PB‐1 | 342 (2.41) 467 (2.58) | 465 | 684 | 2.27 | 1.40 | – | – | −0.70 | 1.57 | −0.87 |
| PB‐2 | 341 (2.57) 467 (2.48) | 466 | 689 | 2.25 | 1.41 | 0.01 | −0.32 | −0.79 | 1.46 | −0.84 |
| Co‐N3 | – | – | – | – | – | 0 | ‐0.42 | – | – | – |
[a] In methanol. [b] On NiO film. [c] In methanol. λ em independent of excitation wavelength; [d] Transition energy (E 0‐0) is estimated from the intersection of the normalized absorption and emission curves. [e] All potentials are given vs. NHE converted by adding =0.63 V vs. NHE.43 [f] The excited state potentials were estimated from E 0‐0 and the recorded potentials by using CV, according to the following: E = E −E 0‐0; E = E +E 0‐0.
Electrochemical properties
The electrochemical properties of PB‐1 and PB‐2 were investigated by cyclic voltammetry (CV) in acetonitrile (Figure 4). Both PB‐1 and PB‐2 show reversible oxidation peaks corresponding to the oxidation of the triphenylamine moieties, at 1.40 and 1.41 V vs. NHE, respectively, which suggests that triazole ring formation does not have any effect on the potential for oxidation of the dye core. There is also no significant difference between the potentials for reduction of the dye core between PB‐1 and PB‐2. For PB‐2, there are two additional reduction peaks at 0.01 V and −0.32 V vs. NHE, which we assigned to the reduction of Co3+ to Co2+ (E ) and Co2+ to Co1+ (E ), respectively. The pure catalyst Co‐N3 shows the corresponding peaks at 0 V and −0.42 V vs. NHE instead. E in PB‐2 is shifted to a positive potential as compared to that in pure catalyst probably owing to the ligand modification. Using the potentials E and E and the excited state energy (E 0‐0, Table 1) we can estimate values for the excited state potentials E and E for the dyes and obtain an initial estimation of the feasibility of processes of excited state hole injection, dye regeneration by the catalyst, and catalyst reduction by the excited dye. The E ox or E of the dyes are much more positive than the energy level of the NiO valence band (VB), approximately 0.5 V vs. NHE,51 which thermodynamically facilitates hole injection from the excited/oxidized dye to the NiO VB. The E red or E potentials of PB‐2 are more negative than the potential for the two first reductions of the catalyst Co‐N3, which suggests that both the reduced and excited dye can affect the catalyst reduction.
Figure 4.
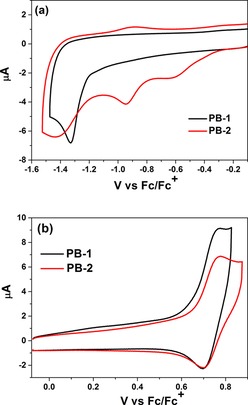
Cyclic voltammetry of the reduction (a) and oxidation potential (b) of 0.1 mm PB‐1 and PB‐2 in acetonitrile medium containing 0.1 m TBAPF6 with a scan rate of 100 mV s−1; Ag/AgNO3 as a reference electrode, glassy carbon as a working electrode, and Pt rod as a counter electrode.
Theoretical calculations
Density functional theory (DFT) calculations were carried out to gain insight into the possibility of intramolecular charge transfer (ICT) in PB‐1 and PB‐2. Optimized gas‐phase geometries were calculated at the B3LYP/6‐31G(d) level using the Gaussian09 rev. A.02 software.52 From the calculation of the electron distribution of the HOMO and LUMO orbitals of the dye core ( Figure 5) it can be observed that a π–π* transition mainly takes place between the electron donor (TPA) and electron acceptor (malononitrile) units in both PB‐1 and PB‐2 as the first ICT process on the dye core. In PB‐2, there is no electron transfer from TPA to the catalyst in the HOMO LUMO transition, because there is no conjugated linkage between TPA and catalyst. However, the catalyst is a spatially close electron acceptor, and therefore, it is expected to perform the secondary ICT process from the electron‐concentrated acceptor to the catalyst.
Figure 5.
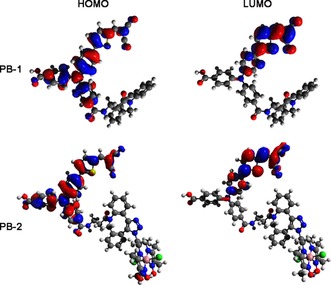
Frontier orbitals (HOMO and LUMO) of PB‐1 and PB‐2 from DFT calculations.
Time‐resolved fluorescence
To further elucidate the ICT processes in PB‐2 experimentally, the fluorescence lifetimes of the PB‐1 and PB‐2 bound to different films (ZrO2 and NiO) were measured by time‐correlated single photon counting (TCSPC). The possible charge transfer processes of different samples are shown in Figure 6 a and the corresponding data in Figure 6 b. The sensitized ZrO2 samples were used as a nonquenching reference as ZrO2 has a band gap 5.4 eV; therefore, thermodynamically, neither PB‐1 nor PB‐2 can inject either holes or electrons into it. We measured the emission decay of PB‐1 and PB‐2 on ZrO2 to calculate the ICT efficiency (η ICT). After fitting the data to a bi‐exponential decay, we obtained for PB‐1 on ZrO2 τ the lifetimes and relative amplitudes of τ 1=1.29 ns (73 %) and τ 2=3.41 ns (27 %), which gives a weighted average photoluminescence lifetime of 1.9 ns. When PB‐2 is sensitized on ZrO2, the emission is greatly quenched and its lifetime (τ ) is essentially response‐function‐limited, and is therefore estimated to be less than 30 ps according to Equation (4), indicating that an efficient secondary ICT process takes place involving the cobaloxime unit. With an upper limit of τ =30 ps and using Equation (2), the η ICT of PB‐2 was determined to be up to 98 %, which is near unity and much higher than that in solution (40 %), probably owing to the different chemical environment and different dye geometry in solution and on the surface. Because the following photoelectrochemical (PEC) experiment would be carried out on NiO, and to afford an insight into hole injection (HI) from the dye to the VB of NiO, the photoluminescence (PL) lifetime of PB‐1 on NiO τ PB‐1/NiOwas also measured, showing again a value close to the instrumental resolution of approximately 30 ps. The interfacial hole injection efficiency (η HI) and lifetime (τ HI) from dye to NiO are determined to be up to 98 % and 30 ps, by using Equations (3) and (5):
| (2) |
| (3) |
| (4) |
| (5) |
Figure 6.
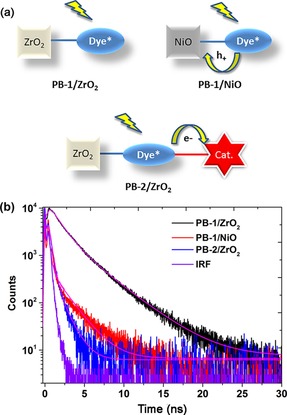
(a) Possible charge transfer processes in different samples. (b) PL decay measurement of PB‐1/ZrO2, PB‐1/NiO, and PB‐2/ZrO2.
For the case of PB‐2 sensitized on NiO (PB‐2/NiO), there are two main charge separation processes after excitation: the reduction of the catalyst by secondary ICT and HI from dye into the NiO VB. Because either of the processes in PB‐2/NiO can quench the PL, the TCSPC data of PB‐2/NiO does not give helpful information and is therefore not provided here.
To address the spectral and temporal limitations of the TCSPC measurement, we used a streak camera to resolve these rapid fluorescence decays and to understand both the ICT and HI processes. Fortunately, we could resolve the lifetimes of the emission decays of both dyes on ZrO2, and the lifetimes of the decay of PB‐1 on NiO. From the decay‐associated spectra (DAS) obtained by global fitting of time‐resolved fluorescence measurements in Figure 7 and Equations (2)–(5), we can confirm the very high calculated η ICT of 92 % and a τ ICT of approximately 9 ps in PB‐2/ZrO2, when considering the fast component only, and a η ICT of 92 % and τ ICT of 87 ps, when considering the slow component only. The slightly lower injection efficiency calculated from time‐resolved fluorescence in this way might be the result of the under/overestimation of the very fast decays by fitting the TCSPC data, which has a lower time resolution. We can resolve two spectral components in all samples. A redshift of the emission as a function of time was observed. This phenomenon could be explained by a large change in the molecular geometry after excitation, such as a structural relaxation and a significant twisting of dicyanovinyl in the dye structure.53 However, in solution (see Figure S2b), we cannot see the same phenomenon, and femtosecond data on the related “P1” dye suggest a much faster emission Stokes shift in both polar and less polar solvents (τ=1–2 ps),54 which cannot be resolved by the streak camera measurements. PB‐1 was also dissolved in a poly(methyl methacrylate) (PMMA) matrix, in which large‐scale structural changes should be hindered, and a similar behavior was observed to that on the films (Figure S2 a). The fact that the two fitted spectral components exhibit an identical η ICT but different charge transfer times calculated by using Equation (1) and (3) attracted our attention. Therefore, we propose another explanation for this phenomenon, which relies on energy transfer between adjacent dye/catalyst molecules and a distribution of the excited state energies of the bound dyes. This effectively delays the charge transfer process and shifts the emission to lower energies, as excitation energy migrates preferentially to low‐energy sites. We note that the emission spectra in acetonitrile (Figure S2 b) or methanol solutions (Figure S1) are much broader (FWHM≈180 nm) than on semiconductor films or in PMMA (FWHM≈100 nm). This is in agreement with heterogeneous broadening, in which the dye adopts different structures already prior to excitation, for example, owing to cis–trans isomerization of the thiophene–dicyanovinyl bond. In solution, all dyes fluoresce independently, but at the higher concentrations on the surface or in PMMA, high‐energy dyes transfer energy to low‐energy dyes, which leads to the spectral redshift with time. There was significant overlap between the absorption and emission bands of both PB‐1 and PB‐2, which suggested a Förster energy‐transfer mechanism that can operate at a large range of distances. The fact that the amplitudes of the decay‐associated spectra are higher overall for the fast component, together with the fact that the TCSPC traces contain a long‐lived component with a very low amplitude, constitute another piece of evidence favoring intermolecular energy transfer, with the redshifted emission originating from energy transfer to low‐energy sites and the lifetime distribution originating from the distance dependence of the energy transfer efficiency. A full investigation of the photophysics of the PB‐1 dye is beyond the scope of this study.
Figure 7.
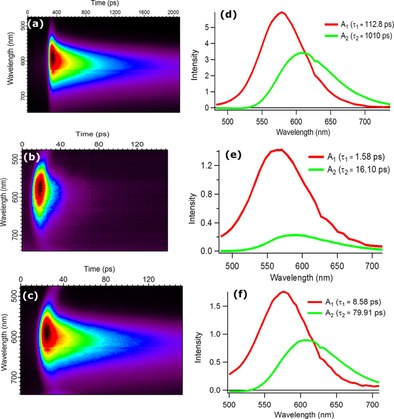
Time‐resolved fluorescence spectral decay profiles of PB‐1/ZrO2 (a), PB‐1/NiO (b), and PB‐2/ZrO2 (c) and decay‐associated spectra obtained from global fitting of PB‐1/ZrO2 (d), PB‐1/NiO (e), and PB‐2/ZrO2 (f).
The η HI and values of PB‐1/NiO were determined by using this technique to be 99 % and 1.6 ps (16.36 ps for longer component), respectively. From these data, we can conclude that HI from the excited state is the predominant primary process when PB‐2 is sensitized on NiO, but ICT still competes to some extent (ca. 10 %).
Transient absorption spectroscopy
To test our conclusion from the time‐resolved fluorescence and to obtain more detailed charge transfer kinetics of PB‐1 and PB‐2 on NiO, femtosecond transient absorption spectroscopy (TAS) measurements were obtained. To distinguish between different transient species, PB‐1 and PB‐2 were used to sensitize different semiconductor films: ZrO2 as a non‐quenching substrate, as mentioned previously, and TiO2 and NiO for electron and hole injection, respectively. The transient absorption spectra of PB‐1/ZrO2 and PB‐2/ZrO2 are shown in Figure 8. Three main excited‐state features can be observed in the early‐time TAS of PB‐1/ZrO2: a) the ground state bleach (GSB) at approximately 500 nm, which is partly covered by the pump scattering (λ ex=540 nm); b) stimulated emission (SE) giving a neat negative signal at approximately 630 nm (cf. fluorescence data), the SE peak shows a dynamic Stokes shift of approximately 10 nm during the initial 2 ps; c) excited state absorption (ESA) resulting in three peaks at 420, 565, and 700 nm, respectively, separated by the GSB and SE. On a timescale of approximately 100 ps, both the SE and the ESA bands at 420 and 700 nm disappear, and the GSB is strongly reduced. Instead, at approximately 250 ps, a new transient spectrum with a broad band at 550–650 nm is present, which decays with a lifetime of approximately 1 ns. The transient absorption trace at 625 nm (Figure 11) illustrates the dynamics: after ultrafast (<1 ps) relaxation, the absorption rises until approximately 100 ps, and then decays again on a 1 ns timescale. Both these slower processes match well the fluorescence decay lifetimes in Figure 7 a, whereas the <1 ps component could not be resolved in the fluorescence experiment. The more long‐lived state is also fluorescent (Figure 7 a). Based on the fluorescence spectroscopy results above, we attributed the processes to energy transfer on around a 100 ps timescale to conformationally different dyes with lower excitation energy, with weaker and redshifted emission and that decays predominantly to the ground state with a lifetime of approximately 1 ns. We denote these as “low energy excited states”. It is clear from the rapid decay of the 700 nm ESA band (Figure 9) that the spectral relaxation dynamics is not single‐exponential. This can be rationalized by the heterogeneous environment and a distribution of intermolecular distances. In addition, there is also ultrafast vibrational/solvent relaxation (ca. 1 ps). The results from a global fit of the transient absorption data for the ZrO2 and TiO2 samples are given in Table S2 and Figures S5–S7. In the case of PB‐2/ZrO2, the initial TAS was the same as that on PB‐1/ZrO2 film, but the ESA decay was faster than PB‐1/ZrO2 (Figure 9). After 250 ps there is a pronounced peak at 625 nm and the isosbestic point at approximately 450 nm is blueshifted, but after 1000 ps the 625 nm peak is no longer distinguishable (Figure 8 b). By comparison with PB‐1 on TiO2, we assigned this spectrum to the oxidized dye, resulting from an ICT from the excited dye to the cobaloxime unit on a 20 ps timescale, followed by charge recombination on an approximately 0.5 ns timescale. PB‐1 can thermodynamically inject electrons to the conduction band (CB) of TiO2, hence forming the oxidized dye. Figure S8 shows the TAS spectra of the PB‐1/TiO2 sample. Indeed, the initial TAS are similar to those for PB‐1/ZrO2, but on the 10–100 ps timescale these are replaced by a clear peak at 625 nm and a 440 nm bleach that we assigned to the oxidized dye. These spectral signatures agree well with the new species observed in PB‐2/ZrO2, which supports our conclusion that secondary ICT to cobaloxime occurs in the latter system. The reaction is illustrated by the comparison shown in Figure 11, in which the kinetic traces of PB‐1/TiO2 and PB‐2/ZrO2 probed at 625 nm show almost the same rise process that is completed at approximately 30 ps, owing to excited state electron transfer (to TiO2 and cobaloxime, respectively), whereas the kinetics for PB‐1/ZrO2 is much slower.
Figure 8.
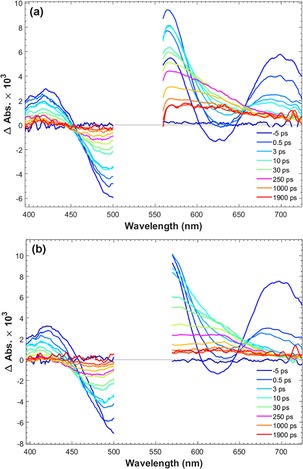
Transient absorption spectra of PB‐1/ZrO2 (left) and PB‐2/ZrO2 (right) in the presence of propylene carbonate; excitation at 540 nm with a 200 nJ per pulse pump.
Figure 11.
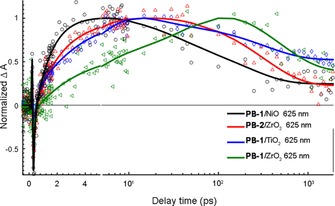
Kinetic traces of PB‐1/NiO (open circles), PB‐2/ZrO2 (open diamonds), PB‐1/TiO2 (up open triangle) and PB‐2/ZrO2 (left open triangle) probed at 625 nm; solid lines are the multiexponential fits.
Figure 9.
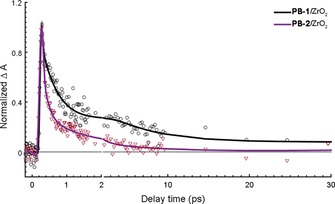
Kinetic traces of PB‐1/ZrO2 (open circles) and PB‐2/ZrO2 (open diamonds) probed at 700 nm; solid lines are the multiexponential fits.
Finally, PB‐1 and PB‐2 sensitization of the NiO photocathodes, PB‐1/NiO and PB‐2/NiO, respectively, was also investigated with TAS. The reactions resolved and their respective rate constants are summarized in Scheme 2. Figure 10 presents the TAS spectra of PB‐1/NiO and PB‐2/NiO, both of which exhibit similar excited state TAS and the relaxations of a few picoseconds, as for the other samples. However, after approximately 30 ps, a visual comparison of the TAS of PB‐1/NiO and PB‐2/NiO show that they present features that are very different from the excited state (on ZrO2) and oxidized state PB‐1 (on TiO2). The spectrum shows a weak, broad band at 560–700 nm, rising slightly towards the red part, instead of the strong, excited state band in Figure 8 or the clear 625 nm peak in Figure S7 of the oxidized PB‐1. By inspecting the data in the region dominated by the initial stimulated emission and formation of new species at approximately 625 nm, it is clear that the kinetic trace of PB‐1/NiO probed at 625 nm shows a much faster rise than the trace for PB‐1/ZrO2 (see Figure 11), and also faster than the rise of the oxidized state of PB‐2/ZrO2 and PB‐1/TiO2. This suggests that a different species is formed in PB‐1/NiO, which is assigned to the reduced state of PB‐1. The main lifetime for hole injection from PB‐1 to NiO is 1.2 ps, which is in agreement with the data from the time‐resolved fluorescence. This suggests that the initial excited state injects holes into NiO. Indeed, from the TAS in Figures 10 and 8, it is clear that the population of the low‐energy excited state is completed earlier but with a lower yield than on ZrO2; the signal at approximately 625 nm reaches a maximum at approximately 3 ps on NiO but at approximately 250 ps on ZrO2, as also illustrated by the traces in Figure 11. The low‐energy excited state decays faster on NiO than on ZrO2, indicating further hole injection from this state, on a 30 ps timescale. The reduced PB‐1 shows only weak TAS features. Nevertheless, the species associated spectra (SAS) from a global, multiexponential fit to each data set (Figure 12 and Table 2) give evidence for secondary ICT in PB‐2/NiO (see also Scheme 2). The first two component lifetimes and SAS show no significant differences, with τ1=0.26 or 0.28 ps and τ2=3.3 or 3.6 ps, respectively. Although the lifetimes are much shorter, the SAS are very similar to those for the first three components for PB‐1/ZrO2 (Figure S5). Thus, τ1 and τ2 reflect ultrafast excited state relaxation in parallel with hole injection into NiO; the average of τ1 and τ2 agrees well with the fluorescence lifetime determined in Figure 7 e (1.58 ps). The third component of the SAS for PB‐1/NiO (τ3=29 ps) and PB‐2/NiO (τ3=11 ps) is very similar to the 475 ps component for PB‐1/ZrO2, which was attributed to low‐energy excited states. Again, the lifetime is similar to that for the slow fluorescence component in Figure 7 e. The much shorter lifetime on NiO is similar to that for the slow fluorescence component in Figure 7 e, which we attributed to further HI from the low‐energy excited states.
Scheme 2.
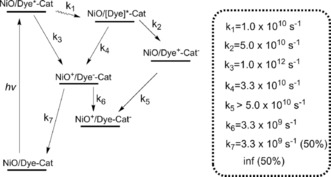
The charge separation and recombination processes and the corresponding rate constants of PB‐2/NiO upon light illumination.
Figure 10.
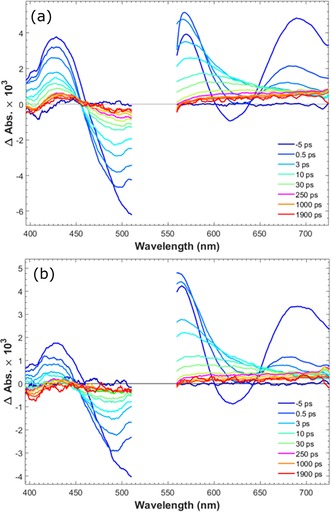
Transient absorption spectra of PB‐1/NiO (left) and PB‐2/NiO (right) in the presence of propylene carbonate; excitation at 540 nm with 200 nJ per pulse pump.
Figure 12.
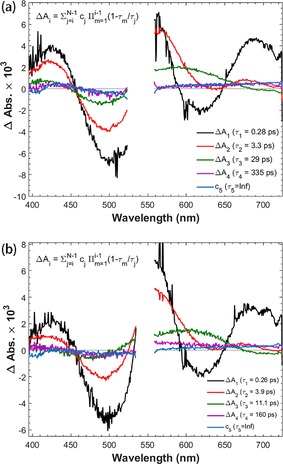
Species associated spectra (SAS) of PB‐1/NiO (a) and PB‐2/NiO (b) from global fits of the transient absorption data.
Table 2.
Time constants obtained from global fits of the femtosecond TA data of PB‐1 and PB‐2 on NiO (values in parentheses refer to the relative amplitudes at 625 nm probe wavelength).
| Sample | τ 1 [ps] | τ 2 [ps] | τ 3 [ps] | τ 4 [ps] | τ inf |
|---|---|---|---|---|---|
| PB‐1/NiO | 0.28 (−34 %) | 3.3 (−22 %) | 29 (14 %) | 335 (22 %) | ∞ (8 %) |
| PB‐2/NiO | 0.26 (−36 %) | 3.9 (−23 %) | 11 (27 %) | 160 (10 %) | ∞ (4 %) |
The shorter lifetime for PB‐2/NiO compared with that for PB‐1/NiO can be explained by secondary ICT to the cobaloxime unit in parallel to hole injection, consistent with the results for ZrO2 above. Presumably, this is followed by an even faster hole shift from the oxidized dye to NiO. Finally, we attributed the weak SAS of the τ4 and τ5 components to the reduced dye, which recombines with NiO holes in a typical multiexponential fashion.53 For PB‐2/NiO, τ4 is much shorter than for PB‐1/NiO (160 ps vs. 335 ps) and the τ5 SAS has a lower amplitude. We attributed this to electron transfer from the reduced dye core to the cobaloxime catalyst unit, which competes with dye–NiO charge recombination. The rate constant of dye regeneration by electron transfer to cobaloxime was estimated to (160 ps)−1—(335 ps)−1≈3×10⁹ s−1, that is, similar to the recombination rate constant (τ4)−1 for PB‐1/NiO. However, as the τ5 component also contributes, and the τ4 and τ5 SAS have a similar amplitude for PB‐1/NiO, we estimated the yield of the cobaloxime reduction to be approximately 75 %. Note that the reduction of the cobaloxime unit itself is not expected to give rise to detectable TAS signals because of low extinction coefficients of the reduced species.55
To summarize the results of time‐resolved spectroscopy, for PB‐2/NiO, HI from the excited PB‐2 to the VB of NiO occurs on the dual timescales of τ≈1 ps and τ≈30 ps. The reduced dye is regenerated by electron transfer to the catalyst, forming a reduced catalyst with a rate constant of approximately 3×10⁹ s−1, which is rapid enough to compete favorably with dye–NiO recombination.
Photoelectrochemical (PEC) study
From the above studies, it is clear that the PB‐2 sensitized NiO can undergo photoinduced catalyst reduction, which is an important step towards proton reduction. We can only detect a single electron transfer from the dye to the catalyst in the TAS study. However, the cobaloxime catalyst must be reduced twice on the photocathode to form CoI, which eventually performs a proton reduction reaction.56 This process could occur on a photocathode upon continuous light illumination. Therefore, we moved one step forward to study the PEC behavior of PB‐1 and PB‐2 in a real device. The working principle of the photocathode based on PB‐2 for light‐driven proton reduction is summarized in Figure 13.
Figure 13.
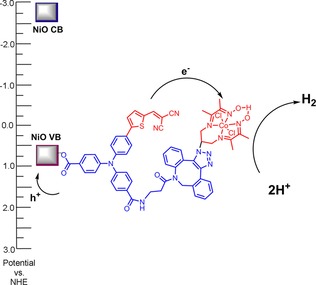
The operating principle of PB‐2/NiO for proton reduction.
First, linear scan voltammetry (LSV) of PB‐1 and PB‐2 on a NiO film was carried out by sweeping the potential from 0.2 to −0.60 V (vs. Ag/AgCl) with chopped light in acetate buffer pH 4.8 (Figure S9). In case of PB‐2, light illumination made a clear photocurrent response with an applied potential from −0.03 to −0.22 V (vs. Ag/AgCl) as compared to PB‐1. Subsequently, transient current responses with respect to chopped light with a 0 V bias voltage were studied in both pH 4.8 acetate (0.1 m) and pH 6.8 (0.1 m) phosphate buffer solutions (Figure 14). PB‐2 produces an average photocurrent of 10 μA cm−2 in both buffers, whereas the PB‐1 dye produces an almost indistinguishable photocurrent under the same experimental condition. From the electrochemical data, the E (−0.32 V) in PB‐2 is not sufficiently negative to reduce protons in a pH 6.8 solution (E =−0.4 V); however, the PEC experiment proved that it actually worked, probably owing to the more negative reduction potential of E in aqueous solution as compared to that in acetonitrile solution. Unfortunately, we could not obtain the precise potential data in aqueous solution owing to the extremely poor solubility of PB‐2 in water. Because a low pH is favorable for improving the proton kinetics at the same bias potential; the photocurrent was found to be higher in the acetate buffer than in the phosphate buffer. It seems that in the phosphate buffer there is a considerable fast charge recombination process upon light illumination from the observable current “spikes” when the light turns on (Figure 14 b). Fast charge recombination between the injected electrons and the reduced catalyst results in insufficient electron transportation to the counter electrode, consequently showing dramatic decays in photocurrent. The hydrogen production was qualitatively detected in situ for the PB‐2‐based PEC cell in both buffer solutions. The data is shown in Figure 15. A higher amount of H2 and a higher photocurrent was obtained in the solution at pH 4.8 than in the solution at pH 6.8. The performance of photoelectrode [PB‐2], prepared by the in situ click reaction, was tested in both the acetate and phosphate buffer; it showed the same behavior as the PB‐2‐sensitized photocathodes. After 1000 s photoelectrolysis, the PB‐2‐based NiO photocathode produced approximately 2.5 nmol hydrogen. To calculate the turnover number (TON), we estimated the PB‐2 dye loading amount in the active area of the electrode to be approximately 5.0×10⁻⁸ mol, by making an assumption that the molar absorption coefficient of the dye is the same in solution and on the NiO film. The TON was estimated to be 0.05. Notably, the first light response shows very high photocurrent 0.2–0.3 mA cm−2; however, the subsequent responses were much lower. The lower photocurrent after the subsequent rounds of light exposure could be explained by three possible scenarios:
Figure 14.
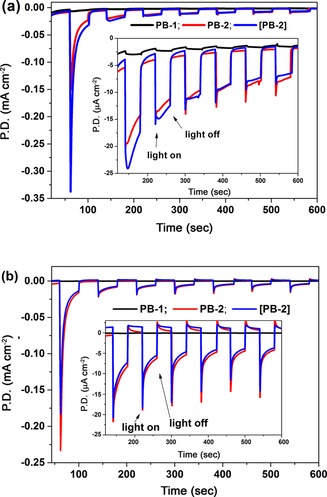
Chronoamperometry of PB‐1, PB‐2, and [PB‐2] in pH 4.8 acetate (a) and pH 6.8 (0.1 m) phosphate (b) buffer solutions under an applied potential of 0 V vs. Ag/AgCl in a three‐electrode PEC cell with Pt as the counter electrode (white LED light, 17 W, 5000 K). P.D.=photocurrent density.
Figure 15.
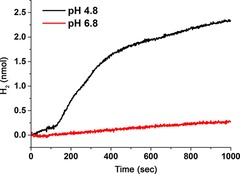
The H2 evolution in different buffer solutions with 0 V bias potential.
i) PB‐2 could desorb quickly from the NiO surface during the photoreaction.
ii) The initial configuration of PB‐2 on NiO is favorable for catalyst reduction; however, upon light illumination and charge transfer, the configuration of PB‐2 is changed by the aforementioned molecular twisting.
iii) The initial high current response could mainly come from the reduction of Co3+ to Co2+, because the driving force of electron transfer from the reduced dye to the first reduction step of the catalyst is much higher than that from the reduced dye to the second reduction of Co2+ to Co1+.
To check hypothesis (i), UV/Vis absorption spectra of PB‐2 on the NiO surface were obtained before and after photoelectrolysis (1 h) with an applied potential of 0 V vs. Ag/AgCl in both buffer solutions (Figure S9 a). There was no significant change in the absorption spectra, which indicated that more than 80 % of PB‐2 remained on the NiO film. After the PEC test, the absorption of the electrolyte was also recorded (Figure S9b), showing a negligible amount of dye in solution. However, the HAXPES analysis (section on photoelectron spectroscopy) indicated that 60 % of PB‐2 is degraded/desorbed during 10 min of photoelectrolysis, which provides two pieces of information. Firstly, it is hard for the electrolyte to infiltrate into the deeper pores in NiO, causing the degradation of the PB‐2 molecules only located at NiO/electrolyte interface. The degradation/desorption of the dye and the poor infiltration of the electrolyte in the NiO films should be responsible for the unsatisfactory TON number. Using a co‐absorbent to change the hydrophilicity of the NiO film could be a good strategy to increase the performance of this kind of photocathode. Secondly, the initial rapid decrease of the photocurrent is clearly not mainly from the dye degradation, because 30 % of PB‐2 remained after 10 min of photoelectrolysis, whereas the initial current decreased from 350 μA cm−2 to 25 μA cm−2 (7 % remaining) during only 40 s. Therefore, a combination of hypotheses (ii) and (iii) could explain the lower photocurrent after the subsequent rounds of light exposure. Hypothesis (ii) is partly proven by the results reported in the sections on time‐resolved fluorescence and transient absorption spectroscopy. If the hypothesis (iii) is correct, the PEC experiment also suggests that the catalyst would not return to Co3+ after the subsequent catalytic proton reduction by Co1+, which would give us useful information about the photocatalytic behavior of PB‐2 on NiO film.
Photoelectron spectroscopy
High‐resolution HAXPES was carried out to monitor the possible structural change of PB‐2 on the electrodes before and after the PEC measurement (10 min) in pH 4.8 with 0 V bias potential (PB‐2#). Figure 16 represents high‐resolution HAXPES spectra of the S 2p, Co 2p and Cl 2p core‐level peaks of PB‐1, PB‐2, and PB‐2#, respectively. The p core‐level spectra always resolve the p3/2 and p1/2 contributions and their binding energy difference were approximately 1.2, 1.6, and 14.9 eV for S 2p, Cl 2p, and Co 2p, respectively. We only refer to the binding energy of the 2p3/2 peak in the rest of this discussion. As expected, the spectra of PB‐1 do not exhibit any Co and Cl peaks, and the S 2p spectrum shows a contribution at approximately 164.4 eV, which we attributed to the thiophene group present in the dye.56 After addition of the catalyst to the dye, the S 2p spectrum is very similar, whereas the Co 2p (main peak at ca. 781.0 eV) and Cl 2p (ca. 197.9 eV) components appear, showing the presence of the catalyst together with the dye.
Figure 16.
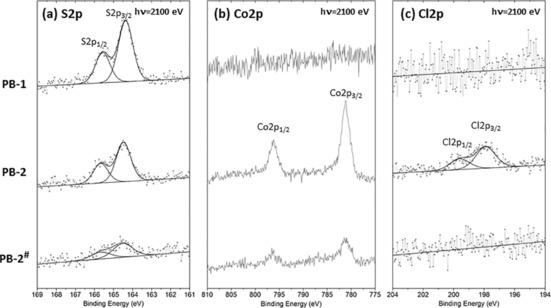
S 2p, Co 2p, and Cl 2p core level peaks of PB‐1 (dye), PB‐2 (dye with catalyst), and PB‐2# (PB‐2 after electrolysis) recorded with a photon energy of 2100 eV.
After photoelectrolysis of PB‐2, the S 2p and Co 2p core peaks are still present, although the intensities of S 2p and Co 2p in PB‐2# are reduced as compared to those in PB‐2. From the previous UV/Vis experiment (Figure S10 a), we did not see significant differences between PB‐2 and PB‐2#. Because HAXPES is sensitive to the outermost surface of the substrate, the decrease in intensity reflects some desorption in this part of the spectra, whereas the bulk of the electrode is largely unaffected, probably owing to the poor infiltration of the electrolyte into deeper pores of the NiO film. Notably, although the signal for cobalt is still observed, no chlorine was detected for PB‐2# (Figure 16 c). Based on the relatively small amounts of cobalt, it is hard to resolve any differences in the valence of the catalyst on the electrode after PEC. From the previous homogeneous catalysis study, the chlorine should be released during the catalyst reduction period57 and the final CoI catalyst should not have any chlorine as an axial ligand. Based on the core‐level data, there is strong evidence that the chlorine is released during the catalytic reaction when adsorbed on the surface and that this provides the active site for proton reduction. According to the previously reported mechanism for proton reduction of the cobaloxime in a homogeneous system57, 58, 59, 60, 61, 62 as well as the new findings in this work, we can propose a working mechanism of our dye–catalyst system (PB‐2) on a NiO surface in a PEC cell (Scheme 3).
Scheme 3.
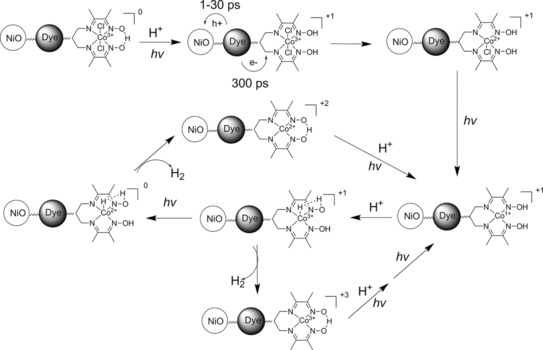
The proposed working mechanism of PB‐2 on NiO in a PEC cell.
Conclusions
We have designed and synthesized an organic dye covalently linked to cobaloxime catalyst (PB‐2) by the facile “Cu‐free” click reaction. The click reaction rate constant was determined to be k=3 s−1 M−1, corresponding to a second order kinetic model. The in situ synthesis of PB‐2 from pre‐adsorbed PB‐1 dye on NiO is also feasible. PB‐2 was adopted as an ideal system to investigate the charge transfer competition processes between hole injection and catalyst reduction when the dye and catalyst are covalently linked on a photocathode for dye‐sensitized solar fuel devices. Time‐correlated single photon counting and streak camera fluorescence measurements have concluded a near unity hole injection efficiency from excited PB‐2 to NiO VB and a more than 90 % intermolecular charge transfer for catalyst reduction from the excited PB‐2 on ZrO2. According to femtosecond transient absorption spectroscopy measurement, hole injection from the excited PB‐2 into the NiO VB takes place on dual timescales, with τ≈1 ps and τ≈30 ps, and the reduced PB‐2 then donates an electron to the catalyst unit with a rate constant of approximately 3×10⁹ s−1. The subsequent regeneration efficiency of the PB‐2 by the catalyst (also called the efficiency of catalyst reduction) is determined to be approximately 75 %. The efficient catalyst reduction by the excited dye could be explained by the long lifetime of the excited state and the large overpotential to reduce the catalyst from the excited state. This result suggests that the excited dye is an ideal species to reduce the catalyst owing to its longer lifetime as compared to the reduced dye in this system; therefore, slowing down the hole injection to make the catalyst reduction happen first could be a good strategy to increase the efficiency of catalyst reduction, thus improving the proton reduction. After the secondary light‐driven reduction process, the catalyst is subsequently active to perform proton reduction. Photoelectrochemical (PEC) experiments showed the ability of the PB‐2‐based NiO photocathode to photochemically produce hydrogen in both acetate and phosphate buffers at pH 4.8 and 6.8, respectively. The results of photoelectron spectroscopy showed that the chloride ligands in the catalyst are completely released after the light‐driven catalyst reduction/hydrogen evolution process and never re‐coordinate after the catalytic reaction. A working principle is therefore proposed, which suggests two possible pathways for the light‐driven catalytic reaction of PB‐2 on the NiO photocathode. Although the electron transfer processes of PB‐2 on NiO are all favorable to render a good photocathode, the photocurrent still cannot compare with that of state‐of‐the‐art photoanodes, probably owing to the poor second electron reduction of the catalyst and/or the poor/slow proton reduction ability of the cobaloxime catalyst. Therefore, developing new dyes with efficient charge transfer to reduce cobaloxime into a real catalytic state and/or using a more efficient proton reduction catalyst instead of cobaloxime is definitely a good strategy to boost the photocurrent of the photocathode in a PEC cell. Moreover, using a carbon dioxide reduction catalyst instead of a proton reduction catalyst in PB‐2 could also create a photocathode for light‐driven carbon dioxide reduction. The relevant investigations are ongoing in our group.
Supporting information
As a service to our authors and readers, this journal provides supporting information supplied by the authors. Such materials are peer reviewed and may be re‐organized for online delivery, but are not copy‐edited or typeset. Technical support issues arising from supporting information (other than missing files) should be addressed to the authors.
Supplementary
Acknowledgements
This work was financially supported by the Swedish Energy Agency, the Knut and Alice Wallenberg Foundation, the Åforsk Foundation (nr.14‐452), the joint “Climate Change” program between the Swedish Research Council (VR) and the National Research Foundation of Korea (NRF), Olle Engkvist Builder Foundation and Göran Gustafsson Foundation. We would also like to greatly thank Prof. Sascha Ott (UU) and Prof. Gerrit Boschloo (UU) for their kind lab support, Mr. Jens Föhlinger (UU) and Dr. Starla Glover (UU) for their helpful discussion and Mr. Leif Häggman (UU) for providing ZrO2 films. L.Z. and L.T. thank the China Scholarship Council (CSC) for the scholarship support. The authors also acknowledge Uppsala Multidisciplinary Center for Advanced Computational Science (UPPMAX) for providing the computational resources under the project SNIC‐2015‐6‐104 and HZB for the allocation of synchrotron radiation beam time.
P. B. Pati, L. Zhang, B. Philippe, R. Fernández-Terán, S. Ahmadi, L. Tian, H. Rensmo, L. Hammarström, H. Tian, ChemSusChem 2017, 10, 2480.
References
- 1. Youngblood W. J., Lee S.-H. A., Kobayashi Y., Hernandez-Pagan E. A., Hoertz P. G., Moore T. A., Moore A. L., Gust D., Mallouk T. E., J. Am. Chem. Soc. 2009, 131, 926–927. [DOI] [PubMed] [Google Scholar]
- 2. Tachibana Y., Vayssieres L., Durrant J. R., Nat. Photonics 2012, 6, 511–518. [Google Scholar]
- 3. White J. L., Baruch M. F., J. E. Pander, III , Hu Y., Fortmeyer I. C., Park J. E., Zhang T., Liao K., Gu J., Yan Y., Shaw T. W., Abelev E., Bocarsly A. B., Chem. Rev. 2015, 115, 12888–12935. [DOI] [PubMed] [Google Scholar]
- 4. Halmann M., Nature 1978, 275, 115–116. [Google Scholar]
- 5. Parkinson B. A., Weaver P. F., Nature 1984, 309, 148–149. [Google Scholar]
- 6. Arai T., Sato S., Uemura K., Morikawa T., Kajino T., Motohiro T., Chem. Commun. 2010, 46, 6944–6946. [DOI] [PubMed] [Google Scholar]
- 7. Kumar B., Llorente M., Froehlich J., Dang T., Sathrum A., Kubiak C. P., Annu. Rev. Phys. Chem. 2012, 63, 541–569. [DOI] [PubMed] [Google Scholar]
- 8. Arai T., Sato S., Morikawa T., Energy Environ. Sci. 2015, 8, 1998–2002. [Google Scholar]
- 9. Sahara G., Abe R., Higashi M., Morikawa T., Maeda K., Ueda Y., Ishitani O., Chem. Commun. 2015, 51, 10722–10725. [DOI] [PubMed] [Google Scholar]
- 10. Ueda Y., Takeda H., Yui T., Koike K., Goto Y., Inagaki S., Ishitani O., ChemSusChem 2015, 8, 439–442. [DOI] [PMC free article] [PubMed] [Google Scholar]
- 11. Hammarström L., Acc. Chem. Res. 2015, 48, 840–850. [DOI] [PubMed] [Google Scholar]
- 12. Willkomm J., Orchard K. L., Reynal A., Pastor E., Durrant J. R., Reisner E., Chem. Soc. Rev. 2016, 45, 9–23. [DOI] [PubMed] [Google Scholar]
- 13. Woolerton T. W., Sheard S., Reisner E., Pierce E., Ragsdale S. W., Armstrong F. A., J. Am. Chem. Soc. 2010, 132, 2132–2133. [DOI] [PMC free article] [PubMed] [Google Scholar]
- 14. Grätzel M., Nature 2001, 414, 338–344. [DOI] [PubMed] [Google Scholar]
- 15. Walter M. G., Warren E. L., McKone J. R., Boettcher S. W., Mi Q., Santori E. A., Lewis N. S., Chem. Rev. 2010, 110, 6446–6473. [DOI] [PubMed] [Google Scholar]
- 16. Brennaman M. K., Dillon R. J., Alibabaei L., Gish M. K., Dares C. J., Ashford D. L., House R. L., Meyer G. J., Papanikolas J. M., Meyer T. J., J. Am. Chem. Soc. 2016, 138, 13085–13102. [DOI] [PubMed] [Google Scholar]
- 17. Hoogeveen D. A., Fournier M., Bonke S. A., Fang X.-Y., Mozer A. J., Mishra A., Bäuerle P., Simonov A. N., Spiccia L., Electrochim. Acta 2016, 219, 773–780. [Google Scholar]
- 18. Ashford D. L., Gish M. K., Vannucci A. K., Brennaman M. K., Templeton J. L., Papanikolas J. M., Meyer T. J., Chem. Rev. 2015, 115, 13006–13049. [DOI] [PubMed] [Google Scholar]
- 19. Tian H., ChemSusChem 2015, 8, 3746–3759. [DOI] [PubMed] [Google Scholar]
- 20. Yu Z., Li F., Sun L., Energy Environ. Sci. 2015, 8, 760–775. [Google Scholar]
- 21. Kou Y., Nakatani S., Sunagawa G., Tachikawa Y., Masui D., Shimada T., Takagi S., Tryk D. A., Nabetani Y., Tachibana H., Inoue H., J. Catal. 2014, 310, 57–66. [Google Scholar]
- 22. Gardner J. M., Beyler M., Karnahl M., Tschierlei S., Ott S., Hammarström L., J. Am. Chem. Soc. 2012, 134, 19322–19325. [DOI] [PubMed] [Google Scholar]
- 23. Castillo C. E., Gennari M., Stoll T., Fortage J., Deronzier A., Collomb M. N., Sandroni M., Légalité F., Blart E., Pellegrin Y., Delacote C., Boujtita M., Odobel F., Rannou P., Sadki S., J. Phys. Chem. C 2015, 119, 5806–5818. [Google Scholar]
- 24. Sherman B. D., Sheridan M. V., Wee K.-R., Marquard S. L., Wang D., Alibabaei L., Ashford D. L., Meyer T. J., J. Am. Chem. Soc. 2016, 138, 16745–16753. [DOI] [PubMed] [Google Scholar]
- 25. Alibabaei L., Sherman B. D., Norris M. R., Brennaman M. K., Meyer T. J., Proc. Natl. Acad. Sci. USA 2015, 112, 5899–5902. [DOI] [PMC free article] [PubMed] [Google Scholar]
- 26. Gao Y., Ding X., Liu J., Wang L., Lu Z., Li L., Sun L., J. Am. Chem. Soc. 2013, 135, 4219–4222. [DOI] [PubMed] [Google Scholar]
- 27. Ding X., Gao Y., Zhang L., Yu Z., Liu J., Sun L., ACS Catal. 2014, 4, 2347–2350. [Google Scholar]
- 28. Michaux K. E., Gambardella A. A., Alibabaei L., Ashford D. L., Sherman B. D., Binstead R. A., Meyer T. J., Murray R. W., J. Phys. Chem. C 2015, 119, 17023–17027. [Google Scholar]
- 29. Yamamoto M., Wang L., Li F., Fukushima T., Tanaka K., Sun L., Imahori H., Chem. Sci. 2016, 7, 1430–1439. [DOI] [PMC free article] [PubMed] [Google Scholar]
- 30. Ashford D. L., Song W., Concepcion J. J., Glasson C. R. K., Brennaman M. K., Norris M. R., Fang Z., Templeton J. L., Meyer T. J., J. Am. Chem. Soc. 2012, 134, 19189–19198. [DOI] [PubMed] [Google Scholar]
- 31. Li L., Duan L., Wen F., Li C., Wang M., Hagfeldt A., Sun L., Chem. Commun. 2012, 48, 988–990. [DOI] [PubMed] [Google Scholar]
- 32. Ji Z., He M., Huang Z., Ozkan U., Wu Y., J. Am. Chem. Soc. 2013, 135, 11696–11699. [DOI] [PubMed] [Google Scholar]
- 33. Click K. A., Beauchamp D. R., Huang Z., Chen W., Wu Y., J. Am. Chem. Soc. 2016, 138, 1174–1179. [DOI] [PubMed] [Google Scholar]
- 34. Fan K., Li F., Wang L., Daniel Q., Gabrielsson E., Sun L., Phys. Chem. Chem. Phys. 2014, 16, 25234–25240. [DOI] [PubMed] [Google Scholar]
- 35. Li F., Fan K., Xu B., Gabrielsson E., Daniel Q., Li L., Sun L., J. Am. Chem. Soc. 2015, 137, 9153–9159. [DOI] [PubMed] [Google Scholar]
- 36. Wakerley D. W., Reisner E., Phys. Chem. Chem. Phys. 2014, 16, 5739–5746. [DOI] [PubMed] [Google Scholar]
- 37. Kamire R. J., Majewski M. B., Hoffeditz W. L., Phelan B. T., Farha O. K., Hupp J. T., Wasielewski M. R., Chem. Sci. 2017, 8, 541–549. [DOI] [PMC free article] [PubMed] [Google Scholar]
- 38. Shan B., Das A. K., Marquard S., Farnum B. H., Wang D., Bullock R. M., Meyer T. J., Energy Environ. Sci. 2016, 9, 3693–3697. [Google Scholar]
- 39. Andreiadis E. S., Jacques P.-A., Tran P. D., Leyris A., Chavarot-Kerlidou M., Jousselme B., Matheron M., Pécaut J., Palacin S., Fontecave M., Artero V., Nat. Chem. 2013, 5, 48–53. [DOI] [PubMed] [Google Scholar]
- 40. Kaeffer N., Massin J., Lebrun C., Renault O., Chavarot-Kerlidou M., Artero V., J. Am. Chem. Soc. 2016, 138, 12308–12311. [DOI] [PMC free article] [PubMed] [Google Scholar]
- 41. Kuzmin A., Poloukhtine A., Wolfert M. A., Popik V. V., Bioconjugate Chem. 2010, 21, 2076–2085. [DOI] [PubMed] [Google Scholar]
- 42. Yen Y.-S., Chen W.-T., Hsu C.-Y., Chou H.-H., Lin J. T., Yeh M.-C. P., Org. Lett. 2011, 13, 4930–4933. [DOI] [PubMed] [Google Scholar]
- 43. Hagberg D. P., Edvinsson T., Marinado T., Boschloo G., Hagfeldt A., Sun L., Chem. Commun. 2006, 2245–2247. [DOI] [PubMed] [Google Scholar]
- 44. Tian H. N., Xu B., Chen H., Johansson E. M. J., Boschloo G., ChemSusChem 2014, 7, 2150–2153. [DOI] [PubMed] [Google Scholar]
- 45. El-Zohry A., Orthaber A., Zietz B., J. Phys. Chem. C 2012, 116, 26144–26153. [DOI] [PMC free article] [PubMed] [Google Scholar]
- 46. Petersson J., Eklund M., Davidsson J., Hammarström L., J. Phys. Chem. B 2010, 114, 14329–14338. [DOI] [PubMed] [Google Scholar]
- 47. Schaefers F., Mertin M., Gorgoi M., Rev. Sci. Instrum. 2007, 78, 123102. [DOI] [PubMed] [Google Scholar]
- 48. Gorgoi M., Svensson S., Schäfers F., Öhrwall G., Mertin M., Bressler P., Karis O., Siegbahn H., Sandell A., Rensmo H., Doherty W., Jung C., Braun W., Eberhardt W., Nucl. Instrum. Methods Phys. Res. Sect. A 2009, 601, 48–53. [Google Scholar]
- 49. Jewett J. C., Bertozzi C. R., Chem. Soc. Rev. 2010, 39, 1272–1279. [DOI] [PMC free article] [PubMed] [Google Scholar]
- 50. Yamagishi K., Sawaki K., Murata A., Takeoka S., Chem. Commun. 2015, 51, 7879–7882. [DOI] [PubMed] [Google Scholar]
- 51. He J., Lindström H., Hagfeldt A., Lindquist S.-E., J. Phys. Chem. B 1999, 103, 8940–8943. [Google Scholar]
- 52.Gaussian 09, Revision D.01, M. J. Frisch, G. W. Trucks, H. B. Schlegel, G. E. Scuseria, M. A. Robb, J. R. Cheeseman, G. Scalmani, V. Barone, B. Mennucci, G. A. Petersson, H. Nakatsuji, M. Caricato, X. Li, H. P. Hratchian, A. F. Izmaylov, J. Bloino, G. Zheng, J. L. Sonnenberg, M. Hada, M. Ehara, K. Toyota, R. Fukuda, J. Hasegawa, M. Ishida, T. Nakajima, Y. Honda, O. Kitao, H. Nakai, T. Vreven, J. A. Montgomery, Jr., J. E. Peralta, F. Ogliaro, M. J. Bearpark, J. Heyd, E. N. Brothers, K. N. Kudin, V. N. Staroverov, R. Kobayashi, J. Normand, K. Raghavachari, A. P. Rendell, J. C. Burant, S. S. Iyengar, J. Tomasi, M. Cossi, N. Rega, N. J. Millam, M. Klene, J. E. Knox, J. B. Cross, V. Bakken, C. Adamo, J. Jaramillo, R. Gomperts, R. E. Stratmann, O. Yazyev, A. J. Austin, R. Cammi, C. Pomelli, J. W. Ochterski, R. L. Martin, K. Morokuma, V. G. Zakrzewski, G. A. Voth, P. Salvador, J. J. Dannenberg, S. Dapprich, A. D. Daniels, Ö. Farkas, J. B. Foresman, J. V. Ortiz, J. Cioslowski, D. J. Fox, Gaussian, Inc., Wallingford, CT, USA, 2009.
- 53. Zhang L., Favereau L., Farré Y., Mijangos E., Pellegrin Y., Bart E., Odobel F., Hammarström L., Phys. Chem. Chem. Phys. 2016, 18, 18515–18527. [DOI] [PubMed] [Google Scholar]
- 54. Zhang L., Boschloo G., Hammarstrom L., Tian H., Phys. Chem. Chem. Phys. 2016, 18, 5080–5085. [DOI] [PubMed] [Google Scholar]
- 55. Muresan N. M., Willkomm J., Mersch D., Vaynzof Y., Reisner E., Angew. Chem. Int. Ed. 2012, 51, 12749–12753; [DOI] [PubMed] [Google Scholar]; Angew. Chem. 2012, 124, 12921–12925. [Google Scholar]
- 56. Lindberg B. J., Hamrin K., Johansson G., Gelius U., Fahlman A., Nordling C., Siegbahn K., Phys. Scr. 1970, 1, 286. [Google Scholar]
- 57. Tran P. D., Barber J., Phys. Chem. Chem. Phys. 2012, 14, 13772–13784. [DOI] [PubMed] [Google Scholar]
- 58. Jacques P.-A., Artero V., Pécaut J., Fontecave M., Proc. Natl. Acad. Sci. USA 2009, 106, 20627–20632. [DOI] [PMC free article] [PubMed] [Google Scholar]
- 59. Dempsey J. L., Brunschwig B. S., Winkler J. R., Gray H. B., Acc. Chem. Res. 2009, 42, 1995–2004. [DOI] [PubMed] [Google Scholar]
- 60. McCormick T. M., Calitree B. D., Orchard A., Kraut N. D., Bright F. V., Detty M. R., Eisenberg R., J. Am. Chem. Soc. 2010, 132, 15480–15483. [DOI] [PubMed] [Google Scholar]
- 61. Muckerman J. T., Fujita E., Chem. Commun. 2011, 47, 12456–12458. [DOI] [PubMed] [Google Scholar]
- 62. Dempsey J. L., Winkler J. R., Gray H. B., J. Am. Chem. Soc. 2010, 132, 16774–16776. [DOI] [PubMed] [Google Scholar]
Associated Data
This section collects any data citations, data availability statements, or supplementary materials included in this article.
Supplementary Materials
As a service to our authors and readers, this journal provides supporting information supplied by the authors. Such materials are peer reviewed and may be re‐organized for online delivery, but are not copy‐edited or typeset. Technical support issues arising from supporting information (other than missing files) should be addressed to the authors.
Supplementary


