Abstract
Purpose
To further understanding of the temporal evolution and pathophysiology of adverse ventricular remodeling over the first 60 days following a myocardial infarction (MI) in both the infarcted and remote myocardium, we performed multi-parametric cardiac magnetic resonance imaging (CMR) in a closed-chest chronic Yucatan mini-pig model of reperfused MI.
Methods
Ten animals underwent 90 minute left anterior descending artery occlusion and reperfusion. Three animals served as controls. Multiparametric CMR (1.5T) was performed at baseline, day-2, day-30 and in four animals at day-60 post-MI. Left ventricular volumes and infarct size were measured. T1 and T2 Mapping sequences were performed to measure values in the infarct and remote regions. Remote region collagen fractions were compared between infarcted animals and controls.
Results
Procedure success was 80%. The model created large infarcts (28 ± 5% of left ventricular mass on day-2), which led to significant adverse myocardial remodeling that stabilized beyond 30 days. Native T1 values did not reliably differentiate remote and infarct regions acutely. There was no evidence of remote fibrosis as indicated by partition coefficient and collagen fraction analyses. The infarct T2 values remained elevated up to 60 days post-MI.
Conclusion
Multiparametric CMR in this model showed significant adverse ventricular remodeling 30 days post-MI similar to that seen in humans. In addition, this study demonstrated that remote fibrosis is absent and that infarct T2 signal remains chronically elevated in this model. These findings need to be considered when designing pre-clinical trials using CMR endpoints.
Keywords: Swine, Yucatan Mini-pig, Myocardial Infarction, Multiparametric, Cardiac MRI, Ventricular Remodeling
Graphical abstract
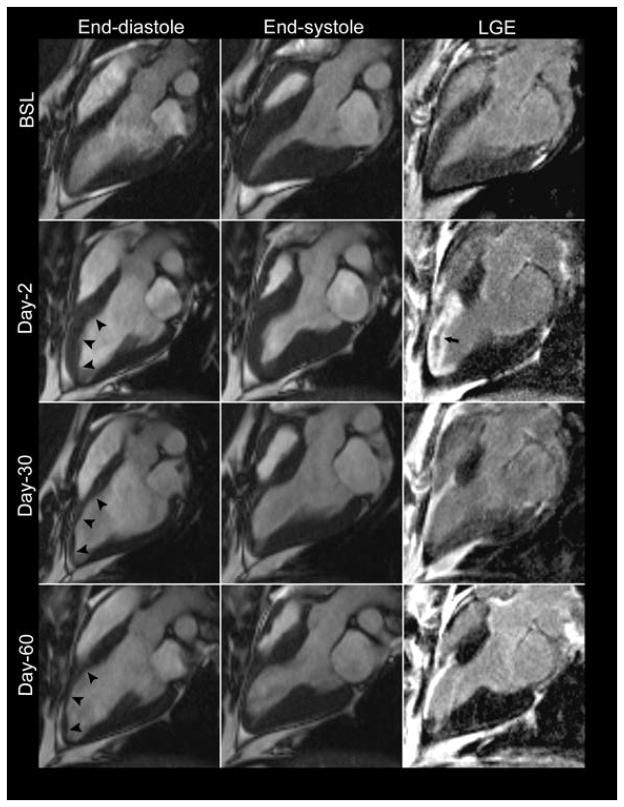
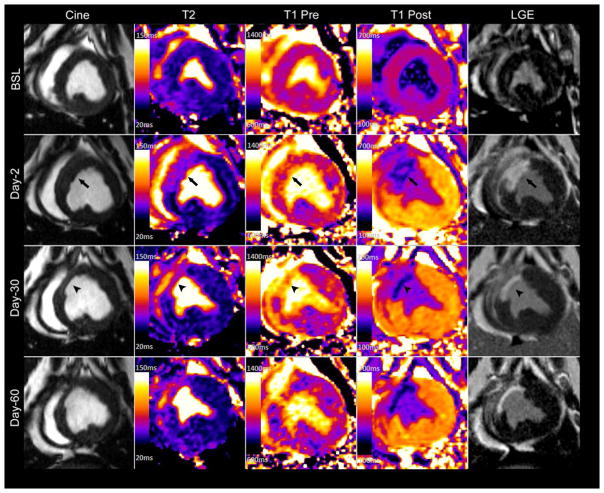
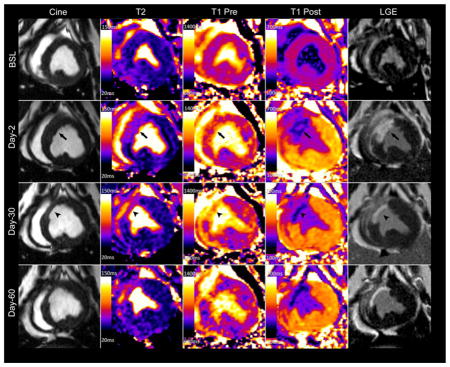
Multiparametric CMR images obtained from a closed-chest chronic Yucatan mini-pig model of reperfused myocardial infarction at different time points. Acutely there is increased wall thickness at the infarct region (arrows) followed by wall thinning (arrow heads) and ventricular remodeling at later time points. Notably, T2 signal remains elevated throughout the study period and acute infarct region is not readily identified on native T1 imaging (T1 Pre).
Introduction
It is estimated that each year approximately 620, 000 Americans experience a new myocardial infarction (MI) and about 295, 000 have a recurrent episode1. In spite of significant reductions in early and late mortality, the incidence of heart failure following MI remains high2–4. Of those who suffer a new MI, the five-year incidence of heart failure ranges from 8% in men 45 to 64 years of age to 31% of African-American men 65 years or older5. Globally, ischemic heart disease is the leading cause heart failure in all country development stratifications 6 and accounts for about a 17.3% of all deaths in high income countries7. In addition, low income countries have also experienced a dramatic rise in ischemic heart disease burden due to socio-economic changes and increasing life span8.Thus, there is a need for new therapies for the prevention and treatment of post-MI related heart failure.
In recent years, there has been a growing interest in modeling chronic ischemia-reperfusion injury percutaneously in Yucatan miniature pigs9–13. Preclinical large animal models have long been the cornerstone of development and validation of heart failure treatments. Swine are commonly used for large animal models in cardiovascular research due to their similarities in heart size and coronary anatomy to the human heart14. Many ischemia reperfusion porcine models15–19 including Yorkshire20–25 and Göttingen pigs26,27 have been well characterized with cardiac magnetic resonance (CMR). Each animal model has their own specific advantages. The Yorkshire swine, or farm pig, is inexpensive and readily available making it attractive for preclinical studies. However, due to their rapid and significant growth, they are too large to undergo CMR imaging in chronic MI studies at a mature age. Alternatively, mini-pig breeds such as the Göttingen and Yucatan pigs have a slower growth rate and reach a growth plateau at a significantly smaller size, which facilitates long-term follow up13,27. As opposed to the Göttingen model, the Yucatan pigs are large enough to use standard percutaneous methods, approach, and equipment used in humans.
CMR has been increasingly used in preclinical and clinical trials for the assessment of left ventricular (LV) remodeling 28–30. It provides accurate and reproducible in vivo myocardial evaluation including left ventricular (LV) volumes, function and infarct size31–33. CMR also allows tissue characterization to detect areas of myocardial edema34, hemorrhage35 and increased extracellular volume, which is often due to diffuse interstitial collagen expansion36. As such, CMR represents the ideal imaging modality for the in vivo study of acute and chronic myocardial remodeling.
In this study, we performed multiparametric CMR in a chronic, closed chest model of reperfused myocardial infarction to understand the temporal evolution and pathophysiology of ventricular remodeling in Yucatan mini-pigs up to day 60 post infarction. Our goal was to generate reproducible infarcts of sufficient size and to validate this model for studying myocardial remodeling. Given their size, Yucatan mini-pigs are ideal for CMR imaging at these remote time points. We also aimed to quantitatively assess remodeling characteristics at different time points in the infarct and remote myocardium regions in this model.
Methods
Yucatan mini-pigs
Thirteen Yucatan mini-pigs were purchased from S&S Farms (Ramona, CA) with an approximate baseline weight of 45 Kg. Three animals were used as controls and ten underwent percutaneous left anterior descending artery (LAD) occlusion. All animal studies were approved by the University of Virginia Institutional Animal Care and Use Committee and complied with the Guide for the Care and Use of Laboratory Animals37.
Myocardial infarction model
All animals received aspirin (325 mg daily) and clopidogrel (75 mg daily) for 48-hours prior to infarct induction to minimize incidence of no-reflow phenomenon at time of reperfusion. Metoprolol (50 mg twice daily) was also given during this period for arrhythmia prophylaxis. For the procedure, anesthesia was induced by intramuscular injection of tiletamine/zolazepam (6 mg/kg, Telazol®, Fort Dodge Animal Health, Iowa). Animals were then intubated with a 5–6 mm endotracheal tube, and ventilated 10–20 cc/kg without supplemental oxygen. General anesthesia was maintained with propofol (10 mg/kg/hr).
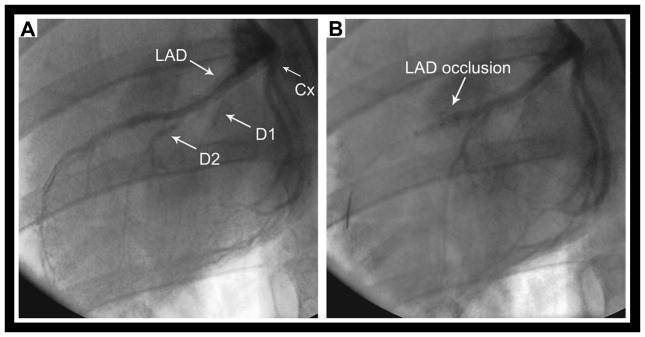
Once anesthetized, a 6-French introducer sheath was placed in the right femoral artery using a cut-down technique. Intravenous (IV) Lidocaine (40 mg) and verapamil (2.5 mg) were given for arrhythmia prophylaxis. Heparin (5000 U IV) was administered prior to catheter insertion and every hour thereafter. A 3.5 Judkins left angioplasty guide catheter was used to engage the left coronary system. The mid LAD was occluded with a 2.5 or 2.75 x 9 mm angioplasty balloon (Maverick®, Boston Scientific, Natick, MA) for 90 minutes just distal to the second diagonal branch (Figure 1a). Coronary occlusion and reperfusion were confirmed by cine angiography (Figure 1b). Ventricular tachycardia (VT) and fibrillation (VF) were treated with chest compression and cardioversion/defibrillation.
Figure 1.
CMR Protocol
For CMR examinations, animals were intubated and mechanically ventilated. Anesthesia was maintained with 1–3% isoflurane. All animals underwent CMR prior to induction of MI (BSL), on day-2 and day-30 post MI using a 1.5T MR scanner (Magnetom Avanto, Siemens Healthcare, Erlangen, Germany) with a body phased array coil. Half of the animals were sacrificed at 30 days, and half of the animals were studied at a 60-day time point. This enabled histological analysis of data at both time points. The CMR protocol consisted of cine balanced steady-state free-precession (bSSFP), cine displacement encoding with stimulated echoes (DENSE), native and post-contrast T1-mapping, T2-mapping, T2*-mapping (on day-2 to differentiate intramyocardial hemorrhage from microvascular obstruction) and phase-sensitive inversion recovery (PSIR) late gadolinium enhancement (LGE) imaging.
Cine bSSFP images of standard long axis views and a complete LV short axis (SA) stack from the base to the apex were obtained (matrix 192 x 192; field of view (FOV) 250 x 250 mm, voxel size 1.3 x 1.3 x 6 mm, 1.2 mm gap, temporal resolution 17 ms, repetition time (TR) 3.4 ms, echo time (TE) 1.43 ms, flip angle (FA) 80°). Cine DENSE (matrix 128 x 128, FOV 350 x 350 mm, voxel size 2.7 x 2.7 x 8 mm, TR 17 ms, TE 1.08 ms, FA 15°) images of selected SA slices at the base, mid and apex were acquired38. A 5-(R5)-5 T1-mapping MOLLI pulse sequence consisting of two inversion pulses separated by ten heartbeats was performed on the same SA slice positions to measure native and post-contrast myocardial T1. Typical MOLLI parameters: matrix 192 x 100, FOV 300 x 194 mm, voxel size 1.9 x 1.6 x 6 mm, TR 3.1 ms, TE 1.2, FA 35°, GRAPPA R=2, 6/8 Partial Fourier acquisition, 38 phase encoding lines per image, temporal footprint 117 ms 39. Pre-contrast T2 prepared T2-maps were obtained using a single-shot SSFP pulse sequence with three T2-prep echo times: 0, 24 and 55 ms (matrix 192 x 100; FOV 300 x 194 mm, voxel size 1.9 x 1.6 x 6 mm, TR 3.2 ms, TE 1.28, FA 70°, GRAPPA R=2, 6/8 Partial Fourier acquisition, 38 phase encoding lines per image, temporal footprint 120 ms)40. Gradient echo T2*-maps of the infarct region were obtained on day-2 (matrix 256 x 153, FOV 400 x 300 ms, voxel size size 2.6 x 1.6 x 10 mm, TR 18.4 ms, Echo times 2.08/4.13/6.18/8.23/10.28/12.33/14.38/16.43 ms). Siemens work-in-progress software (version 448) was used for the parametric imaging. Post-contrast imaging, starting with T1-mapping, was done 10 minutes after administration of 0.15 mmol/kg of gadopentetate dimeglumine (Gd-DTPA) (Magnavist, Bayer Healthcare). PSIR-LGE imaging of the entire LV SA stack was performed approximately 15–20 minutes post-contrast administration (matrix 192 x 192, FOV 250 x 250 mm, voxel size 1.3 x 1.3 x 6 mm, TR 9.2 ms, TE 3.55 ms, FA 25°). The inversion time was adjusted to null the normal myocardium; typically 300 ms.
Image Analysis
LV volume and mass were quantified from CMR images using freely available MATLAB software Segment version 1.9 R2178 (http://segment.heiberg.se)41. Infarct size quantification and T2 and T1 analysis was performed using Qmass software (Medis medical imaging systems, Leiden, The Netherlands). LV volume quantification included determination of the location of the mitral annular plane displacement to reduce partial-volume effects of the basal slice. Infarct size, as a percentage of LV mass, was determined from the LGE SA stack. The papillary muscles were excluded from the LV cavity volume on the bSSFP analysis and excluded from the myocardial mass on the PSIR analysis. T2 and T1 values were measured for each time point by drawing regions of interest (ROI) on the infarct and remote regions of a mid-ventricular slice with the greatest extent of myocardial injury by visualization. The partition coefficient of gadolinium (λ) was calculated for the infarct and non-infarcted regions as a marker of changes in extracellular volume (ECV). The noninfarcted lateral wall was designated as the remote region. Given the expected transmural extent of the infarcts, the area at risk was not quantified. T2*-maps were subjectively assessed for presence of intramyocardial hemorrhage. Regional peak circumferential strain (Ecc) was computed in MATLAB from the cine DENSE images of a mid-ventricular short axis slice to compare changes in strain over the study period using a modified version of DENSEanalysis (ADG image and video analysis, Charlottesville, VA)42,43,43.
Collagen quantification
At the end of the study period, animals were euthanized and the hearts were harvested. Picrosirius red stained slides of the infarct and remote regions were prepared for collagen fraction quantification as previously described44. Ten random fields were imaged per slide. For each field, a bright-field image was digitally subtracted from a polarized image to isolate collagen fibers. Thresholding of this subtraction image was used to identify collagen pixels and thresholding of the bright-field image was used to identify tissue pixels. Collagen content was computed as the ratio of the sum of collagen to the sum of tissue pixels of the ten fields imaged per slide. Perivascular regions were not excluded from the quantification.
Statistical analysis
Continuous variables are reported as mean ± SD. To control for animal-specific factors, such as heart rate, and to assess differences between the time points a repeated-measures mixed effect model was used to compare volumes, ejection fraction, and infarct between time points. For parametric measurements, a repeated-measures mixed-effect model that included an additional fixed effect for myocardial location (infarct versus remote) was performed to assess differences in T1, T2, partition coefficient, and strain in the infarct and remote regions at the various time points. The Tukey-Kramer method was used to correct for all multiple pair-wise comparisons in post-hoc analysis. Values of p < 0.05 were considered statistically significant. All analyses were performed with IBM SAS version 9.4 (IBM Corp., Armonk NY). No statistical analysis was performed on control animals given small sample size (n = 3).
Results
Animal characteristics and survival
Controls gained a mean of 0.32 kgs/day up to 59.0 ± 2.3 kgs by day-30 and 68.0 ± 5.3 kgs by day-60. Infarcted animals gained a mean of 0.25 kgs/day and weighed 62.6 ± 5.4 kgs on day-30 and 75.7 ± 1.4 kgs by day-60.
Acute procedural survival was 90% (9/10) as 1 death occurred after anesthesia recovery on post-op day 1. No animal died during the follow up period. All animals experienced VT or VF with an average onset of 18 ± 9 minutes after balloon inflation. There were no arrhythmias during reperfusion. All but one animal required chest compressions (4 ± 4 min) and cardioversion/defibrillation (4 ± 4 shocks). Epinephrine (0.25 ± 0.2 mg) was used in 6/10 animals. One animal was excluded from the analysis because of coronary no-reflow after balloon deflation, which resulted in a final procedural success rate of 80%.
Multiparametric CMR results
Multiparametric LV remodeling CMR data including volumetric measurements, function, infarct size, parametric mapping of T1, T2 and partition coefficient, and circumferential strain from baseline, day 2, day 30 and day 60 is summarized in Table 1. The average heart rate during imaging is also shown in Table 1. Table 2 summarizes the parameters in the control animals.
Table 1.
Multiparametric left ventricular remodeling by CMR
| Parameter | Baseline (n = 8) | Day-2 (n = 8) | Day-30 (n = 8) | Day-60 (n = 4) |
|---|---|---|---|---|
| HR (bpm) | 108 ± 24 | 96 ± 16 | 115 ± 22‡ | 111 ± 20 |
| EDV (ml) | 70 ± 13 | 80 ± 7 | 83 ± 13* | 86 ± 22* |
| ESV (ml) | 25 ± 7 | 38 ± 8* | 41 ± 6* | 40 ± 6* |
| SV (ml) | 45 ± 11 | 42 ± 7 | 41 ± 12 | 46 ± 14 |
| EF (%) | 64 ± 8 | 53 ± 8* | 50 ± 8* | 53 ± 3* |
| Mass (g) | 82 ± 11 | 96 ± 8* | 92 ± 6* | 116 ± 27*‡§ |
| Infarct Size (%) | 28 ± 5 | 15 ± 3‡ | 12 ± 3‡ | |
| T2, lateral (ms) | 49 ± 2 | 52 ± 4 | 49 ± 2 | 48 ± 3 |
| T2, septal (ms) | 55.1 ± 6† | 67.5 ± 7*† | 71.1 ± 6*† | 79.7 ± 4*‡† |
| Pre-T1, lateral (ms) | 963 ± 45 | 975 ± 31 | 935 ±34 | 912 ± 20 |
| Pre-T1, septal (ms) | 939 ± 19 | 980 ± 53 | 1130 ± 32*‡† | 1123 ± 72*‡† |
| Post-T1, lateral (ms) | 491 ± 79 | 533 ± 25 | 477 ± 37 | 500 ± 30 |
| Post-T1, septal (ms) | 483 ± 72 | 315 ± 19*† | 262 ± 54*† | 280 ± 61*† |
| λ, lateral | 0.348 ± 0.029 | 0.376 ± 0.038 | 0.373 ± 0.038 | 0.345 ± 0.038 |
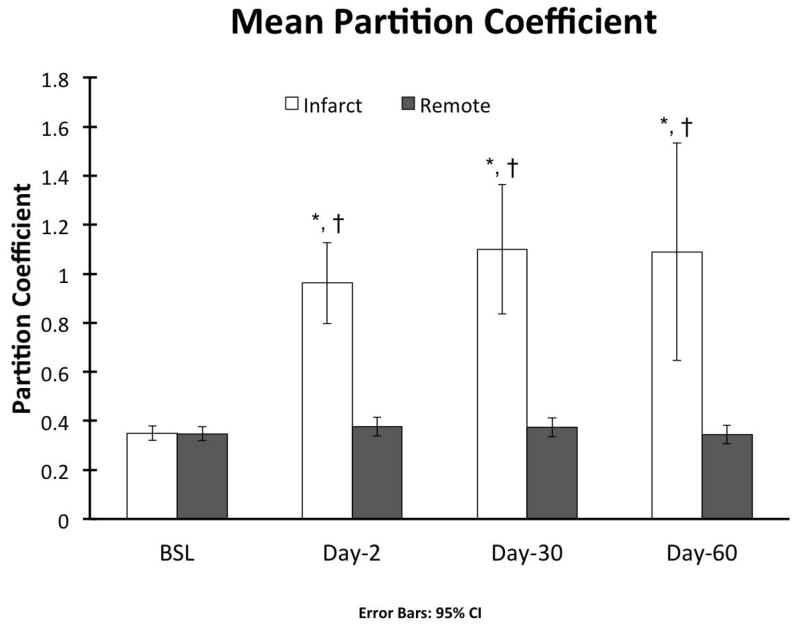
| λ, septal | 0.350 ± 0.029 | 0.963 ± 0.166*† | 1.100 ± 0.263*† | 1.090 ± 0.443*† |
| ECC, lateral (ms) | −0.173 ± 0.042 | −0.179 ± 0.035 | −0.163 ± 0.043 | −0.178 ± 0.031 |
| ECC, septal (ms) | −0.146 ± 0.018 | −0.044 ± 0.015*† | −0.044 ± 0.013*† | −0.045 ± 0.033*† |
HR = heart rate; EDV = end-diastolic volume; ESV = end-systolic volume; SV = stroke volume; EF = ejection fraction; λ = gadolinium partition coefficient; ECC = circumferential strain.
p < 0.05 vs. BSL
p < 0.05 vs. Day-2
p < 0.05 vs. lateral region
p < 0.05 vs. Day-30
Table 2.
Multiparametric CMR of Healthy Controls
| Parameter | Baseline (n = 3) | Day-30 (n = 3) | Day-60 (n = 3) |
|---|---|---|---|
| HR (bpm) | 96.7 ± 11 | 94.3 ± 13 | 102 ± 20 |
| EDV (ml) | 63 ± 8 | 65 ± 2 | 68 ± 7 |
| ESV (ml) | 21 ± 1 | 23 ± 3 | 23 ± 3 |
| SV (ml) | 42 ± 8 | 42 ± 4 | 45 ± 8 |
| EF (%) | 66 ± 4 | 64 ± 5 | 66 ± 5 |
| Mass (g) | 68 ± 8 | 76 ± 5 | 82 ± 5 |
| T2, lateral (ms) | 49 ± 2 | 47 ± 1 | 49 ± 3 |
| T2, septal (ms) | 54 ± 6 | 57 ± 7 | 52 ± 1 |
| Pre-T1, lateral (ms) | 976 ± 9 | 907 ± 37 | 915 ± 39 |
| Pre-T1, septal (ms) | 906 ± 27 | 879 ± 14 | 878 ± 37 |
| Post-T1, lateral (ms) | 529 ± 35 | 474 ± 7 | 490 ± 40 |
| Post-T1, septal (ms) | 520 ± 7 | 461 ± 7 | 470 ± 49 |
| λ, lateral | 0.383 ± 0.047 | 0.353 ± 0.040 | 0.340 ± 0.010 |
| λ, septal | 0.357 ± 0.047 | 0.367 ± 0.041 | 0.353 ± 0.015 |
| ECC, lateral (ms) | −0.130 ± 0.020 | −0.173 ± 0.032 | - |
| ECC, septal (ms) | −0.147 ± 0.015 | −0.157 ± 0.015 | - |
HR = heart rate; EDV = end-diastolic volume; ESV = end-systolic volume; SV = stroke volume; EF = ejection fraction; λ = gadolinium partition coefficient; ECC = circumferential strain.
Infarct characteristics and volumetric remodeling
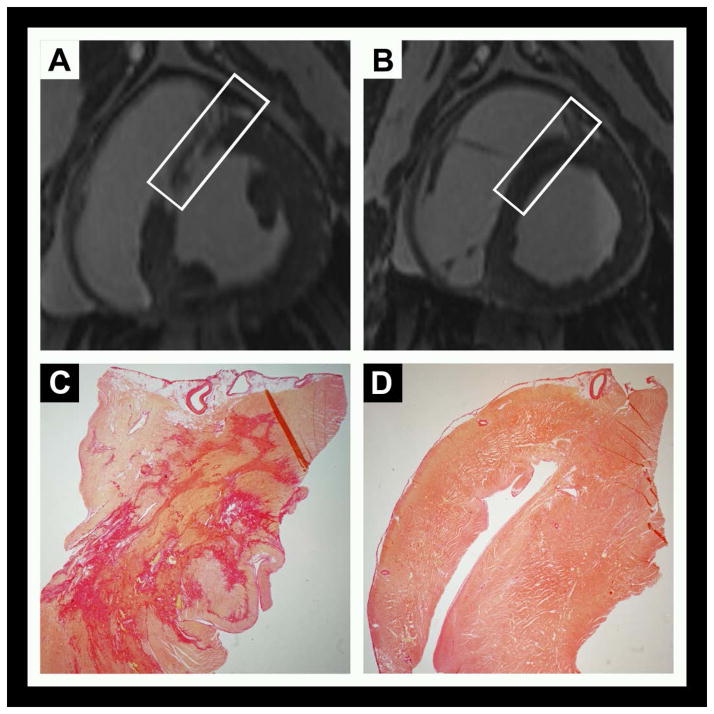
The model reproducibly induced transmural, mid to apical anteroseptal infarctions with average size of 28 ± 5 % of the LV mass on day-2. Infarct size decreased by half to 15 ± 3 % by day-30 (p < 0.001) (Figures 2 and 3). Acutely, wall thickness increased in the infarct region and then thinned by study completion. Microvascular obstruction and/or hemorrhage was observed in all but one animal (Figure 3).
Figure 2.
Figure 3.
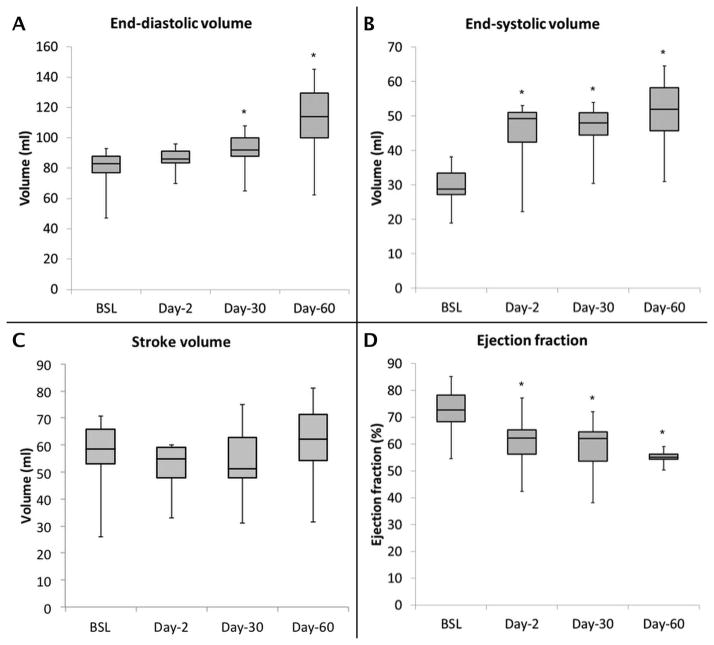
Infarcts were associated with significant LV remodeling during the study period, with increases in end-diastolic volume (EDV) (70 ± 13 vs. 83 ± 13 ml, p < 0.03), end-systolic volume (ESV) (25 ± 7 vs. 41 ± 6 ml, p < 0.001), and a decrease in EF (64 ± 8 vs. 50 ± 8%, p = 0.001) from baseline to day-30 (Figure 4), corresponding to a 19% increase in EDV, a 64% increase in ESV and 22% decrease in EF. The stroke volume was preserved (45 ± 11 vs. 41 ± 12 ml, p = NS) throughout the study period. The random effect controlling for individual animal characteristics was significant indicating that animal-specific parameters have an effect on the measured infarct size and volumetric measurements. LV remodeling stabilized beyond 30 days (p = NS). The rate of change in myocardial mass was similar in the infarcted and control animals.
Figure 4.
Tissue Characteristics
Representative tissue characterization images are illustrated in Figure 5. Baseline pre- (native) and post-contrast T1 values were similar between the infarct and remote regions (Table 1). In the acute setting the exact infarct margin was not easily identified by visual inspection. When ROIs were drawn to match the LGE infarct area, native T1 values did not differ at day-2 between the infarct and remote regions (p = NS). However, after contrast administration there was a clear delineation of the MI area (p < 0.001). At day-30 the infarct region pre-contrast T1 was significantly increased (p < 0.001) with a corresponding reduction in post-contrast T1value (p < 0.001). As expected, there was an increase in the infarct region λ, however no significant change was observed in the remote region throughout the study period (0.348 ± 0.029 vs. 0.373 ± 0.038, p = NS) (Figure 6).
Figure 5.
Figure 6.
At baseline, infarct region T2 values were 55.1 ± 6 ms and increased to 67.5 ± 7 ms (p = 0.006) at day-2, 71.1 ± 6 ms (p = 0.001) at day-30, and 79.7 ± 4 (p < 0.001) at day-60. In the remote region T2 was similar at all time points (p=NS). Notably, the T2 of the septum was higher than that of the lateral wall prior to infarction (p = 0.003) though the difference was much smaller than that observed between the infarct and remote regions following infarction. (p <0.001).
On histology, remote myocardium tissue characteristics at the lateral wall did not change throughout the study period. The collagen fraction in the remote region was low and no different than the controls, 3.5 ± 1.2 vs. 3.4 ± 0.8 %.
Peak Circumferential Strain
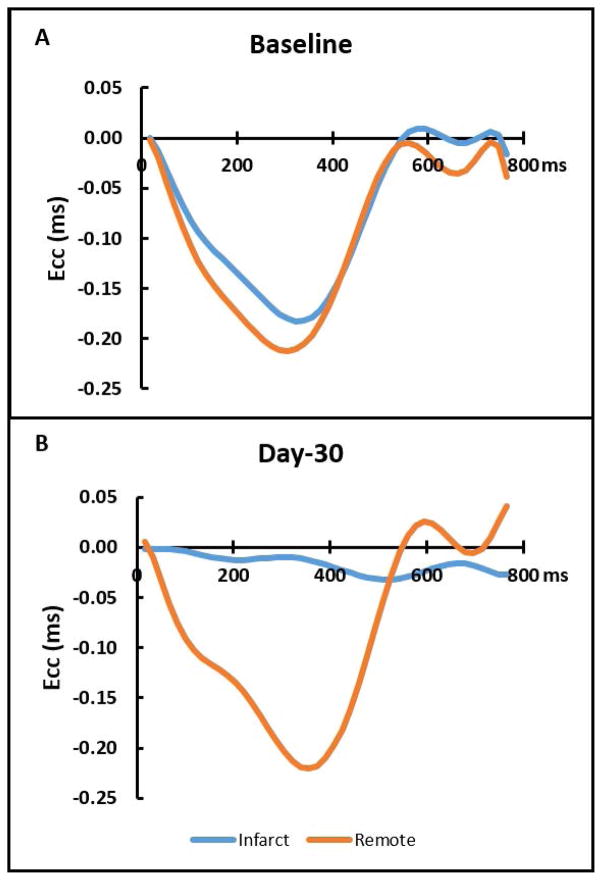
Baseline peak Ecc was slightly lower in the septum as compared to the lateral wall. At day-2, the infarct region Ecc was decreased from baseline (−0.146 ± 0.018 ms vs −0.044 ± 0.015 ms, p < 0.001) and remained unchanged at day-30 (−0.044 ± 0.015 ms vs. −0.044 ± 0.013 ms, p = NS). However, the remote region demonstrated similar strain throughout the study period (−0.173 ± 0.042 ms vs. −0.179 ± 0.035 ms vs. −0.163 ± 0.043 ms, p = NS). Typical DENSE strain-time curves are shown in Figure 7.
Figure 7.
Discussion
In this study, we performed multiparametric CMR on a chronic percutaneous Yucatan mini-pig model of reperfused MI to show that it was a close representation of the human clinical remodeling process. Our goal was to measure myocardial volumes and function, infarct size, strain, T1, T2, and partition coefficient in infarcted and remote myocardium at multiple remote time point’s following reperfused MI to comprehensively characterize the remodeling process with CMR for future preclinical therapeutic trials. Compared to Göttingen mini-pigs’, the Yucatan mini-pigs’ mean baseline LV EF more closely resembles that of human reference values measured by CMR (Göttingen 51.6 ±0.8 %27, Yucatan 63 ± 7.5 %, Human 67 ± 4.6 %45,46). In this model, we created anteroseptal MI using the second diagonal branch of the LAD as a marker for balloon inflation. The mean infarct size was 28% of the LV mass acutely post-MI, consistent with infarct sizes reported in human clinical studies46–48. At 30 days, mean infarct size decreased to 15% of the LV mass and was similar to other chronic reperfusion models in Yucatan mini-pigs 12,13,49. By inducing sizable infarcts, we were able to trigger significant ventricular remodeling. Thirty days post-MI we observed a 22% drop in EF, a 19% increase in EDV, and a 64% increase in ESV, while SV remained unchanged. These adverse changes were not observed in healthy controls. The post-MI EF seen in this model were similar to that observed in human studies46,47. Because EF50 and ESV51 are independent prognostic indicators of increased mortality post-MI, these parameters represent valuable surrogate endpoints for testing therapies targeting post-MI LV remodeling. Thus this model is well suited for pre-clinical translational studies of MI.
Characterization of infarct and non-infarcted myocardium tissue with multiparametric CMR yielded three notable results. First, there is no significant change in the remote region λ, indicating a lack of remote fibrosis post-MI up to 30 or 60 days in this model. This agrees with our histological analysis. Secondly, native T1 does not reliably differentiate the remote and infarct regions acutely in a 1.5T scanner in this porcine model at 48 hours. Thirdly, infarcted myocardium T2 values remain elevated up to 60 days post-MI in this model.
Contrary to murine studies52, our results show that in this swine model there is no increase in remote fibrosis at 30 or 60 days as indicated by partition coefficient of gadolinium and histological collagen fraction analyses. These findings are consistent with those of Kramer et. al. who reported no evidence of remote fibrosis 6 months after anterior myocardial infarction in an open chest sheep model53. Beltrami et. al. addressed this question in a cohort of human hearts harvested at time of transplantation for end-stage ischemic cardiomyopathy54. Using a histological method, they determined that a combination of cellular loss and increased remote interstitial fibrosis contribute to eccentric remodeling process after MI. Later, Marijianowski et al55 found no evidence of increased interstitial fibrosis in the remote myocardium in a similar cohort of hearts using biochemical and histological collagen quantitative methods. More recently, Chan et. al.46 reported increases in remote myocardium ECM based on reduced post-contrast T1 values. However, while the remote region T1 value was lower than controls in the subacute setting, in the chronic phase there was no difference compared to controls. Hence, the early changes in T1 may be related to a transient process such as interstitial edema rather than fibrosis. Alternatively, it is possible that in some patients other factors which affect interstitial fibrosis such as hypertension and diabetes may account for any findings suggesting increased remote fibrosis. Regardless, in our model we did not see evidence of differences in remote region T2, T1 or interstitial fibrosis by histology, and it is not entirely clear that remote fibrosis plays a significant role in infarct remodeling in large animal studies.
In the acute time point, the infarct region was not easily identified by visual inspection of native T1 maps. When ROIs were drawn to match the infarct region as identified by LGE, we observed no significant difference in T1 relaxation compared to baseline or the remote region. Dall’Armellina et. al. have reported that native T1-weighted imaging correlates with the extent of LGE injury, LV function and likelihood of recovery at 6 months post- MI56. In that study the authors used a 3T scanner and excluded regions of microvascular obstruction and hemorrhage from the T1 analysis. Hemorrhagic degradation products, particularly methemoglobin, have paramagnetic effects on T1 and T2 weighted sequences which results in shortening of T1 and T2 relaxation times15. In order to accurately portray the utility of native T1 analysis in the acute MI setting, we did not exclude regions of microvascular obstruction or intramyocardial hemorrhage from the infarction analysis, which may have resulted in the measurement of lower native T1 at the acute time point. Kali et. al. compared the extent of MI size measured with native T1 at 1.5T versus 3T in a canine model57. At 1.5T, native T1 underestimated acute and chronic MI size compared to LGE. Hence, our findings may be explained by the analytical method and field strength used in this model.
In this model, which induces a transmural infarct with significant subsequent wall thinning, we consistently found persistent transmural elevation of the infarct region T2 signal up to 60 days post-MI. Previously Abdel-Aty et al58 have reported that T2 signal normalizes 3 months after reperfused ST-elevation MI (STEMI) and proposed it can be a useful tool to differentiate acute from chronic infarction. However, our findings are in agreement with those of Nilsson et al59, Ripa et al60 and Smulders et al61 who have shown sustained T2 signal in the infarct region 6 and 12 months after STEMI. Hence, the model seems to accurately replicate reperfused MI remodeling as it occurs in clinical practice.
This study has some limitations. The total number of animals studied was small, and the animals were only followed to day 30 or day 60 post infarction. Thus, it is possible that additional remodeling could occur at later time points. However, there was no significant change from 30 to 60 days, suggesting that much of the remodeling process has taken place by 30 days in this model. Given the size of the animals, assessing remodeling at later time points would be feasible. Although hematocrit measurements were not available to calculate ECV, we did not expect significant variations in hematocrit between time points or between animals; as such the partition coefficient should reflect the size of the extracellular space. In the acute period, we performed CMR at a 48-hour time point only and did not evaluate the acute temporal evolution of T2 and hence edema, which has been shown to demonstrate a bi-phasic response following reperfused infarction 62,63. However, the primary goal of this study was to characterize remodeling rather than infarct reperfusion injury, and the 48-hour time point was thus aimed at characterizing the acute infarct size and LV function, rather than to study edema in this model. In our study, we utilized single-shot parametric mapping sequences (MOLLI and T2-Prep T2-Mapping), which are clinically available. These sequences have an inherent trade-off between spatial resolution and temporal foot-print. We utilized multiple approaches to minimize the temporal foot-print of these sequences which was around 120 ms for our study. Similarly, the parametric measurements within the thinned infarct may be susceptible to partial-volume effects. As such, the exact parametric estimates should be interpreted with caution given the achievable temporal and spatial resolution of these T1 and T2 mapping sequences. We observed a higher T2 in the septum at baseline as compared to the lateral wall. This could be due to partial-volume effects from the blood pool, but could also be due to technical factors such as B0 or B1-inhomogeniety which would be expected to be worse in the lateral wall. However, this difference was small compared to the increases in the setting of the infarction.
This study provides a comprehensive CMR assessment of the natural history of chronic infarct remodeling out to 60 days following reperfusion, which is essential for establishing this model and imaging methodology for future pre-clinical trials of therapies that modulate the chronic remodeling process. We demonstrate that the model captures many of the important features of infarct remodeling in humans, specifically the increased ventricular volumes and reduction in LV function. The model demonstrates significant infarct shrinkage with time as also seen in other large animal models (ovine and canine) as well as in humans64–66. Distinct advantages of the Yucatan mini-pig are its slower growth curve as compared to Yorkshire pigs, but adequate size to use the same percutaneous techniques and access that are used in humans. As the chronic ischemic remodeling process is an important target for drug development, this animal model in combination with multiparametric CMR can effectively evaluate targeted therapies over longer periods of time than is feasible with the larger Yorkshire swine.
Conclusion
Multiparametric CMR of the Yucatan mini-pig infarct model is a valuable platform for facilitating the study of novel therapies targeting prevention of left ventricular remodeling following acute myocardial infarction and subsequent heart failure.
Supplementary Material
Acknowledgments
Funding sources: David Lopez received support from NIH-T32 5T32EB003841; Michael Salerno receives support from NIH K23 HL112910; Study was funded by an Investigator initiated UVA-Astra Zeneca strategic partnership grant.
The authors would like to thank Craig Goodman and Jeremy Gatesman for their excellent technical assistance in the performance of the animal procedures. The authors would like to thank Jeffrey Holmes for assistance in performing the assessment of collagen content.
Bibliography
- 1.Go AS, Mozaffarian D, Roger VL, et al. Executive summary: Heart disease and stroke statistics--2014 update: A report from the american heart association. Circulation. 2014;129(3):399–410. doi: 10.1161/01.cir.0000442015.53336.12. [DOI] [PubMed] [Google Scholar]
- 2.Roger VL, Weston SA, Gerber Y, et al. Trends in incidence, severity, and outcome of hospitalized myocardial infarction. Circulation. 2010;121(7):863–869. doi: 10.1161/CIRCULATIONAHA.109.897249. [DOI] [PMC free article] [PubMed] [Google Scholar]
- 3.Yeh RW, Sidney S, Chandra M, Sorel M, Selby JV, Go AS. Population trends in the incidence and outcomes of acute myocardial infarction. N Engl J Med. 2010;362(23):2155–2165. doi: 10.1056/NEJMoa0908610. [DOI] [PubMed] [Google Scholar]
- 4.McManus DD, Gore J, Yarzebski J, Spencer F, Lessard D, Goldberg RJ. Recent trends in the incidence, treatment, and outcomes of patients with STEMI and NSTEMI. Am J Med. 2011;124(1):40–47. doi: 10.1016/j.amjmed.2010.07.023. [DOI] [PMC free article] [PubMed] [Google Scholar]
- 5.Roger VL, Go AS, Lloyd-Jones DM, et al. Executive summary: Heart disease and stroke statistics--2012 update: A report from the american heart association. Circulation. 2012;125(1):188–197. doi: 10.1161/CIR.0b013e3182456d46. [DOI] [PubMed] [Google Scholar]
- 6.Ahern RM, Lozano R, Naghavi M, Foreman K, Gakidou E, Murray CJL. Improving the public health utility of global cardiovascular mortality data: The rise of ischemic heart disease. Population Health Metrics. 2011;9(1):8. doi: 10.1186/1478-7954-9-8. http://dx.doi.org/10.1186/1478-7954-9-8. [DOI] [PMC free article] [PubMed] [Google Scholar]
- 7.Finegold JA, Asaria P, Francis DP. Mortality from ischaemic heart disease by country, region, and age: Statistics from world health organisation and united nations() Int J Cardiol. 2012;168(2):934–945. doi: 10.1016/j.ijcard.2012.10.046. http://www.ncbi.nlm.nih.gov/pmc/articles/PMC3819990/ [DOI] [PMC free article] [PubMed] [Google Scholar]
- 8.Gaziano TA, Bitton A, Anand S, Abrahams-Gessel S, Murphy A. Growing epidemic of coronary heart disease in low- and middle-income countries. Curr Probl Cardiol. 2010;35(2):72–115. doi: 10.1016/j.cpcardiol.2009.10.002. [DOI] [PMC free article] [PubMed] [Google Scholar]
- 9.Beohar N, Flaherty JD, Davidson CJ, et al. Quantitative assessment of regional left ventricular function with cardiac MRI: Three-dimensional centersurface method. Catheterization and Cardiovascular Interventions. 2007;69(5):721–728. doi: 10.1002/ccd.21048. [DOI] [PubMed] [Google Scholar]
- 10.Jang Y, Cho I, Hartaigh B, et al. Viability assessment after conventional coronary angiography using a novel cardiovascular interventional therapeutic CT system: Comparison with gross morphology in a subacute infarct swine model. J Cardiovasc Comput Tomogr. 2015;9(4):321–328. doi: 10.1016/j.jcct.2015.04.006. [DOI] [PMC free article] [PubMed] [Google Scholar]
- 11.Kadota S, Carey J, Reinecke H, et al. Ribonucleotide reductase-mediated increase in dATP improves cardiac performance via myosin activation in a large animal model of heart failure. European Journal of Heart Failure. 2015;17(8):772–781. doi: 10.1002/ejhf.270. [DOI] [PMC free article] [PubMed] [Google Scholar]
- 12.Malliaras K, Smith RR, Kanazawa H, et al. Validation of contrast-enhanced magnetic resonance imaging to monitor regenerative efficacy after cell therapy in a porcine model of convalescent myocardial infarction. Circulation. 2013;128(25):2764–2775. doi: 10.1161/CIRCULATIONAHA.113.002863. [DOI] [PMC free article] [PubMed] [Google Scholar]
- 13.Larose E, Proulx G, Voisine P, et al. Percutaneous versus surgical delivery of autologous myoblasts after chronic myocardial infarction: An in vivo cardiovascular magnetic resonance study. Catheter Cardiovasc Interv. 2010;75(1):120–127. doi: 10.1002/ccd.22204. [DOI] [PubMed] [Google Scholar]
- 14.Dixon JA, Spinale FG. Large animal models of heart failure: A critical link in the translation of basic science to clinical practice. Circ Heart Fail. 2009;2(3):262–271. doi: 10.1161/CIRCHEARTFAILURE.108.814459. [DOI] [PMC free article] [PubMed] [Google Scholar]
- 15.Pedersen SF, Thrysoe SA, Robich MP, et al. Assessment of intramyocardial hemorrhage by T1-weighted cardiovascular magnetic resonance in reperfused acute myocardial infarction. J Cardiovasc Magn Reson. 2012;14:59. doi: 10.1186/1532-429X-14-59. [DOI] [PMC free article] [PubMed] [Google Scholar]
- 16.Fernandez-Jimenez R, Sanchez-Gonzalez J, Aguero J, et al. Fast T2 gradient-spin-echo (T2-GraSE) mapping for myocardial edema quantification: First in vivo validation in a porcine model of ischemia/reperfusion. J Cardiovasc Magn Reson. 2015;17 doi: 10.1186/s12968-015-0199-9. [DOI] [PMC free article] [PubMed] [Google Scholar]
- 17.Ubachs JF, Engblom H, Erlinge D, Jovinge S, Hedstrom E, Carlsson M. Cardiovascular magnetic resonance of the myocardium at risk in acute reperfused myocardial infarction: Comparison of T2-weighted imaging versus the circumferential endocardial extent of late gadolinium enhancement with transmural projection. J Cardiovasc Magn Reson. 2010:12. doi: 10.1186/1532-429X-12-18.. http://dx.doi.org/10.1186/1532-429X-12-18. [DOI] [PMC free article] [PubMed]
- 18.Fernández-Jiménez R, Sánchez-González J, Agüero J, et al. Myocardial edema after ischemia/reperfusion is not stable and Follows a Bimodal pattern: Imaging and histological tissue characterization. J Am Coll Cardiol. 2015;65(4):315–323. doi: 10.1016/j.jacc.2014.11.004. http://dx.doi.org/10.1016/j.jacc.2014.11.004. [DOI] [PubMed] [Google Scholar]
- 19.Jablonowski R, Engblom H, Kanski M, et al. Contrast-enhanced CMR overestimates early myocardial infarct size: Mechanistic insights using ECV measurements on day 1 and day 7. JACC: Cardiovascular Imaging. 2015;8(12):1379–1389. doi: 10.1016/j.jcmg.2015.08.015. http://dx.doi.org/10.1016/j.jcmg.2015.08.015. [DOI] [PubMed] [Google Scholar]
- 20.Williams AR, Hatzistergos KE, Addicott B, et al. Enhanced effect of combining human cardiac stem cells and bone marrow mesenchymal stem cells to reduce infarct size and to restore cardiac function after myocardial infarction. Circulation. 2013;127(2):213–223. doi: 10.1161/CIRCULATIONAHA.112.131110. [DOI] [PMC free article] [PubMed] [Google Scholar]
- 21.Mewton N, Rapacchi S, Augeul L, et al. Determination of the myocardial area at risk with pre- versus post-reperfusion imaging techniques in the pig model. Basic Res Cardiol. 2011;106(6):1247–1257. doi: 10.1007/s00395-011-0214-8. http://dx.doi.org/10.1007/s00395-011-0214-8. [DOI] [PubMed] [Google Scholar]
- 22.Thomas RM, Lim YS, Qiang B, et al. Distal coronary embolization following acute myocardial infarction increases early infarct size and late left ventricular wall thinning in a porcine model. J Cardiovasc Magn Reson. 2015;17(1):1–13. doi: 10.1186/s12968-015-0197-y. http://dx.doi.org/10.1186/s12968-015-0197-y. [DOI] [PMC free article] [PubMed] [Google Scholar]
- 23.Springeling T, Uitterdijk A, Rossi A, et al. Evolution of reperfusion post-infarction ventricular remodeling: New MRI insights. Int J Cardiol. 2013;169(5):354–358. doi: 10.1016/j.ijcard.2013.09.005. http://dx.doi.org/10.1016/j.ijcard.2013.09.005. [DOI] [PubMed] [Google Scholar]
- 24.Robbers LFHJ, Eerenberg ES, Teunissen PFA, et al. Magnetic resonance imaging-defined areas of microvascular obstruction after acute myocardial infarction represent microvascular destruction and haemorrhage. Eur Heart J. 2013;34(30):2346–2353. doi: 10.1093/eurheartj/eht100. [DOI] [PubMed] [Google Scholar]
- 25.Jablonowski R, Nordlund D, Kanski M, et al. Infarct quantification using 3D inversion recovery and 2D phase sensitive inversion recovery; validation in patients and ex vivo. BMC Cardiovasc Disord. 2013;13:110-2261-13-110. doi: 10.1186/1471-2261-13-110. 1471-2261-13-110 [pii] [DOI] [PMC free article] [PubMed] [Google Scholar]
- 26.Williams AR, Suncion VY, McCall F, et al. Durable scar size reduction due to allogeneic mesenchymal stem cell therapy regulates whole-chamber remodeling. Journal of the American Heart Association. 2013;2(3) doi: 10.1161/JAHA.113.000140.. [DOI] [PMC free article] [PubMed] [Google Scholar]
- 27.Schuleri KH, Boyle AJ, Centola M, et al. The adult gottingen minipig as a model for chronic heart failure after myocardial infarction: Focus on cardiovascular imaging and regenerative therapies. Comp Med. 2008;58(6):568–579. [PMC free article] [PubMed] [Google Scholar]
- 28.Hamirani YS, Wong A, Kramer CM, Salerno M. Effect of microvascular obstruction and intramyocardial hemorrhage by CMR on LV remodeling and outcomes after myocardial infarction: A systematic review and meta-analysis. JACC Cardiovasc Imaging. 2014;7(9):940–952. doi: 10.1016/j.jcmg.2014.06.012. [DOI] [PMC free article] [PubMed] [Google Scholar]
- 29.Hinojar R, Botnar R, Kaski JC, Prasad S, Nagel E, Puntmann VO. Individualized cardiovascular risk assessment by cardiovascular magnetic resonance. Future Cardiol. 2014;10(2):273–289. doi: 10.2217/fca.13.102. [DOI] [PubMed] [Google Scholar]
- 30.Saeed M, Van TA, Krug R, Hetts SW, Wilson MW. Cardiac MR imaging: Current status and future direction. Cardiovasc Diagn Ther. 2015;5(4):290–310. doi: 10.3978/j.issn.2223-3652.2015.06.07. [DOI] [PMC free article] [PubMed] [Google Scholar]
- 31.Bellenger NG, Burgess MI, Ray SG, et al. Comparison of left ventricular ejection fraction and volumes in heart failure by echocardiography, radionuclide ventriculography and cardiovascular magnetic resonance; are they interchangeable? Eur Heart J. 2000;21(16):1387–1396. doi: 10.1053/euhj.2000.2011. [DOI] [PubMed] [Google Scholar]
- 32.Kim RJ, Fieno DS, Parrish TB, et al. Relationship of MRI delayed contrast enhancement to irreversible injury, infarct age, and contractile function. Circulation. 1999;100(19):1992–2002. doi: 10.1161/01.cir.100.19.1992. [DOI] [PubMed] [Google Scholar]
- 33.Sugeng L, Mor-Avi V, Weinert L, et al. Quantitative assessment of left ventricular size and function: Side-by-side comparison of real-time three-dimensional echocardiography and computed tomography with magnetic resonance reference. Circulation. 2006;114(7):654–661. doi: 10.1161/CIRCULATIONAHA.106.626143. [DOI] [PubMed] [Google Scholar]
- 34.Arai AE. Magnetic resonance imaging for area at risk, myocardial infarction, and myocardial salvage. J Cardiovasc Pharmacol Ther. 2011;16(3–4):313–320. doi: 10.1177/1074248411412378. [DOI] [PMC free article] [PubMed] [Google Scholar]
- 35.Kumar A, Green JD, Sykes JM, et al. Detection and quantification of myocardial reperfusion hemorrhage using T2*-weighted CMR. JACC Cardiovasc Imaging. 2011;4(12):1274–1283. doi: 10.1016/j.jcmg.2011.08.016. [DOI] [PubMed] [Google Scholar]
- 36.Wong TC, Piehler K, Meier CG, et al. Association between extracellular matrix expansion quantified by cardiovascular magnetic resonance and short-term mortality. Circulation. 2012;126(10):1206–1216. doi: 10.1161/CIRCULATIONAHA.111.089409. [DOI] [PMC free article] [PubMed] [Google Scholar]
- 37.National Research Council (US) Committee for the Update of the Guide for the Care and Use of Laboratory Animals. 2011. [Google Scholar]
- 38.Zhong X, Spottiswoode BS, Meyer CH, Kramer CM, Epstein FH. Imaging three-dimensional myocardial mechanics using navigator-gated volumetric spiral cine DENSE MRI. Magn Reson Med. 2010;64(4):1089–1097. doi: 10.1002/mrm.22503. [DOI] [PMC free article] [PubMed] [Google Scholar]
- 39.Messroghli DR, Greiser A, Frohlich M, Dietz R, Schulz-Menger J. Optimization and validation of a fully-integrated pulse sequence for modified look-locker inversion-recovery (MOLLI) T1 mapping of the heart. J Magn Reson Imaging. 2007;26(4):1081–1086. doi: 10.1002/jmri.21119. [DOI] [PubMed] [Google Scholar]
- 40.Giri S, Chung YC, Merchant A, Mihai G, Rajagopalan S, Raman SV. T2 quantification for improved detection of myocardial edema. J Cardiovasc Magn Reson. 2009:11. doi: 10.1186/1532-429X-11-56.. http://dx.doi.org/10.1186/1532-429X-11-56. [DOI] [PMC free article] [PubMed]
- 41.Heiberg E, Sjögren J, Ugander M, Carlsson M, Engblom H, Arheden H. Design and validation of segment - freely available software for cardiovascular image analysis. BMC Medical Imaging. 2010;10(1):1–13. doi: 10.1186/1471-2342-10-1. http://dx.doi.org/10.1186/1471-2342-10-1. [DOI] [PMC free article] [PubMed] [Google Scholar]
- 42.Spottiswoode BS, Zhong X, Lorenz CH, Mayosi BM, Meintjes EM, Epstein FH. Motion-guided segmentation for cine DENSE MRI. Med Image Anal. 2009;13(1):105–115. doi: 10.1016/j.media.2008.06.016. [DOI] [PMC free article] [PubMed] [Google Scholar]
- 43.Spottiswoode BS, Zhong X, Hess AT, et al. Tracking myocardial motion from cine DENSE images using spatiotemporal phase unwrapping and temporal fitting. IEEE Trans Med Imaging. 2007;26(1):15–30. doi: 10.1109/TMI.2006.884215. [DOI] [PubMed] [Google Scholar]
- 44.Fomovsky GM, Holmes JW. Evolution of scar structure, mechanics, and ventricular function after myocardial infarction in the rat. Am J Physiol Heart Circ Physiol. 2010;298(1):H221–8. doi: 10.1152/ajpheart.00495.2009. [DOI] [PMC free article] [PubMed] [Google Scholar]
- 45.Maceira AM, Prasad SK, Khan M, Pennell DJ. Normalized left ventricular systolic and diastolic function by steady state free precession cardiovascular magnetic resonance. J Cardiovasc Magn Reson. 2006;8(3):417–426. doi: 10.1080/10976640600572889. [DOI] [PubMed] [Google Scholar]
- 46.Chan W, Duffy SJ, White DA, et al. Acute left ventricular remodeling following myocardial infarction: Coupling of regional healing with remote extracellular matrix expansion. JACC Cardiovasc Imaging. 2012;5(9):884–893. doi: 10.1016/j.jcmg.2012.03.015. [DOI] [PubMed] [Google Scholar]
- 47.Eitel I, Desch S, Fuernau G, Hildebrand L, Gutberlet M, Schuler G. Prognostic significance and determinants of myocardial salvage assessed by cardiovascular magnetic resonance in acute reperfused myocardial infarction. J Am Coll Cardiol. 2010:55. doi: 10.1016/j.jacc.2010.01.049. http://dx.doi.org/10.1016/j.jacc.2010.01.049. [DOI] [PubMed]
- 48.Larose E, Rodes-Cabau J, Pibarot P, et al. Predicting late myocardial recovery and outcomes in the early hours of ST-segment elevation myocardial infarction traditional measures compared with microvascular obstruction, salvaged myocardium, and necrosis characteristics by cardiovascular magnetic resonance. J Am Coll Cardiol. 2010;55(22):2459–2469. doi: 10.1016/j.jacc.2010.02.033. [DOI] [PubMed] [Google Scholar]
- 49.GUERRERO M, ATHOTA K, MOY J, et al. Vascular endothelial growth factor-165 gene therapy promotes cardiomyogenesis in reperfused myocardial infarction. J Interv Cardiol. 2008;21(3):242–251. doi: 10.1111/j.1540-8183.2008.00358.x. [DOI] [PubMed] [Google Scholar]
- 50.Risk stratification and survival after myocardial infarction. N Engl J Med. 1983;309(6):331–336. doi: 10.1056/NEJM198308113090602. [DOI] [PubMed] [Google Scholar]
- 51.White HD, Norris RM, Brown MA, Brandt PW, Whitlock RM, Wild CJ. Left ventricular end-systolic volume as the major determinant of survival after recovery from myocardial infarction. Circulation. 1987;76(1):44–51. doi: 10.1161/01.cir.76.1.44. [DOI] [PubMed] [Google Scholar]
- 52.Tsuda T, Gao E, Evangelisti L, Markova D, Ma X, Chu M. Post-ischemic myocardial fibrosis occurs independent of hemodynamic changes. Cardiovasc Res. 2003;59(4):926–933. doi: 10.1016/S0008-6363(03)00519-4. [DOI] [PubMed] [Google Scholar]
- 53.Kramer CM, Lima JA, Reichek N, et al. Regional differences in function within noninfarcted myocardium during left ventricular remodeling. Circulation. 1993;88(3):1279–1288. doi: 10.1161/01.cir.88.3.1279. [DOI] [PubMed] [Google Scholar]
- 54.Beltrami CA, Finato N, Rocco M, et al. Structural basis of end-stage failure in ischemic cardiomyopathy in humans. Circulation. 1994;89(1):151–163. doi: 10.1161/01.cir.89.1.151. [DOI] [PubMed] [Google Scholar]
- 55.Marijianowski MM, Teeling P, Becker AE. Remodeling after myocardial infarction in humans is not associated with interstitial fibrosis of noninfarcted myocardium. J Am Coll Cardiol. 1997;30(1):76–82. doi: 10.1016/s0735-1097(97)00100-9. [DOI] [PubMed] [Google Scholar]
- 56.Dall’Armellina E, Piechnik SK, Ferreira VM, et al. Cardiovascular magnetic resonance by non contrast T1-mapping allows assessment of severity of injury in acute myocardial infarction. J Cardiovasc Magn Reson. 2012;14:15-429X-14-15. doi: 10.1186/1532-429X-14-15. [DOI] [PMC free article] [PubMed] [Google Scholar]
- 57.Kali A, Cokic I, Tang RL, et al. Determination of location, size, and transmurality of chronic myocardial infarction without exogenous contrast media by using cardiac magnetic resonance imaging at 3 T. Circ Cardiovasc Imaging. 2014;7(3):471–481. doi: 10.1161/CIRCIMAGING.113.001541. [DOI] [PMC free article] [PubMed] [Google Scholar]
- 58.Abdel-Aty H, Zagrosek A, Schulz-Menger J, Taylor AJ, Messroghli D, Kumar A. Delayed enhancement and T2-weighted cardiovascular magnetic resonance imaging differentiate acute from chronic myocardial infarction. Circulation. 2004:109. doi: 10.1161/01.CIR.0000127428.10985.C6.. http://dx.doi.org/10.1161/01.CIR.0000127428.10985.C6. [DOI] [PubMed]
- 59.Nilsson JC, Nielsen G, Groenning BA, Fritz-Hansen T, Sondergaard L, Jensen GB. Sustained postinfarction myocardial oedema in humans visualised by magnetic resonance imaging. Heart. 2001:85. doi: 10.1136/heart.85.6.639.. http://dx.doi.org/10.1136/heart.85.6.639. [DOI] [PMC free article] [PubMed]
- 60.Ripa RS, Nilsson JC, Wang Y, Sondergaard L, Jorgensen E, Kastrup J. Short- and long-term changes in myocardial function, morphology, edema, and infarct mass after ST-segment elevation myocardial infarction evaluated by serial magnetic resonance imaging. Am Heart J. 2007:154. doi: 10.1016/j.ahj.2007.06.038.. http://dx.doi.org/10.1016/j.ahj.2007.06.038. [DOI] [PubMed]
- 61.Smulders MW, Bekkers SC, Kim HW, Van Assche LM, Parker MA, Kim RJ. Performance of CMR methods for differentiating acute from chronic MI. JACC Cardiovasc Imaging. 2015;8(6):669–679. doi: 10.1016/j.jcmg.2014.12.030. [DOI] [PMC free article] [PubMed] [Google Scholar]
- 62.Bragadeesh T, Jayaweera AR, Pascotto M, et al. Post-ischaemic myocardial dysfunction (stunning) results from myofibrillar oedema. Heart. 2008;94(2):166–171. doi: 10.1136/hrt.2006.102434. [DOI] [PubMed] [Google Scholar]
- 63.Fernandez-Jimenez R, Garcia-Prieto J, Sanchez-Gonzalez J, et al. Pathophysiology underlying the bimodal edema phenomenon after myocardial ischemia/reperfusion. J Am Coll Cardiol. 2015;66(7):816–828. doi: 10.1016/j.jacc.2015.06.023. [DOI] [PubMed] [Google Scholar]
- 64.Foltz WD, Yang Y, Graham JJ, Detsky JS, Wright GA, Dick AJ. MRI relaxation fluctuations in acute reperfused hemorrhagic infarction. Magn Reson Med. 2006;56(6):1311–1319. doi: 10.1002/mrm.21079. [DOI] [PubMed] [Google Scholar]
- 65.Ghugre NR, Pop M, Barry J, Connelly KA, Wright GA. Quantitative magnetic resonance imaging can distinguish remodeling mechanisms after acute myocardial infarction based on the severity of ischemic insult. Magn Reson Med. 2013;70(4):1095–1105. doi: 10.1002/mrm.24531. [DOI] [PubMed] [Google Scholar]
- 66.Choi CJ, Haji-Momenian S, Dimaria JM, et al. Infarct involution and improved function during healing of acute myocardial infarction: The role of microvascular obstruction. J Cardiovasc Magn Reson. 2004;6(4):917–925. doi: 10.1081/jcmr-200036206. [DOI] [PubMed] [Google Scholar]
Associated Data
This section collects any data citations, data availability statements, or supplementary materials included in this article.


