

Abstract
Morbid obesity is considered a systemic inflammatory state. The objective of this project was to characterize the adipokine, cytokine and chemokine protein profile in serum from control, lean and obese mice. We hypothesized that chemokines and cytokines are altered by caloric restriction and diet-induced obesity as a function of changes in body composition. Six-week-old female C57BL/6N mice (n = 12 per group) were randomized to one of three diets: control (fed ad libitum); lean (30% calorie-restricted regimen relative to control) and diet-induced obese (DIO; high calorie diet, fed ad libitum). Body weight, body composition and food intake were monitored throughout the study. After 10 weeks on the diets, blood samples were collected, and adipokine/cytokine/chemokine serum profiles were measured by antibody array. Lean mice, relative to the control group, displayed increased concentrations of insulin-like growth factor (IGF) binding protein-3, -5 and -6 and adiponectin and decreased IGF-1. These mice also showed increased concentrations of interleukin (IL)-10, IL-12 p40/p70, eotaxin, monocyte chemoattractant protein-5 and SDF-1. In contrast, DIO mice displayed increased leptin, IL-6 and LPS-induced chemokine and decreased concentrations of all chemokines/cytokines measured relative to control mice. As such, these data indicate that DIO may lead to an inflammatory state characterized as a shift towards a T helper lymphocyte type 1–skewed responsiveness. The demonstration of differential adipokine, cytokine and chemokine protein profile in control, lean and DIO mice may have implications for immune responsiveness and risk of disease.
Keywords: adipose tissue, energy balance, inflammation, obesity
Introduction
Obesity has risen dramatically over the past 20 years in the United States and developed countries and is a risk factor for many diseases [1]. Until recently, adipose tissue was considered a quiescent site of energy storage in the form of fat. The latest studies indicate that adipose tissue is an endocrine organ producing a variety of proteins, hormones and cytokines that are often referred to collectively as adipokines. These adipokines possess broad biological activities, including homeostatic and pathologic functions. Many secretory products of adipocytes, including tumor necrosis factor (TNF)-α, interleukin (IL)-6, C-reactive protein, adiponectin, complement factors and leptin, all serve dual roles in energy homeostasis and the immune response [2]. IL-6 signalling, in particular, supports numerous specific local functions, including epidermal barrier homeostasis in skin [3], gastric mucosal homeostasis [4] and as an energy sensor in muscle tissue [5]. It has been hypothesized that adipocytes, similar to macrophages, possess the potential to respond to foreign invaders by mounting an inflammatory response, as evidenced by production of a subset of inflammatory markers [6]. Visceral adipose tissue in particular is thought to be a key regulator of systemic inflammation [7,8]. Adipose-derived proinflammatory cytokines, including monocyte chemoattractant protein-1 (MCP-1), MCP-4, IL-8 and eotaxin have been shown to correlate with body mass index (BMI) and are postulated as critical molecules that link obesity to chronic inflammation [9].
As visceral adiposity increases so does the release of proinflammatory adipokines (cytokines produced by adipocytes) including IL-6, leptin, TNF-α, resistin and angiotensinogen, which is accompanied by a decrease in anti-inflammatory adipokines, including adiponectin [7]. It is hypothesized that low-grade proinflammatory adipokines may play a role in the development of chronic diseases. The fact that weight loss and fat removal can result in a significant improvement in this imbalance further supports this hypothesis [10,11]. Even a modest weight loss of 10% or less can result in marked improvement in the metabolic abnormalities associated with obesity [12]. Weight loss can cause decreases in blood pressure and total blood cholesterol, improve glucose tolerance, reduce the severity of obstructive sleep apnea and reduce circulating markers of inflammation [12,13]. Because approximately 75% of weight lost by dieting is composed of adipose tissue [14], it is believed that the health benefits that result from weight loss are because of reductions in proinflammatory secretions by adipocytes and the influence those secretions have on cell types in other tissues. Indeed, caloric restriction has been observed to rejuvenate the ageing immune system of non-human primates [15]. External factors produced by adipocytes are thought to influence the direction of this immune responsiveness. However, it is currently unclear if obesity is associated with a predominantly type 1 or type 2 immunologic/inflammatory state.
The complex oetiologies of cardiovascular disease and cancer make inference between individual adipokine serum concentrations and risk of disease controversial. Beyond the brief list of adipokines mentioned above, it is unknown what specific adipokine(s) or patterns of adipokine production underlie disease risk. Given the difficulty in controlling multiple confounding variables in the human population, data are sparse regarding the overall patterns of systemic proteins that change in response to adiposity in individuals prior to developing chronic disease.
Consequently, mouse models of genetically and diet-induced obesity or calorie restriction are utilized to infer disease consequences of obesity in humans [16,17]. It is difficult to measure patterns of change in serum proteins via enzyme-linked immunosorbent assay (ELISA), as the amount of serum taken from a mouse at any given point in time is limited. In this study, we sought to characterize the systemic pattern of pro- and anti-inflammatory proteins in control, obese and lean mice at a single time point as a model of healthy normal, obese and lean humans by using an antibody array system (RayBiotech, Norcross, GA, USA). Because this antibody array allows the measurement of 64 proteins from small sample volumes, we were able to characterize the differential adipokine and cytokine protein profiles between normal vs. lean and normal vs. obese mice. In addition, we queried the type 1/type 2 immune response predominant in the obese vs. lean mice. Such an approach holds the potential to identify novel inflammatory mediators that are associated with the obese and lean phenotype.
Materials and Methods
Chemicals
All chemicals were purchased from Sigma (St. Louis, MO) unless otherwise noted.
Animal Model
Briefly, 6-week-old female mice C57BL/6N (Charles River Laboratories, National Cancer Institute, Frederick, MD, USA) with an average beginning weight of 16.5 g were randomized into three groups with 12 mice per group and fed (i) Control diet (19.2% protein, 67.3% carbohydrate and 4.3% fat); (ii) Lean (30% calorie-restricted) diet (27% protein, 54% carbohydrate and 6% fat) and (iii) obese diet (26% protein, 26% carbohydrate and 35% fat). The mice were individually housed and the lean mice were calorie restricted by 30% relative to controls by receiving only daily aliquots providing 70% of total energy (but 100% of required vitamins, minerals, fatty acids and amino acids) compared to control mice [18]. Diets were purchased from Research Diets, Inc. (New Brunswick, NJ, USA) and the diet composition was previously published [18]. All diets were designed to provide similar amounts of micronutrients but variable amounts of calories. After 10 weeks on the diets (or 16 weeks of age), blood samples were drawn from the retro-orbital venous plexus of anaesthetized mice immediately prior to tumor cell injection for the previously published study [18]. Serum samples were frozen at −80 °C until analysis. All the procedures involving animals were approved and monitored by the NCI Animal Care and Use Committees.
Body Fat Content
The level of adiposity of the mice in the various experimental groups was measured using a Bruker minispec NMR analyser mq 10 in non-anaesthetized mice (Bruker Optics, Woodlands, TX, USA) [18].
Cytokine Antibody Array
Serum was obtained from 16-week-old female mice that were 10 weeks on the diets. Then serum from three mice in each treatment group was pooled in to one sample. Pooling serum was necessary given that serum was used for other analysis and there was not enough left from individual mice to use on the array. Briefly, 33.3 ml of serum from each of three mice was pooled to provide the 100 ml of serum necessary for the array protocol. Given that 12 mice were in each diet group there was an n = 4 arrays (quadruplicate arrays) for each treatment group. Because there were three treatment groups, this resulted in 12 total arrays for the experiment. Serum was diluted 1:10 and probed for cytokine profile using the RayBio Mouse Cytokine Antibody Array 3.1 kit according to the manufacturer's instructions (RayBiotech). The RayBio mouse cytokine antibody array is a commercially available system to rapidly and accurately identify very sensitive expression profiles of multiple cytokines. The sensitivity is about 100-fold greater in protein array than compared to ELISA [19–23]. Briefly, membranes were blocked with a blocking buffer, and then 2 ml of pooled serum sample was individually added and incubated at 4 °C overnight. Membranes were washed; 1 ml of primary biotin-conjugated antibody was added and incubated at room temperature for 2 h. The membranes were then incubated with 2 ml of horseradish peroxidase– conjugated streptavidin at room temperature for 30 min and cytokine presence was detected by chemiluminescence. Films of array dots were scanned with a densitometer and converted to densitometric units using Quantity One software (Bio-Rad Laboratories, Hercules, CA, USA) per the manufacturer's instruction. Data were analysed according to recommendations from RayBiotech. Data were imported into an Excel spreadsheet and normalized against a control across membranes, and final values were calculated using the RayBio Murine Cytokine 3.1 Analysis Tool. Four arrays for each group making a total of 12 independent arrays were analysed. The data presented represents the average of the four arrays for each group.
Adiponectin ELISA
Serum adiponectin was quantified in the pooled samples (n = 4 per treatment group) by ELISA according to the manufacturer's instructions (R&D Systems, Minneapolis, MN, USA). Briefly, 50 μl of mouse serum diluted 1:2000 was added to each well and incubated according to instructions. Upon completion of the assay procedure, the plate was read at 450-nm wavelength using a Synergy HT plate reader (Bio-Tek, Winooski, VT, USA).
Insulin-Like Growth Factor-1 ELISA
Serum insulin-like growth factor (IGF)-1 was quantified in the pooled samples (n = 4 per treatment group) by ELISA according to the manufacturer's instructions (R&D Systems). Briefly, 50 ml of mouse serum diluted 1:500 was added to each well and incubated according to instructions. Upon completion of the assay procedure, the plate was read at 450-nm wavelength using a Synergy HT plate reader (Bio-Tek).
Validation of Array Data
Serum from four mice 10 weeks on diet from each group CON, Lean and DIO (diet-induced obese) were identified and utilized for validation of the antibody array data. The concentrations of seven cytokines were quantified in serum collected from four mice in each group (CON, Lean or DIO) at week 10 of the study using the xMAP Bio-Plex cytokine array (Bio-Rad LifeSciences, Hercules, CA, USA) on the Bio-Plex 200 system according to the manufacturer's protocols. The following serum proteins were analysed using this xMAP Bio-Plex system; IL-1β, IL-10, IL-12, IL-13, MCP-1, TNF-α and leptin according to manufacturers’ instructions (Bio-Rad). We selected this subset of serum proteins that were represented on the antibody array for validation of the array methodology. This system is widely utilized to measure multiple cytokines at once in small amounts of serum [24–26].
Statistical Analysis
In this analysis, we assumed a normal distribution for all continuous cytokine data after formally plotting the data of five serum proteins [Axl, IGFBP3, LPS-induced chemokine (LIX), MIP2 and VCAM] using Normal Probability Plots. As normality tests have less power to discriminate between Gaussian and non-Gaussian populations with small sample sizes, the authors evaluated the data using ANOVA and the non-parametric Kruskal–Wallis test. As the tests did not vary significantly, we report the ANOVA results. Determination of significance/non-significance based on the corresponding p-values was comparable. Differences within each cytokine were compared using ANOVA. If the ANOVA test led to a conclusion that there is evidence that the group means differed then the Tukey's multiple comparison test is used. The test compared the difference between each pair of means within cytokine with appropriate adjustment for the multiple testing. Values are reported as mean ± SEM for each compound. The Prism software package (Graph Pad, San Diego, CA, USA) was utilized for this analysis. A p value of less than 0.05 was considered significant.
Results
Characterization of the Mice
Six-week-old female mice with a lean, moderate (control) or obese (DIO) body size phenotype (12 mice per group) were generated by altering caloric intake with three diet regimens over 10 weeks [18]. Figure 1a shows food consumption of female mice by diet for 10 weeks. The DIO mice gained significantly more body weight than mice on the control diet or lean (figure 1b). The increase in body weight correlated with a twofold increase in body fat (table 1). Serum from these mice was collected after 10 weeks on diet or sixteen weeks of age. The increase in body weight in DIO mice correlated with a 1.35-fold increase in body fat over control and a twofold increase in body fat above the lean mice (p < 0.01).
Fig. 1.
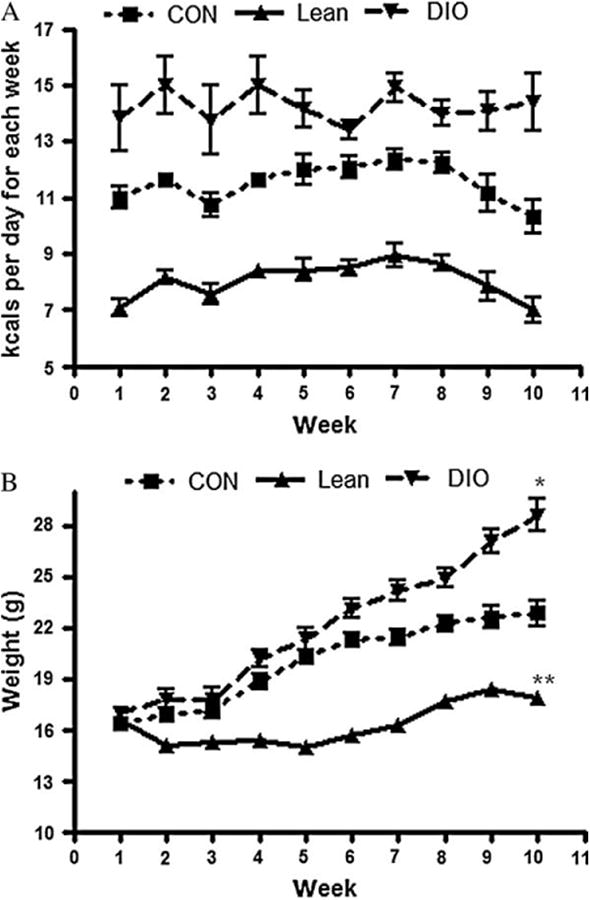
Energy balance in female mice. (A) Kilocalories of food consumed per week by mice maintained on control, diet-induced obesity (DIO) or lean diet across 10 weeks on diets. (B) Body weights of mice maintained on control, DIO or lean diet across 10 weeks on diets. *p < 0.05 (DIO compared to control). **p < 0.05 (lean compared to control).
Table 1. Characteristics of mice after 10 weeks on treatment diets (mean ± s.e.m.) [18].
| Characteristic | |||
|---|---|---|---|
|
| |||
| Treatment | Body weight at 16 weeks (g) | Body fat at 16 weeks (%) | Mean kcal/day |
| Control | 24.4 ± 2.6* | 23.5 ± 4.8 | 11.2 ± 0.68* |
| Lean | 17.5 ± 1.5† | 15.2 ± 3.5† | 7.8 ± 0.46* |
| DIO | 27.8 ± 3.2* | 30.0 ± 3.9* | 13.7 ± 0.61* |
DIO = diet-induced obesity.
Significantly reduced compared to control (p < 0.05).
Significantly increased compared to control and lean (p < 0.05).
Cytokine Antibody Array
Serum from mice in each treatment group was exposed to RayBiotech cytokine antibody arrays. Sixty-one proteins measured by the array were detectable. There were specific changes in these proteins in DIO and lean mice relative to control. In the DIO mice 11 proteins were significantly different from the control, and 24 proteins were significantly different from the lean mice. The lean mice also displayed 10 proteins that were significantly different from control mice (table 2).
Table 2. Chemokine/cytokine densitometric values ± s.e.m. from RayBiotech antibody array analysis of 1:10dilution of mouse serum.
| Treatment | ||||
|---|---|---|---|---|
|
| ||||
| Chemokine/cytokine | Control | Lean | DIO | Classification |
| Axl | 322.0±20.2 | 339.7± 23.75 | 292.0± 5.22 | Receptor |
| BLC | 334 ±11.98 | 337.3 ± 12.16 | 314.5 ± 25.38 | CXC chemokine |
| CD30L | 330.5 ± 12.48 | 329.6 ± 11.93 | 304.7 ± 11.55 | Receptor |
| CD30/TNFRSF8 | 327.5 ± 14.27 | 337.7 ± 9.96 | 294.0 ± 2.837 | Receptor |
| CD40 | 322.9± 14.83 | 325.1± 9.66 | 288.5± 8.60* | Receptor |
| CRG-2 | 325.6 ± 8.21 | 325.9 ±11.13 | 291.7 ± 10.09 | CXC chemokine |
| CTACK | 342.6 ± 12.54 | 329.1 ± 26.92 | 319.4 ± 14.32 | CXC chemokine |
| CXCL16 | 333.2 ± 6.72 | 342.2 ± 12.8 | 314.8 ± 7.65 | CXC chemokine |
| Eotaxin | 266.7 ± 6.17 | 319.1 ± 7.08* | 269.3 ± 9.1 | CC chemokine |
| Eotaxin-2 | 319.7 ± 17.65 | 327.1 ± 21.01 | 288.9 ± 3.88 | CC chemokine |
| FAS Ligand | 322.0 ±11.9 | 309.4 ± 4.6 | 301.3 ± 6.847 | Ligand |
| Fractalkine | 335.9 6.09 | 313.1 18.08 | 345.0 19.57 | CXC chemokine |
| G-CSF | 328.1 ± 4.79 | 339.4 ± 9.5 | 306.0 ± 7.55 | Growth factor |
| GM-CSF | 337.2 ± 7.45 | 345.2 ± 9.335 | 311.5 ± 5.81* | Growth factor |
| IFN-γ | 326.5 15.9 | 325.3 5.17 | 314.1 9.27 | Interferon |
| IGFBP-3 | 353.8 ± 17.75 | 417.3 ± 9.92* | 376.4 ± 6.08 | Binding protein |
| IGFBP-5 | 308.1 ± 5.76 | 349.1 ± 7.56* | 291.8 ± 5.201† | Binding protein |
| IGFBP-6 | 339.6 ± 3.42 | 391.6 ± 12.67* | 315.2 ± 5.01† | Binding protein |
| IL1-alpha | 353.5 ± 9.86 | 351.6 ± 29.65 | 317.1 ± 7.85 | Cytokine |
| IL1-beta | 345.9 ± 8.02 | 332.5 ± 18.45 | 310.9 ± 10.71 | Cytokine |
| IL-2 | 338.0 ± 8.27 | 328.1 ± 16.7 | 310.2 ± 10.95 | Cytokine |
| IL-3 | 336.8 ± 5.22 | 335.7 ± 11.23 | 343.9 ± 24.8 | Cytokine |
| IL-4 | 320.6 ± 14.42 | 342.9 ± 12.71* | 283.1 ±6.15† | Cytokine |
| IL-5 | 320.1 ± 10.00 | 342.5 ± 18.15 | 292.9 ±7.57*† | Cytokine |
| IL-6 | 321.6 ±4.67 | 318.5 ±10.02 | 345.1 6.90* | Cytokine |
| IL-9 | 328.0 ± 14.83 | 352.5 ± 13.54 | 313.5 ±6.70† | Cytokine |
| IL-10 | 319.1 ± 7.39 | 352.6 ± 10.65* | 302.5 ±4.98 | Cytokine |
| IL12-p40/p70 | 324.0 ± 9.89 | 354.9 ± 7.27* | 313.5 ±6.70† | Cytokine |
| IL12-p70 | 350.1 ± 12.19 | 364.3 ± 20.05 | 316.0 ±5.087† | Cytokine |
| IL-13 | 351.0 ±11.3 | 357.2 ± 11.73 | 313.1 ±5.39*† | Cytokine |
| IL-17 | 339.5 ± 10.53 | 340.2 ± 8.054 | 292.1 ±5.65*† | Cytokine |
| KC | 354.0 ± 10.4 | 326.2 ± 18.77 | 305.3 ± 8.12 | CXC chemokine |
| Leptin-R | 349.2 ±11.1 | 350.0 ± 7.055 | 291.2 ± 6.099*† | Receptor |
| Leptin | 307.7 ± 5.66 | 299.8 ±6.195 | 359.9 ± 11.86*† | Cytokine |
| LIX | 417.1 ± 7.01 | 386.5 ± 10.52* | 428.6.0 ± 7.013† | CXC chemokine |
| L-Selectin | 388.0 ± 15.17 | 353.4 ± 18.86 | 419.7 ± 7.86† | Adhesion molecule |
| Lymphotactin | 324.9 ± 9.41 | 306.6 ± 9.05 | 300.1 ± 7.71 | CC chemokine |
| MCP-1 | 331.1 ± 3.8 | 335.1 ± 18.5 | 315.9 ± 8.71 | CC chemokine |
| MCP-5 | 329.5 ± 5.47 | 368.2 ± 8.34* | 301.3 ± 8.93† | CC chemokine |
| M-CSF | 357.7 ± 6.02 | 364.1 ± 18.81 | 333.7 ± 11.05 | Growth factor |
| MIG | 320.0 ± 9.48 | 349.2 ± 28.6 | 296.4 ± 18.3 | CXC chemokine |
| MIP-1-alpha | 333.9 ± 7.13 | 355.8 ± 15.26 | 306.8 ± 6.60† | CC chemokine |
| MIP-1-gamma | 401.2± 7.84 | 402.5± 11.31 | 383.1± 5.39 | CC chemokine |
| MIP-2 | 394.2 ± 6.77 | 414.0 ± 8.63 | 366.4 ± 2.54*† | CXC chemokine |
| MIP-3-beta | 356.4 ± 15.39 | 381.7 ± 5.548 | 352.4 ± 5.35 | CC chemokine |
| MIP-3-alpha | 384.4 ± 16.91 | 343.4 ± 4.56 | 296.4 ± 7.79*† | CC chemokine |
| PF4 | 402.7 ± 7.5 | 416.3 ± 9.93 | 385.0 ± 7.34 | CXC chemokine |
| P-selectin | 410.5 ± 7.14 | 425.1 ± 11.64 | 384.4 ± 5.39*† | Adhesion molecule |
| RANTES | 332.7 ± 9.57 | 355.0 ± 11.05 | 297.5 ± 8.49† | CC chemokine |
| SCF | 269.8 ± 5.23 | 289.9 ± 7.25 | 267.3 ± 5.05 | Growth factor |
| SDF-1 | 269.3 ± 6.52 | 342.0 ± 14.41* | 258.8 ± 2.56† | CXC chemokine |
| TARC | 328.3 ± 8.38 | 333.1 ± 17.56 | 307.1 ± 7.26 | CC chemokine |
| TCA-3 | 339.3 ± 6.6 | 324.9 ± 13.73 | 306.0 ± 7.93 | CC chemokine |
| TECK | 333.5 ± 14.2 | 332.5 ± 6.46 | 315.5 ± 6.23 | CC chemokine |
| TIMP-1 | 318.8 ±11.5 | 353.8 ± 20.05 | 292.5 ± 4.44† | MMP inhibitor |
| TNF-α | 333.3 ± 5.71 | 350.3 ± 16.19 | 309.3 ± 4.79† | Growth factor |
| sTNF-RI | 339.5 ± 9.02 | 321.8 ± 12.73 | 334.5 ± 6.39 | Receptor |
| sTNF-RII | 346.8 ± 12.46 | 356.8 ± 8.86 | 352.1 ± 8.93 | Receptor |
| TPO | 351.0 ± 19.9 | 326.0 ± 15.61 | 340.5 ± 10.10 | Growth factor |
| VCAM-1 | 419.9 ± 8.15 | 410.1 ± 9.53 | 430.8 ± 4.87 | Adhesion molecule |
| VEGF | 315.8 ± 19.47 | 335.3 ± 26.18 | 283.3 ± 8.69 | Growth factor |
G-CSF = granulocyte colony-stimulating factor; GM-CSF = granulocyte monocyte colony stimulating factor; IL = interleukin; IFN-γ = interferongamma; MCP = monocyte chemoattractant protein; MCSF = Macrophage Colony Stimulating Factor; MIG = monokine induced by interferon gamma; PF4 = Platelet factor-4; SCF = stromal cell-derived cytokine; SDF = Stromal cell-derived factor-1; TARC = Thymus and activation-regulated chemokine; TCA = T-cell-activation protein; TECK = thymus expressed chemokine; TIMP = tissue inhibitor of metalloproteinase; TNF-α= tumor necrosis factor-alpha; TPO = Thrombopoietin; VCAM = vascular cell adhesion molecule-1; VEGF = vascular endothelial growth factor.
Significantly different from control. Bold faced values represent those statistically significant values.
Significantly different from lean.
Diet-Associated Effects on Energy Balance-Related Hormonal Pathways
There were significant diet-associated changes in hormonal pathways related to energy balance, as measured by antibody array and ELISA, including IGF-1, leptin and adiponectin. Specifically, IGFBP-3, -5 and -6, as well as adiponectin and leptin proteins, differed in DIO mice, relative to control mice. In lean mice, IGFBP-3, -5 and -6, and adiponectin tended to increase, while IGF-1andleptin tended to decrease. In contrast, IGF-1 and leptin increased in DIO mice, while the leptin receptor and adiponect in were decreased in those mice (figure 2).
Fig. 2.
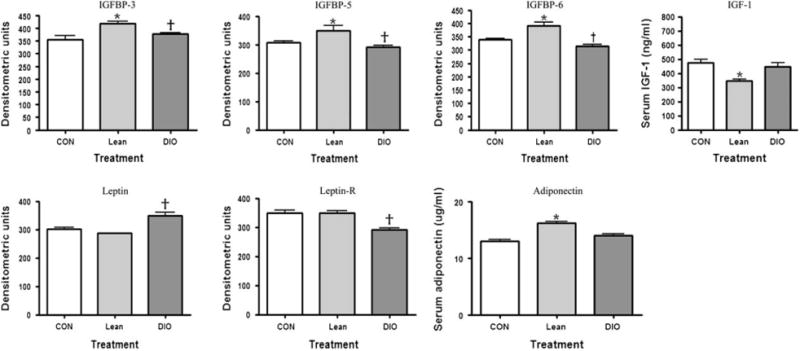
The effect of adiposity on serum markers associated with obesity as measured by antibody array (leptin, leptin-R, IGFBP-3, -5 -6) or enzyme-linked immunosorbent assay [adiponectin, insulin-like growth factor (IGF-1)]. †p < 0.05 (diet-induced obese compared to lean); *p < 0.05 (lean compared to control).
Cytokine and Chemokine Serum Changes
Specific and unique changes in serum cytokines and chemokines, or chemoattracting cytokines, were observed in lean and DIO mice. The cytokines of particular interest showing the major differences between control, lean and DIO mice are illustrated together in figure 3. These include cytokines from the type 1 [interferon (IFN)-γ, IL-2 and IL-12], type 2 (IL-4, IL-5, IL-6 and IL-13) and type 3 (IL-10) immune response classifications. The type 1 cytokines IFN-γ and IL-2 did not change as a result of treatment and are not represented in this figure. Overall, the cytokines tended to decrease in the DIO mice relative to the lean mice with the exception of IL-6, which increased in the DIO compared to control and lean mice.
Fig. 3.

The effect of adiposity on serum markers of cytokines associated with obesity as measured by antibody array. †p < 0.05 (diet-induced obese compared to lean); *p < 0.05 (lean compared to control).
Chemokines are classified into one of four families according to the arrangement of the N-terminal cysteine residues, that is, CXC, CC, CX3C and C chemokines. The CXC chemokine family has the first two cysteine residues separated by one non-conserved amino acid residue (X), whereas the CC family has two cysteines in juxtaposition [27]. The CC (figure 4A) and CXC (figure 4B) chemokines of interest and their changes in control, lean or DIO mice are graphically represented. Overall, the CC chemokines tended to decrease in the obese mice, whereas in the lean mice eotaxin and MCP-5 increased. The CXC chemokine LIX increased in obese mice and SDF-1 and MIP-2 decreased, whereas in the lean mice LIX decreased while SDF-1 increased.
Fig. 4.
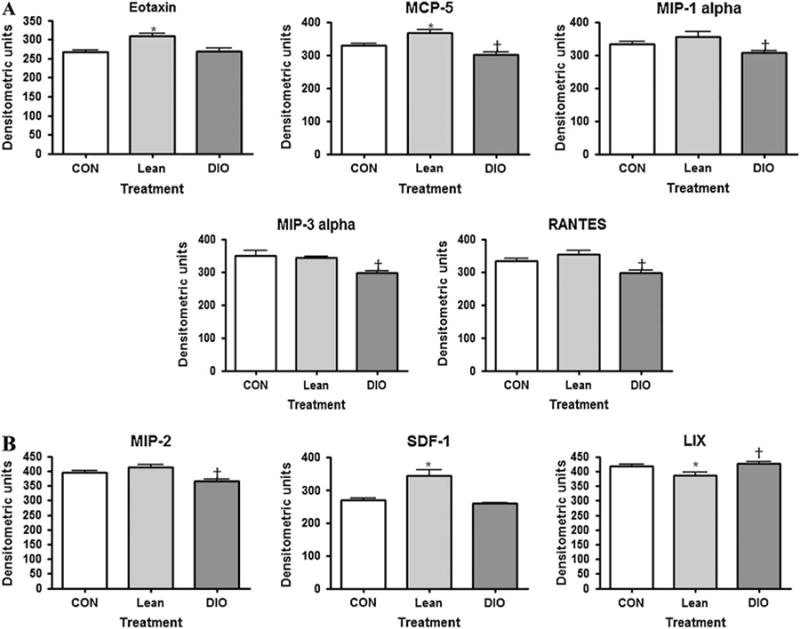
(A) The effect of adiposity on serum markers of CC chemokines associated with obesity as measured by antibody array. †p < 0.05 [diet-induced obese (DIO) compared to lean]; *p < 0.05 (lean compared to control). (B) The effect of adiposity on serum markers of CXC chemokines associated with obesity as measured by antibody array. †p < 0.05 (DIO compared to lean); *p < 0.05 (lean compared to control).
Validation of Array Data
We validated the pattern of serum changes of seven cytokines detected on the RayBiotech antibody array using the Bio-plex system (Bio-Rad Laboratories). Consistent with data generated utilizing the antibody arrays, serum MCP-1 and IL-1β were not different comparing CON to Lean or DIO treatments at 10 weeks on diet. Serum TNF-α was not different comparing CON to Lean (figure 5). However, TNF-α was decreased in the DIO treatment compared to CON, consistent with the antibody array data. Leptin was increased in DIO mice but not statistically different when comparing CON and Lean, consistent with the antibody array data (figure 5). IL-10, IL-12 and IL-13 were below the detectable range of this assay and therefore not measurable (data not shown).
Fig. 5.
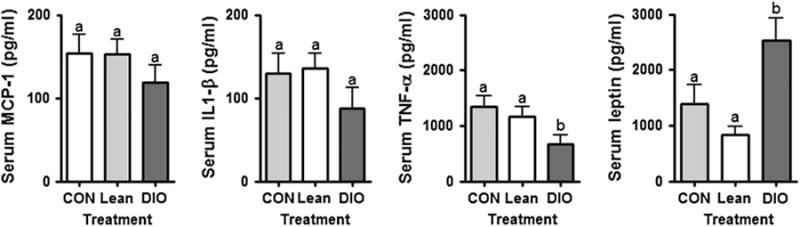
The effect of adiposity on a subset of serum markers associated with obesity; validation study. Serum concentrations for a subset of proteins were validated using the Bio-plex system (Bio-Rad). a = p > 0.05 (no statistically significant difference); b = p < 0.05 statistically significant difference. Interleukin (IL)-10, IL-12 and IL13 were below the detectable range of this assay.
Discussion
In this study we determined the systemic production of adipokines, cytokines and chemokines in response to alterations in body weight because of a range of caloric intakes in mice using antibody array technology. Antibody arrays represent one of the high-throughput techniques that are able to detect multiple proteins simultaneously. A primary advantage of quantitating multiple immunoregulatory proteins is the establishment of associations between patterns of expression of types 1, 2 and 3 cytokines, adiposity and risk of co-morbid conditions. This more rigorously represents the complexity of the immune response, does not rely on the predictive value of one or two proteins to make etiologic associations and may allow greater statistical power to overcome intra-individual variation among single biomarkers of risk. Another advantage of this technology over other proteomic approaches is that the measured proteins are known allowing a biological interpretation of the results. Antibody arrays are high-throughput tools that improve the functional characterization of molecular bases for disease.
The three caloric intakes predictably induced three different adiposity patterns corresponding to control, lean and obese mice, as assessed by body composition. Previously, we showed that the 30% CR, CON and DIO diets induced body fat phenotypes in female mice similar to those found in women considered lean (BMI less than 25), overweight (BMI between 25 and 30), and obese (BMI higher than 30) respectively [28]. Differential levels of adiposity corresponded with serum changes in obesity-associated hormonal markers, including leptin, leptin-R and the IGF axis as observed in humans. Typically, these types of data are collected in various disease conditions associated with obesity, and it is difficult to infer cause and effect in the changes in adipokines observed. Moreover, data associating adipokine/cytokine/chemokine patterns with specific health conditions are sparse. We view this descriptive study as a necessary first step in understanding the effect of adiposity on these serum patterns of these proteins. Because these data are observational, we cannot impute risk of certain health conditions to specific adipokine/chemokine/cytokine patterns. However, these data can be discussed in light of murine and human chemokine/cytokine data that link these patterns to specific disease risk.
We observed significant changes in the cytokine/chemokine profile of lean and DIO mice, relative to control mice. It is hypothesized that a low-grade proinflammatory state is generated by the imbalance between proinflammatory and anti-inflammatory adipokines and may play a role in development of chronic diseases [10]. Because the source of the proteins measured in this study originate from myriad cell types, including adipocytes, immune and epithelial cells, it is not possible to ascertain the source of production. Regardless of the source, these data indicate that modulating body weight/adiposity alters the profile of a number of proand anti-inflammatory proteins in mouse serum and provides a reference point for comparisons of other animal models of obesity and systemic changes in mediators of inflammation. We acknowledge that there are multiple ways to induce obesity beyond the DIO diet used in this study, and these profiles could differ based on the obesity regimen employed.
Immune response can generally be described as being skewed towards either a type 1 (i.e. driven by the maturation of T helper 1 (Th1) cells associated with cell-mediated immunity) or type 2 (i.e. driven by the maturation of T helper 2(Th2) cells associated with humoral immunity) response. A third category of response, referred to as a type 3 response, is characterized by suppression of naïve or unexposed T lymphocytes to develop into Th1 or Th2 responses by activation of either T helper type 3 cells (Th3) or T regulatory (Treg) cells. Th3 and Tr1 cells produce immunosuppressive cytokines such as IL-10 and TGF-β to accomplish their associated immunosuppressive functions [29]. A type 1 response, characterized by the predominance of the production of IFN-γ, is typically evoked during infections and pathologic autoimmune conditions, while a type 2 response, characterized by the production of IL-4, is typically evoked in an allergic response. When one response strongly predominates, this can dictate the type of protective response of the immune system as well as promote different immunepathological responses [30]. The type 2 cytokines IL-4, IL-5 and IL-13 were all decreased in the obese group compared to lean. Yet the predominant type 1 cytokine, IFN-γ did not change with treatment, indicating a dominance of type 1 immune response in the DIO group. However, this observation is complicated by the fact that IL-6 (type 2) was increased in the obese group.
In direct opposition to the DIO group, in lean animals IL-4 (type 2), IL-12 (type 1) and IL-10 (type 3) were all increased. Unlike the DIO group, the changes in cytokines appeared to be very specific to those three cytokines, making a general pattern of immune changes difficult to determine. A useful way to portray the type 2/type 1 immune balance is by reporting the IL-4/IFN-γ ratio. The ratio for the control group was 1.0, 1.1 for the lean group and 0.87 for the DIO group. This ratio would argue for a type 1–skewed response in the obese mice.
Taking the two observations together in dicates a general increase in overall chronic immune function in the obese group with regard to type 1 and type 2cytokines. A recent review highlights the importance of the immune system and inflammatory pathways and disease [31]. Many tissues are affected by proinflammatory cytokines causing recognizable features of type 2 diabetes and metabolic syndrome [32]. Inflammation is a plausible mechanism that links susceptibility factors for type 2 diabetes. This proteomic array technology could be used to identify those obese individuals with a proinflammatory profile that may induce susceptibility to chronic diseases.
Chemokines, or chemoattractant cytokines, are produced by many cell types in response to stimulus and also play a major role in acute and chronic inflammation. They are important in regulating leukocyte traffic during infection, cell adhesion, immune response, angiogenesis and metastasis [33–35]. It is interesting to note that most of the chemokines decreased in the obese group with the exception of LIX. LIX acts to attract and activate neutrophils, which amplifies the inflammatory cascade [36]. The CC chemokines MCP-5, MIP-1-alpha, RANTES and MIP-3-alpha and the CXC chemokine MIP-2 all decreased in response to obesity. This pattern would argue for a shift in the chemokine gradient to lower circulating chemokine levels and may indicate increased chemokines in specific tissues. Indeed, Chen et al. [37] observed elevated adipose expression of the chemokines MCP-1 and MCP-3 in DIO mice. In our current study, the CXC chemokine LIX declined but SDF-1 increased in the lean group. In addition, the CC chemokines eotaxin and MCP-5 were increased in lean mice. This is in contrast to a previously reported observation by Vasudevan et al. [38], showing serum eotaxin levels were significantly higher in obese mice and positively correlated with adipose mRNA eotaxin levels. One possible explanation for this difference is that our mice were on the DIO diet for only 10 weeks while mice in the other study were on the DIO diet for 26 weeks. It is possible that changes in inflammatory serum bio-markers may change over time, with early acute changes followed by a different pattern of change chronically. Further studies of temporal changes are needed.
The cell-surface adhesion molecules P- and L-selectin were also increased in the DIO mice. The shedding of adhesion molecules is thought to be a proinflammatory event. Upregulation and increased concentrations of soluble adhesion molecules are associated with many cardiovascular risk factors and should to be an initiating event [39]. Soluble P-selectin levels were observed to be elevated among healthy women at risk for future vascular events [40].
A similar observation was made with regard to soluble P-selectin concentrations and colorectal cancer risk highlighting an inflammatory mechanism which the oetiologies of atherogenesis and carcinogenesis may share [41]. This increase in adhesion molecules in obese mice may represent relevant biomarkers for obese individuals to indicate those individuals with early changes important in cardiovascular disease progression.
This characterization of the serum profile represents an important attempt to describe the changes in key immunologic mediators in response to diet-induced changes in adiposity. Our observations indicate that DIO may lead to a inflammatory state characterized as a shift towards a Th1-skewed responsiveness, while the lean diet regimen may lead to a more specific change in immune responsiveness, consistent with long-established observations in calorie-restricted mice [15]. Our data extend observations of immunologic mediator production beyond that of leptin/adiponectin/IGF axis by describing chemokine and cytokine production in addition to the traditional adipokines associated with specific anthropomorphic patterns. Data presented here justify these studies by providing biologically plausible evidence for (i) the potential to identify novel inflammatory mediators that are associated with obesity and caloric restriction; (ii) differential immunologic mediator production associated with adiposity. Clinical applications include disease marker discovery for possible diagnosis, prognosis and modifications associated with disease development and progression. Furthermore, identification and validation of protein expression patterns, characteristic of disease progression, and tumor subtypes may result in tailored therapies in clinical management of patients.
Acknowledgments
The authors acknowledge Dr Jim Wagner, Michigan State University and Dr Venugopal Gangur, Michigan State University for technical expertise in analysing the chemokine and cytokine data. The authors acknowledge Dr Elizabeth Gardner, Michigan State University for critical review of the article.
Research supported in part by the National Cancer Institute Cancer Prevention Fellowship Program and the Breast Cancer Research Foundation.
References
- 1.Hedley AA, Ogden CL, Johnson CL, Carroll MD, Curtin LR, Flegal KM. Prevalence of overweight and obesity among US children, adolescents, and adults, 1999-2002. JAMA. 2004;291:2847–2850. doi: 10.1001/jama.291.23.2847. [DOI] [PubMed] [Google Scholar]
- 2.Juge-Aubry CE, Henrichot E, Meier CA. Adipose tissue: a regulator of inflammation. Best Pract Res Clin Endocrinol Metab. 2005;19:547–566. doi: 10.1016/j.beem.2005.07.009. [DOI] [PubMed] [Google Scholar]
- 3.Wang XP, Schunck M, Kallen KJ, et al. The interleukin-6 cytokine system regulates epidermal permeability barrier homeostasis. J Invest Dermatol. 2004;123:124–131. doi: 10.1111/j.0022-202X.2004.22736.x. [DOI] [PubMed] [Google Scholar]
- 4.Giraud AS, Jackson C, Menheniott TR, Judd L. Differentiation of the gastric mucosa IV Role of trefoil peptides and IL-6 cytokine family signaling in gastric homeostasis. Am J Physiol Gastrointest Liver Physiol. 2007;292:G1–G5. doi: 10.1152/ajpgi.00382.2006. [DOI] [PubMed] [Google Scholar]
- 5.Steensberg A. The role of IL-6 in exercise-induced immune changes and metabolism. Exerc Immunol Rev. 2003;9:40–47. [PubMed] [Google Scholar]
- 6.Lin Y, Lee H, Berg AH, Lisanti MP, Shapiro L, Scherer PE. The lipopolysaccharide-activated toll-like receptor (TLR)-4 induces synthesis of the closely related receptor TLR-2 in adipocytes. J Biol Chem. 2000;275:24255–24263. doi: 10.1074/jbc.M002137200. [DOI] [PubMed] [Google Scholar]
- 7.Lyon CJ, Law RE, Hsueh WA. Minireview: adiposity, inflammation, and atherogenesis. Endocrinology. 2003;144:2195–2200. doi: 10.1210/en.2003-0285. [DOI] [PubMed] [Google Scholar]
- 8.Schaffler A, Muller-Ladner U, Scholmerich J, Buchler C. Role of adipose tissue as an inflammatory organ in human diseases. Endocr Rev. 2006;27:449–467. doi: 10.1210/er.2005-0022. [DOI] [PubMed] [Google Scholar]
- 9.Hashimoto I, Wada J, Hida A, et al. Elevated serum monocyte chemoattractant protein-4 and chronic inflammation in overweight subjects. Obesity (Silver Spring) 2006;14:799–811. doi: 10.1038/oby.2006.93. [DOI] [PubMed] [Google Scholar]
- 10.Esposito K, Giugliano G, Scuderi N, Giugliano D. Role of adipokines in the obesity-inflammation relationship: the effect of fat removal. Plast Reconstr Surg. 2006;118:1048–1057. doi: 10.1097/01.prs.0000232281.49432.ce. [DOI] [PubMed] [Google Scholar]
- 11.Cottam DR, Mattar SG, Barinas-Mitchell E, et al. The chronic inflammatory hypothesis for the morbidity associated with morbid obesity: implications and effects of weight loss. Obes Surg. 2004;14:589–600. doi: 10.1381/096089204323093345. [DOI] [PubMed] [Google Scholar]
- 12.Eckel RH, Krauss RM. American Heart Association call to action: obesity as a major risk factor for coronary heart disease. AHA Nutrition Committee Circulation. 1998;97:2099–2100. doi: 10.1161/01.cir.97.21.2099. [DOI] [PubMed] [Google Scholar]
- 13.Klein S, Burke LE, Bray GA, et al. Clinical implications of obesity with specific focus on cardiovascular disease: a statement for professionals from the American Heart Association Council on Nutrition, Physical Activity, and Metabolism: endorsed by the American College of Cardiology Foundation. Circulation. 2004;110:2952–2967. doi: 10.1161/01.CIR.0000145546.97738.1E. [DOI] [PubMed] [Google Scholar]
- 14.Ballor DL, Poehlman ET. Exercise-training enhances fat-free mass preservation during diet-induced weight loss: a meta-analytical finding. Int J Obes Relat Metab Disord. 1994;18:35–40. [PubMed] [Google Scholar]
- 15.Nikolich-Zugich J, Messaoudi I. Mice and flies and monkeys too: caloric restriction rejuvenates the aging immune system of non-human primates. Exp Gerontol. 2005;40:884–893. doi: 10.1016/j.exger.2005.06.007. [DOI] [PubMed] [Google Scholar]
- 16.Robinson SW, Dinulescu DM, Cone RD. Genetic models of obesity and energy balance in the mouse. Annu Rev Genet. 2000;34:687–745. doi: 10.1146/annurev.genet.34.1.687. [DOI] [PubMed] [Google Scholar]
- 17.Hursting SD, Nunez NP, Patel AC, Perkins SN, Lubet RA, Barrett JC. The utility of genetically altered mouse models for nutrition and cancer chemoprevention research. Mutat Res. 2005;576:80–92. doi: 10.1016/j.mrfmmm.2004.11.019. [DOI] [PubMed] [Google Scholar]
- 18.Yakar S, Nunez NP, Pennisi P, et al. Increased tumor growth in mice with diet-induced obesity: impact of ovarian hormones. Endocrinology. 2006;147:5826–5834. doi: 10.1210/en.2006-0311. [DOI] [PubMed] [Google Scholar]
- 19.Huang RP. Detection of multiple proteins in an antibody-based protein microarray system. J Immunol Methods. 2001;255:1–13. doi: 10.1016/s0022-1759(01)00394-5. [DOI] [PubMed] [Google Scholar]
- 20.Lin Y, Huang R, Chen LP, et al. Profiling of cytokine expression by biotin-labeled-based protein arrays. Proteomics. 2003;3:1750–1757. doi: 10.1002/pmic.200300530. [DOI] [PubMed] [Google Scholar]
- 21.Xu Y, Kulkosky J, Acheampong E, Nunnari G, Sullivan J, Pomerantz RJ. HIV-1-mediated apoptosis of neuronal cells: proximal molecular mechanisms of HIV-1-induced encephalopathy. Proc Natl Acad Sci USA. 2004;101:7070–7075. doi: 10.1073/pnas.0304859101. [DOI] [PMC free article] [PubMed] [Google Scholar]
- 22.Sack RA, Conradi L, Krumholz D, Beaton A, Sathe S, Morris C. Membrane array characterization of 80 chemokines, cytokines, and growth factors in open- and closed-eye tears: angiogenin and other defense system constituents. Invest Ophthalmol Vis Sci. 2005;46:1228–1238. doi: 10.1167/iovs.04-0760. [DOI] [PubMed] [Google Scholar]
- 23.Celis JE, Gromov P, Cabezon T, et al. Proteomic characterization of the interstitial fluid perfusing the breast tumor microenvironment: a novel resource for bio-marker and therapeutic target discovery. Mol Cell Proteomics. 2004;3:327–344. doi: 10.1074/mcp.M400009-MCP200. [DOI] [PubMed] [Google Scholar]
- 24.Karnoub AE, Dash AB, Vo AP, et al. Mesenchymal stem cells within tumour stroma promote breast cancer metastasis. Nature. 2007;449:557–563. doi: 10.1038/nature06188. [DOI] [PubMed] [Google Scholar]
- 25.Sainathan SK, Hanna EM, Gong Q, et al. Granulocyte macrophage colony-stimulating factor ameliorates DSS-induced experimental colitis. Inflamm Bowel Dis. 2008;14:88–99. doi: 10.1002/ibd.20279. [DOI] [PMC free article] [PubMed] [Google Scholar]
- 26.Yamamoto Y, Kurachi M, Yamaguchi K, Oda T. Stimulation of multiple cytokine production in mice by alginate oligosaccharides following intraperitoneal administration. Carbohydr Res. 2007;342:1133–1137. doi: 10.1016/j.carres.2007.02.015. [DOI] [PubMed] [Google Scholar]
- 27.Fernandez EJ, Lolis E. Structure, function, and inhibition of chemokines. Annu Rev Pharmacol Toxicol. 2002;42:469–499. doi: 10.1146/annurev.pharmtox.42.091901.115838. [DOI] [PubMed] [Google Scholar]
- 28.Nunez NP, Perkins SN, Smith NC, et al. Obesity accelerates mouse mammary tumor growth in the absence of ovarian hormones. Nutr Cancer. 2008;60:534–541. doi: 10.1080/01635580801966195. [DOI] [PubMed] [Google Scholar]
- 29.Cools N, Ponsaerts P, Van Tendeloo VF, Berneman ZN. Regulatory T cells and human disease. Clin Dev Immunol. 2007:89195. doi: 10.1155/2007/89195. [DOI] [PMC free article] [PubMed] [Google Scholar]
- 30.Romagnani S. Lymphokine production by human T cells in disease states. Annu Rev Immunol. 1994;12:227–257. doi: 10.1146/annurev.iy.12.040194.001303. [DOI] [PubMed] [Google Scholar]
- 31.Pickup JC. Inflammation and activated innate immunity in the pathogenesis of type 2 diabetes. Diabetes Care. 2004;27:813–823. doi: 10.2337/diacare.27.3.813. [DOI] [PubMed] [Google Scholar]
- 32.Pickup JC, Mattock MB. Activation of the innate immune system as a predictor of cardiovascular mortality in Type 2 diabetes mellitus. Diabet Med. 2003;20:723–726. doi: 10.1046/j.1464-5491.2003.00990.x. [DOI] [PubMed] [Google Scholar]
- 33.Baggiolini M, Dewald B, Moser B. Human chemokines: an update. Annu Rev Immunol. 1997;15:675–705. doi: 10.1146/annurev.immunol.15.1.675. [DOI] [PubMed] [Google Scholar]
- 34.Murphy PM. Chemokines and the molecular basis of cancer metastasis. N Engl J Med. 2001;345:833–835. doi: 10.1056/NEJM200109133451113. [DOI] [PubMed] [Google Scholar]
- 35.Murphy PM. Chemokine receptors: structure, function and role in microbial pathogenesis. Cytokine Growth Factor Rev. 1996;7:47–64. doi: 10.1016/1359-6101(96)00009-3. [DOI] [PubMed] [Google Scholar]
- 36.Chandrasekar B, Melby PC, Sarau HM, et al. Chemokinecytokine cross-talk The ELR+CXC chemokine LIX (CXCL5) amplifies a proinflammatory cytokine response via a phosphatidylinositol 3-kinase-NF-kappa B pathway. J Biol Chem. 2003;278:4675–4686. doi: 10.1074/jbc.M207006200. [DOI] [PubMed] [Google Scholar]
- 37.Chen A, Mumick S, Zhang C, et al. Diet induction of monocyte chemoattractant protein-1 and its impact on obesity. Obes Res. 2005;13:1311–1320. doi: 10.1038/oby.2005.159. [DOI] [PubMed] [Google Scholar]
- 38.Vasudevan AR, Wu H, Xydakis AM, et al. Eotaxin and obesity. J Clin Endocrinol Metab. 2006;91:256–261. doi: 10.1210/jc.2005-1280. [DOI] [PubMed] [Google Scholar]
- 39.Hope SA, Meredith IT. Cellular adhesion molecules and cardiovascular disease. Part II. Their association with conventional and emerging risk factors, acute coronary events and cardiovascular risk prediction. Int Med J. 2003;33:450–462. doi: 10.1046/j.1445-5994.2003.00379.x. [DOI] [PubMed] [Google Scholar]
- 40.Ridker PM, Buring JE, Rifai N. Soluble P-selectin and the risk of future cardiovascular events. Circulation. 2001;103:491–495. doi: 10.1161/01.cir.103.4.491. [DOI] [PubMed] [Google Scholar]
- 41.Dymicka-Piekarska V, Matowicka-Karna J, Gryko M, Kemona-Chetnik I, Kemona H. Relationship between soluble P-selectin and inflammatory factors (interleukin-6 and C-reactive protein) in colorectal cancer. Thromb Res. 2007;120:585–590. doi: 10.1016/j.thromres.2006.11.002. [DOI] [PubMed] [Google Scholar]