

Abstract
Claudins define paracellular permeability to small molecules by forming ion-selective pores within the tight junction. We recently demonstrated that claudin-2 channels are gated and open and close on a submillisecond timescale. To determine if and how the ensemble behavior of this unique class of entirely extracellular gated ion channels could define global epithelial barrier function, we have developed an in silico model of local claudin-2 behavior. This model considers the complex anastomosing ultrastructure of tight junction strands and can be scaled to show that local behavior defines global epithelial barrier function of epithelial monolayers expressing different levels of claudin-2. This is the first mathematical model to describe global epithelial barrier function in terms of the dynamic behavior of single tight junction channels and establishes a framework to consider gating kinetics as a means to regulate barrier function.
Keywords: claudins, claudin-2, permeability, tight junctions, tight junction proteins, ion channels
Introduction
Throughout the body, specialized epithelia form barriers between tissue compartments and help establish energy-dependent absorptive and secretory processes. Conductance across transmembrane ion channels and transporters, which span cell membranes, can either be an energy-consuming process that opposes established electrochemical gradients or can be driven by transmembrane electrochemical gradients. Equally essential to life are tight junctions, which limit flux of molecules and water through the paracellular space between cells.1–3 Without the sealing function of tight junctions, transepithelial gradients established by active transcellular transport would be rapidly dissipated via passive diffusion. Tight junctions are, however, not absolute seals, and they allow paracellular flux in a selective and regulatable manner.4 This paracellular transport is always driven by electrochemical gradients, as tight junctions are incapable of active transport. Nevertheless, recent work has made it clear that trans–tight junction Na+ flux into the gut lumen is an essential means by which the Na+ required for function of many transmembrane transporters is recycled.5,6
Tight junctions can be regulated rapidly in response to physiological and pathophysiological stimuli.1,2,4,7–12 Our prevailing understanding of tight junction function is that there are at least two distinct pathways of tight junction conductance: pore and leak.1,2,13 The pore pathway is a highly conductive pathway that is regulated by members of the claudin family. In contrast, the overall density of the leak pathway is much lower than the pore pathway, is charge non-selective, and permits passage of much larger macromolecules. Recent work suggests that the structures defining these pore and leak pathways are highly dynamic in terms of intermolecular interactions and function and that there may be a direct relationship between stability of tight junction protein interactions and permeability of pore and leak pathways.7,14–17 These data are consistent with ultrastructural predictions that suggested that the relationship between conductance and ultrastructure could only be established by a dynamic tight junction barrier.18 However, until recently, such models lacked functional data support.
Our development of the trans–tight junction patch clamp technique has provided novel biophysical insight into the dynamic behavior of tight junction channels (i.e., the pore pathway).19 The data show that claudin-2 forms gated ion channels that open and close rapidly on a submillisecond timescale, not unlike many transmembrane ion channels. To better understand how the ensemble behavior of these channels defines global barrier function, here we show an in silico model to describe claudin-2 pore function based on (1) claudin-2 single-channel opening characteristics, (2) tight junction strand ultrastructure, and (3) the two-dimensional arrangement of tight junctions within an epithelium. Our model recapitulates local patch clamp data as well as global conductances measured over large epithelial surfaces. This model will provide a useful tool for testing hypotheses about tight junction barrier regulation and its interplay with transcellular ion transport.
Materials and methods
Tight junction patch clamp technique
Our tight junction patch clamp technique was described in detail, along with extensive characterization of claudin-2 single-channel properties.19 Briefly, tet-off claudin-2–expressing Madin-Darby canine kidney (MDCK) I cells20 were grown on custom-made clear semipermeable membrane supports to confluence. Monolayers were perfused apically and basolaterally while being visualized from below using an inverted microscope. Borosilicate glass (∼2 MΩ) microelectrodes were placed at the tight junction, and gigaseals were achieved using slight negative intrapipette pressure. Claudin-2 channel open probability (NPo) was assessed in steady-state voltage clamp recordings in the presence of large electrical gradients (i.e., –100 mV or +100 mV) using Axon Clampfit software (Molecular Devices).
In silico model of claudin-2 function
In order to model claudin-2 function, we generated a multistrand model of the tight junction barrier. Analogous to the ultrastructure of MDCK I monolayers visualized by freeze–fracture electron microscopy,18,21,22 we modeled the barrier as an array of three anastomosing resistive strands (Fig. 1A). In the patch clamp recording system, conductance through the local tight junction is isolated electrically by the gigaohm seal. Relative to this seal resistance, the resistance of the monolayer outside of the patch is essentially zero––the conductance is infinite––resulting in a common apical/basolateral ground outside of the patch. The equivalent resistance of the array (Fig. 1B, RTJ; Eq. 1 (see also Box 1)) was solved using nodal analysis.
Figure 1.
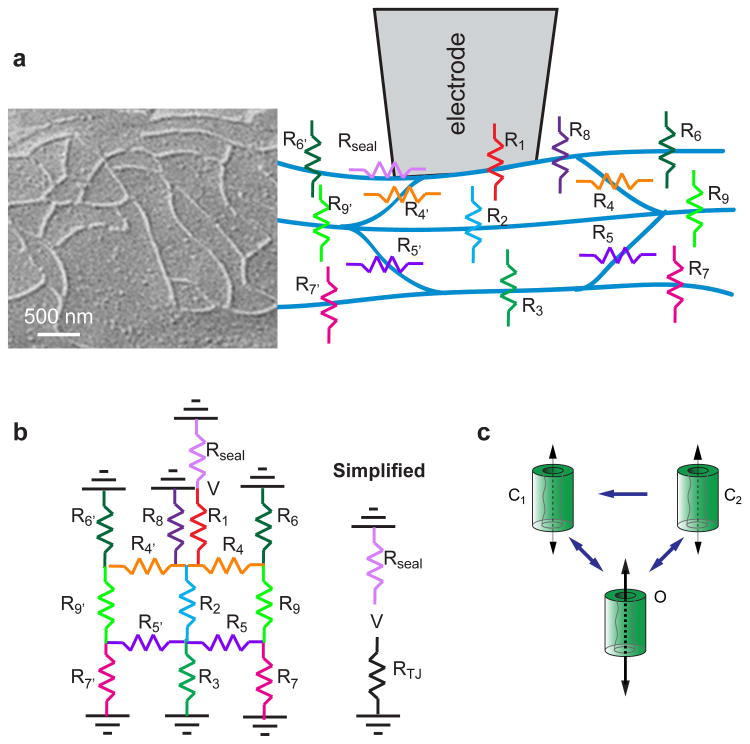
The tight junction can be modeled as a complex resistor array. (A) A simplified model of a three-strand tight junction barrier considered the strands in the vicinity of the recording electrode. A representative image of tight junction strands, as visualized by freeze–fracture electron microscopy, is shown. (B) Each resistor within the array represented multiple parallel claudin-2 channels, and the overall array was simplified to two parallel resistors, RTJ and Rseal. (C) On the basis of analyses of tight junction patch clamp, each claudin-2 pore was defined by stable and unstable closed states (C1 and C2) and a single open state (O).
Box 1. Equivalence resistance of the array as solved using nodal analysis.
RTJ = (J1 + J2 + J3 + J4 + J5 + J6 + J7 + J8 + J9 + J10 + J11)/(K1 + K2 + K3 + K4 + K5 + K6 + K7 + K8 + K9 + K10 + K11)
J1 = 1 + R1/R4′ − R1 × R6′/R4′/(R4′ + R6′ ) + (R6′/(R4′ + R6′ )) × (R1 × F/B) − (R6′/(R4′ + R6′ )) × (R1/(1 + R5′/R7′ )/B)
J2 = I × R1/(G × R3) + I × R1/(G × C) + I × R1/(G × D) + I × R5 × R1 × E/(G × A × C) −I × R5 × R1/(1 + R5/R7)/(G × A × C)
J3 = −I × R1 × E/(G × A) + I × R1/(1 + R5/R7)/(G × A) + I × R5′ × R1 × F/(G × B × D) − I × R5′ × R1/(1 + R5′/R7′ )/(G × B × D)
J4 = −I × R1 × F/(G × B) + I × R1/(1 + R5′/R7′ )/(G × B)
J5 = R1/R4−R1 × R6/R4/(R4 + R6) + (R6/(R4 + R6)) × (R1 × E/A) − (R6/(R4 + R6)) × (R1/(1 + R5/R7)/A)
J6 = H × R1/(G × R3) + H × R1/(G × C) + H × R1/(G × D) + H × R5 × R1 × E/(G × A × C) − H × R5 × R1/(1 + R5/R7)/(G × A × C)
J7 = −H × R1 × E/(G × A) + H × R1/(1 + R5/R7)/(G × A) + H × R5′ × R1 × F/(G × B × D) − H × R5′ × R1/(1 + R5′/R7′ )/(G × B × D)
J8 = −H × R1 × F/(G × B) + H × R1/(1 + R5′/R7′ )/(G × B) + R1/R8
J9 = R1/(G × R3) + R1/(G × C) + R1/(G × D) + R5 × R1 × E/(G × A × C) − R5 × R1/(1 + R5/R7)/(G × A × C)
J10 = −R1 × E/(G × A) + R1/(1 + R5/R7)/(G × A) + R5′ × R1 × F/(G × B × D) − R5′ × R1/(1 + R5′/R7′ )/(G × B × D) − R1 × F/(G × B)
J11 = R1/(1 + R5′/R7′ )/(G × B)
K1 = 1/R4′ − R6′/R4′/(R4′ + R6′ ) + (R6′/(R4′ + R6′ )) × (F/B) − (R6′/(R4′ + R6′ )) × (1/(1 + R5′/R7′ )/B)
K2 = I/(G × R3) + I/(G × C) + I/(G × D)
K3 = I × R5 × E/(G × A × C) − I × R5/(1 + R5/R7)/(G × A × C) − I × E/(G × A) + I/(1 + R5/R7)/(G × A)
K4 = I × R5′ × F/(G × B × D) − I × R5′/(1 + R5′/R7′ )/(G × B × D) − I × F/(G × B) + I/(1 + R5′/R7′ )/(G × B)
K5 = 1/R4 − R6/R4/(R4 + R6) + (R6/(R4 + R6)) × (1 × E/A) − (R6/(R4 + R6)) × (1/(1 + R5/R7)/A)
K6 = H/(G × R3) + H/(G × C) + H/(G × D)
K7 = H × R5 × E/(G × A × C) − H × R5/(1 + R5/R7)/(G × A × C) − H × E/(G × A) + H/(1 + R5/R7)/(G × A)
K8 = H × R5′ × F/(G × B × D) − H × R5′/(1 + R5′/R7′ )/(G × B × D) − H × F/(G × B) + H/(1 + R5′/R7′ )/(G × B)
K9 = 1/R8
K10 = 1/(G × R3) + 1/(G × C) + 1/(G × D) + R5 × E/(G × A × C) − R5/(1 + R5/R7)/(G × A × C) − E/(G × A)
K11 = 1/(1 + R5/R7)/(G × A) + R5′ × F/(G × B × D) − R5′/(1 + R5′/R7′ )/(G × B × D) − F/(G × B) + 1/(1 + R5′/R7′ )/(G × B)
A = (R9 + R5/(1 + R5/R7) + R6/(1 + R6/R4))
B = (R9′ + R5′/(1 + R5′/R7′ ) + R6′/(1 + R6′/R4′ )
C = (R7 + R5)
D = (R7′ + R5′ )
E = (R6/R4/(1 + R6/R4))
F = (R6′/R4′/(1 + R6′/R4′))
G = (1 + R2/R3 + R2/C + R2/D − R5 × R2/(1 + R5/R7)/(A × C) + R2/(1 + R5/R7)/A − R5′ × R2/(1 + R5′/R7′ )/(B × D) + R2/(1 + R5′/R7′)/B)
H = ((R6/(R4 + R6)) × (R2/(1 + R5/R7)/A))
I = ((R6′/(R4′ + R6′ )) × (R2/(1 + R5′/R7′)/B))
| (1) |
Each resistor within the array was further modeled as containing a constant baseline resistance, as well as a variable number of claudin-2 channels in parallel that could vary between a single open and two closed states (Fig. 1C), with defined open and closed resistances of 4.5 GΩ (222 pS) and 100 GΩ, (10 pS) respectively, for R1, R2, R3, R4, R4′ R5, R5′ , R6, R6′ , R7, R7′ , R8, R9, and R9′ . For simulations of monolayers expressing claudin-2, the number of claudin-2 channels per μm strand was 36, similar to a previous estimate of 40 pores/μm, and based on the 18 nm distance between the centers of adjacent particles measured in freeze–fracture electron micrographs.20,23. The single-channel conductance of 222 pS (4.5 GΩ) was calculated on the basis of measured 90 pS trans–junction channel amplitudes assuming the presence of three tight junction strands. The closed resistance conductance of 10 pS (100 GΩ) is included to explain the increases in steady-state (i.e., baseline conductance measured at –100 mV in monolayers expressing high levels of claudin-2, relative to those with low levels of claudin-2 expression. These baseline resistances were determined from actual patch clamp measurements over time intervals in which no channel opening events were detected. This model of open channel resistance results in increased RTJ when claudin-2 expression is reduced. For example, a 6-fold decrease in claudin-2 expression increases baseline RTJ from 4861 MΩ (0.206 pS) to 10470 MΩ (0.096 pS) according to Equation 2. This difference results in a 12 pA increase in in silico conductance at –100 mV, which is similar to the 15 pA difference measured in patch clamp recordings (Table 2).
Table 2.
Comparison of simulated and actual data.19
| Simulated | Actual | |||
|---|---|---|---|---|
|
| ||||
| Claudin-2 expression | High | Low | High | Lw |
| Steady-state current at –100 mV | –20.6 | –9.6 | –22.6 ± 2.2 | –7.3 ± 1.5 |
| NPo | 0.021 | 0.0045 | 0.0237 ± 0.0098 | 0.0038 ± 0.0011 |
| Average event size (pA) | –9.6 | –8 | –7.2 ± 1.0 | –9.2 ± 0.6 |
| TER (Ωcm2) no leak | 253 | 550 | unknown | unknown |
| TER (Ωcm2) with leak | 180 | 506 | 105 ± 11 | 595 ± 89 |
Transition between the three states (Fig. 1C) occurred whenever a random number (between 0 and 1) was less than the state transition probabilities (Table 1). State transition probabilities were chosen to reflect in vitro dwell times for each of the three states. Transition probabilities between open (O) and unstable closed (C2) states, O→C2 and C2→O, respectively, were equivalent (Fig. 1C). These values yielded accurate dwell times in each of these states and a 50% duty cycle for a given burst of openings. The combined probability of open to stable closed (C1) and unstable close to stable closed states, O→C1 and C2→C1, respectively, were calculated to allow in silico burst durations to match those that were measured by patch clamp. That is, entering the C1 state ends the burst of opening activity, whether it occurs from an open state or unstable closed state (O→C1 and C2→C1, respectively). Finally, C1→O was chosen to match overall NPo, as determined from patch clamp data. Note that we did not include C1→C2 in this model, because it cannot be defined experimentally. It is, however, conceivable that this transition occurs in molecular terms. The model could accommodate inclusion of this state transition by incorporating a compensatory decrease in C1→O such that modeled NPo values continued to match those determined by patch clamp.
Table 1.
Simulation parameters used to model local patch clamp recordings for MDCK I cells.
| Claudin-2 | Low claudin-2 | |
|---|---|---|
|
| ||
| State transition probabilities | ||
| C1→O | 0.00007 ms–1 | 0.00007 ms–1 |
| O→C2 | 1 ms–1 | 1 ms–1 |
| C1→ C1 | 0.03 ms–1 | 0.03 ms–1 |
| C2→C1 | 0.03 ms–1 | 0.03 ms–1 |
| C2→O | 1 ms–1 | 1 ms–1 |
| Pores per strand μm (n) | 36 | 6 |
| μm TJ/μm2 epithelium | 0.129 | 0.129 |
| Single-pore open resistance (conductance) | 4.5 GΩ (222 pS) | 4.5 GΩ (222 pS) |
| Single-pore closed resistance(conductance) | 100 GΩ (10 pS) | 100 GΩ (10 pS) |
| Vm | –100 mV | –100 mV |
| Baseline strand resistance (conductance) | 5 GΩμm (200 pS/μm) | 5 GΩμm (200 pS/μm) |
| Global leak resistance (conductance) | 629 Ωcm2 (1.59 mS/cm2) | 6290 Ωcm2 (0.159 mS/cm2) |
| Rseal = pipette seal resistance (conductance) | 25 GΩ (40 pS) | 25 GΩ (40 pS) |
| Variance of background noise | 0.6 pA | 0.6 pA |
Current at each time point was determined by Ohm's law from the equivalent resistance of the entire resistive array and defined holding potential (Vapical − Vbasolateral) of −100 mV. In order to better model the data, constant pipette seal leakage (Rseal; Eq. 2) and randomly generated Gaussian noise were included in the simulations.
| (2) |
Resulting current simulations were analyzed in the same manner as patch clamp data using Clampfit. Opening and closing duration histograms were generated and fit using the maximum likelihood method to single and double exponentials using TACFit X4.3.3 (Bruxton Corporation) and compared to previously published values.20
The apical ground was removed, and R6, R6′, and R8 were made nonconductive in order to scale simulations to larger areas through an iterative process in which new open and closed states were determined for R1, R4, R5, R6, R7, and R9 according to state transition probabilities for each 0.5-μm step along the tight junction. For each step, previous values of R2, R3, R4, R5, R7, and R9 were assigned to R9′, R7′, R4′, R5′, R3, and R2, respectively, in Equation 1. An additional parallel leak correction was required when scaling local bicellular simulations to more closely match global transepithelial resistance measurements. These leak values were chosen to reflect the ∼10-fold increase in global large molecule (e.g., tetraethylamine or N-methyl-d-glucamine) permeability induced by increased claudin-2 expression.19 For these calculations, linear tight junction length per unit of epithelial surface area was determined using representative monolayers that were fixed immediately after confluence, when measurements were performed, and immunostained for ZO-1 to define tight junctions (Fig. 2). Linear tight junction length (μm) per unit epithelial area (μm2) was calculated from representative images (Fig. 2) using the Metamorph 7.5 (Molecular Devices) line measurement tool. From total tight junction current, resistance was calculated according to Ohm's law.
Figure 2.
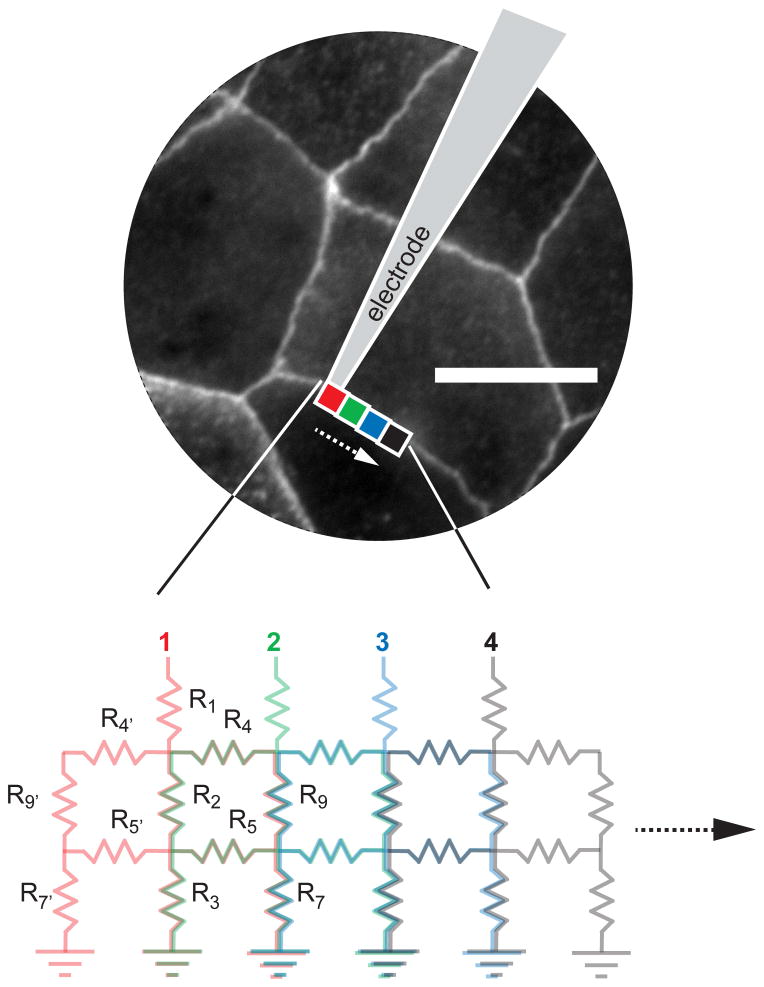
Simulations were scaled up to larger areas by an iterative process. This allowed modeling of barrier properties over large areas. Scale bar, 10 μm.
Results
In high-resistance MDCK I monolayers,24,25 expression of claudin-2 induces a large increase in tight junction conductance, which is predominantly due to increased Na+ permeability.20,25,26 Non-induced monolayers have transepithelial resistance (TER) of 595 ± 89 Ωcm2 and very low claudin-2 expression. Removal of doxycycline results in an ∼ 25-fold increase in claudin-2 protein and a decrease in TER to 105 ± 11Ωcm2 (Table 2).19 We previously defined the molecular basis of claudin-2 conductance in MDCK I monolayers using the tight junction patch clamp technique.19
A representative recording using this technique (Fig. 3A) shows openings of claudin-2–dependent ion channels (Fig. 3B). The open probability (NPo) of these channels decreased by 87 ± 4%, without any change in opening conductance, in the absence of claudin-2 induction (Fig. 3C, Table 2).19 A detailed kinetic analysis of the opening and closing durations showed that claudin-2 channels exist in at least three states.19 We also demonstrated that claudin-2 openings are not observed when electrodes are sealed away from tight junctions, and the claudin-2 openings recapitulate globally measured epithelial charge and size selectivity properties for claudin-2.19 Openings were blocked using basolateral lanthanum or through cysteine derivatization of single amino acids within the claudin-2 pore.19 Thus, our recordings strongly supported the view that tight junctions are populated by claudin-dependent gated ion channels. Our findings further suggest that claudin-2 gating is a potential means by which barrier function may be regulated.
Figure 3.
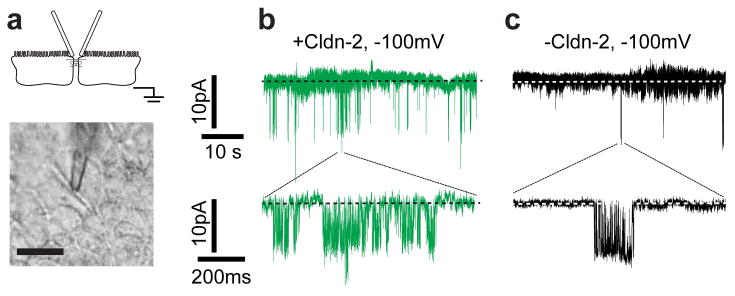
. The tight junction patch clamp technique allowed recording of claudin-2 ion channel opening events. (A) Apical recording electrodes were sealed over bicellular tight junctions (scale bar, 10 μm). (B) Representative recordings at −100 mV with inducible claudin-2 expression. (C) Channel activity, but not opening size, was diminished in the absence of inducible claudin-2 expression.
The above findings support the presence of an entirely extracellular claudin-2 ion channel at the tight junction, which is theoretically unbounded by the lipid bilayer. This is a biophysically distinct class of gated ion channels, never previously described, yet it is not entirely clear how such dynamic openings could define global measures of epithelial barrier function. We therefore turned to computational modeling to show how these claudin-2 dynamic channel openings account for locally and globally measured claudin-2–dependent tight junction conductance.
A mathematical model of trans–tight junction conductance
The prevailing theory about claudin function is that the barrier established by head-to-head interactions between the extracellular loops of claudins span lipid bilayers of adjacent cells. Tight junction ultrastructure, as assessed by freeze–fracture EM, shows that tight junctions are composed of multiple claudin-containing strands that anastomose and encircle the apical epithelial cells.22,27,28 The number of strands varies among epithelia and, in general, correlates inversely with paracellular conductance.18 This suggests that strands may function as resistors arranged in series and in parallel.18 We therefore developed a corresponding model with low-conductance strands populated by channels (Fig. 1A). Each channel was modeled as a resistor with low and high resistances for the open and closed states, respectively. One open and two distinct closed states were defined by the state transition probabilities (Table 1). The simulated data accurately resembled patch clamp recordings (Fig. 4 versus Fig. 3) from high and low claudin-2 expressing MDCK I monolayers by changing only two parameters: the number of claudin-2 channels per micron and a steady-state claudin-2–dependent baseline leak (Table 1). A detailed kinetic analysis of simulated opening conductances (Table 2) and gating kinetics (Fig. 5) were similar to our published in vitro data.
Figure 4.
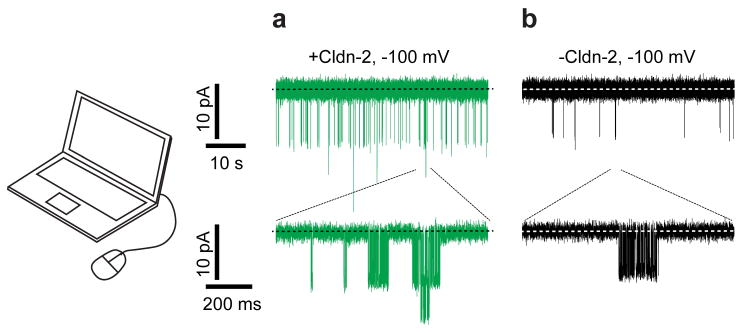
Modeling of the tight junction barrier recapitulates tight junction patch clamp recordings. (A) Simulations resembled actual tight junction patch clamp recordings from MDCK I cells expressing claudin-2. (B) Reducing pore number by 83% without changing other parameters recapitulated tight junction patch clamp recordings from MDCK I cells without inducible claudin-2 expression.
Figure 5.
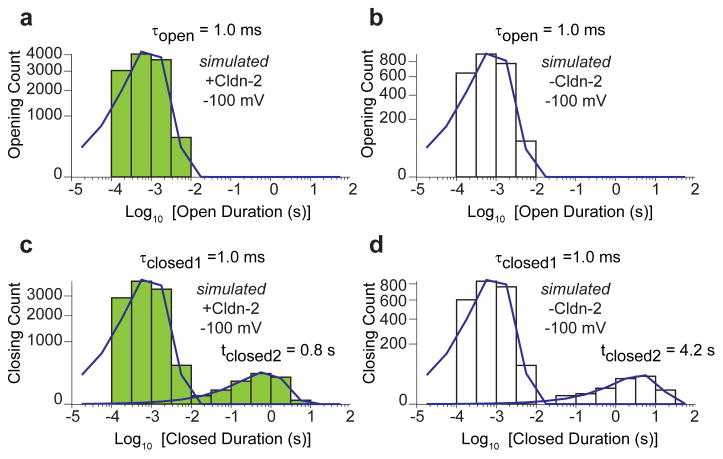
In silico modeling of a single open state and two closed states. Histograms were generated from identical simulation times: 1049 s. (A) τopen ∼ 1 ms in the presence of inducible claudin-2. (B) τopen ∼ 1 ms in the absence of inducible claudin-2. (C) τclosed1 = 1 ms and τclosed2 = 0.8 s in the presence of inducible claudin-2. (D) τclosed1 = 1 ms and τclosed2 = 4.2 s in the absence of inducible claudin-2.
Modeling of large epithelial surfaces
To further test the model, we asked whether the local submicron tight junction model could be scaled to recapitulate global conductance measurements. Iterative expansion based on measured tight junction length per unit epithelial surface area (Fig. 2) resulted in stable and uniform conductances that lacked the distinct individual events seen when smaller areas were modeled. The global conductances predicted were, however, lower than those measured by traditional methods. This difference could be explained by conductances not detected by tight junction patch clamp, such as those that are not gated or are highly conductive but infrequent enough to be missed in local patch clamp recordings. These characteristics describe the occludin- and ZO-1–dependent, low-capacity leak pathway that is activated by TNF via a myosin light chain kinase –dependent7,29-36 process. Alternatively, these conductances could be due to the high flux thought to occur across tricellular tight junctions,36 which we carefully avoided in these patch clamp studies.19 Regardless of their biological identity, inclusion of a correction factor to allow for these other conductive pathways was sufficient to allow the model to accurately recapitulate global conductance measurements (Tables 1 and 2).As a final test, we asked if simply reducing the number of trans–tight junction channels could accurately simulate both tight junction patch clamp recordings and global transepithelial conductance measurements before induction of claudin-2 expression. Both local patch clamp and global measurements were faithfully recapitulated by the same 6-fold reduction in channel number (Tables 1 and 2). Kinetic analyses (Fig. 5) of channel dwell-time distributions recapitulated previously published kinetic analyses of both low- and high-expressing claudin-2 monolayers.19
Discussion
Tight junctions define epithelial barrier function by regulating paracellular permeability. Despite a conventional view that tight junctions are relatively static structures with low permeability, recent data supports the view that tight junctions are highly dynamic, and changes in tight junction barrier function frequently correlate with altered tight junction protein dynamics.7,14 Our assessment of claudin-2 function using the tight junction patch clamp technique demonstrated that claudin-2 forms gated ion channels at the tight junction.19 However, it was not clear how these gated channels within the paracellular space could work in concert to define epithelial barrier function. Thus, we developed a basic model of claudin-2 function that accurately describes global epithelial barrier function in terms of local claudin channel opening and closing events. The model is unique compared with models of transmembrane conductance, because claudin-2 channels do not span a lipid bilayer, and channels are arranged in both series and parallel. Our model provides unique insight into several aspects of claudin-2 structure and function.
Claudin-2 channel stoichiometry
According to our model, a 6-fold increase in claudin-2 channels accounts for our observed local and global recordings in barrier function. However, this conductance was associated with a 25-fold increase in claudin-2 protein in our cells, as determined by western blot. This could be explained by the structural complexity of both claudin-2 complexes37 and claudin-15 polymers.38 If we neglect minimal non-tight junction claudin-2, our modeling suggests cooperativity of ∼ four claudins per channel. This stoichiometry agrees well with claudin-15 ultrastructural models, which suggests that four claudin stands (two in each lipid bilayer) are required to form a single row of claudin pores.39
Implications of strand ultrastructure
In our recordings, a probable effect of tight junction branching is that it localizes the effect of a single tight junction opening to a short submicron segment under the patch electrode. Without the branching, a situation would exist whereby any break in a strand outside of the patch would be perceived as a large step increase in leak. It would be difficult to differentiate such leaks from changes in Rseal. Therefore, we speculate that a non-branched network, such as the parallel strands lacking anastomoses formed by claudin-19,40 would be far more difficult to study via the patch clamp technique. This is not simply a theoretical consideration, given the increased recognition that strand interactions are dynamic and can be regulated by interprotein interactions.15,27,41
Another important implication of tight junction branching is that it affects perceived channel opening conductances. In our local recordings, we often observe some variability in the size of individual openings and occasionally observe multiple superimposed openings of different size (i.e., Fig. 3B). In our patch clamp recordings,19 secondary openings were on average 87 ± 3% of the conductance of the initial event (P ≤ 0.01). This finding would not be expected for simple parallel ion channels in a lipid bilayer with same-size openings. One possible explanation is that there is some heterogeneity in claudin-2 conductance or a presence of sub-conductance states. However, our modeling did not consider this possibility, and the branched tight junction model still accurately predicted opening size variation as well as the finding that secondary openings were often smaller than the primary openings (Fig. 4A). Thus, even though all claudin-2 channels had the same conductance in our model, tight junction branched architecture affects perceived channel opening conductances in a manner distinct from a simple parallel channel model (where conductances are additive) and is also different from a pure series network (where resistances are additive).
Claudin-2 channel gating
The crystal structure data for claudin-15 provides a potential model to explain the rapid transitions between closed and open states. A ball-and-chain mechanism, with one of the extracellular β-strand domains functioning as a gating regulator, is one possibility, and it is consistent with our recordings of claudin-2I66C conductances before and after thiol derivatization.19 Additional patch clamp analyses coupled with improved modeling at the molecular level are expected to provide insight into the exact mechanisms of gating in the near future.
Conclusion
In summary, we developed an in silico model to describe claudin-2 pore function based on patch clamp recordings of claudin-2 openings and tight junction strand ultrastructure. Our model is scalable to large areas of epithelium and accounts for changes in global epithelial barrier function. We expect that improved understanding of the molecular details of claudin-2 gating, coupled with in vitro mutagenesis studies will provide further insight into the mechanisms of claudin gating and other aspects of claudin pore selectivity that are not presently part of the basic conductive model shown here. As the tight junction field advances, we plan to expand the model to include other tight junction conductive pathways, including details of the tight junction leak pathway. We also expect to be able to model the complex interplay between tight junction flux and transcellular secretion and absorption, which is essential to normal epithelial function.
Acknowledgments
The authors acknowledge support from the National Institutes of Health (K08DK088953, F32DK082134 to C.R.W.; R01DK61631 and R01DK68271 to J.R.T.), the American Physiological Society 2012 S&R Foundation Ryuji Ueno Award (C.R.W.), and the Crohn's and Colitis Foundation of America (J.R.T.).
Footnotes
Competing interests: The authors declare no competing interests.
References
- 1.Anderson JM, Van Itallie CM. Physiology and function of the tight junction. Cold Spring Harb Perspect Biol. 2009;1:a002584. doi: 10.1101/cshperspect.a002584. [DOI] [PMC free article] [PubMed] [Google Scholar]
- 2.Turner JR. Intestinal mucosal barrier function in health and disease. Nat Rev Immunol. 2009;9:799–809. doi: 10.1038/nri2653. [DOI] [PubMed] [Google Scholar]
- 3.Tamura A, Hayashi H, Imasato M, Yamazaki Y, Hagiwara A, Wada M, Noda T, Watanabe M, Suzuki Y, Tsukita S. Loss of claudin-15, but not claudin-2, causes Na+ deficiency and glucose malabsorption in mouse small intestine. Gastroenterol. 2011;140:913–923. doi: 10.1053/j.gastro.2010.08.006. [DOI] [PubMed] [Google Scholar]
- 4.France MM, Turner JR. The mucosal barrier at a glance. J Cell Sci. 2017;130:307–314. doi: 10.1242/jcs.193482. [DOI] [PMC free article] [PubMed] [Google Scholar]
- 5.Wada M, Tamura A, Takahashi N, Tsukita S. Loss of claudins 2 and 15 from mice causes defects in paracellular na+ flow and nutrient transport in gut and leads to death from malnutrition. Gastroenterol. 2013;144:369–380. doi: 10.1053/j.gastro.2012.10.035. [DOI] [PubMed] [Google Scholar]
- 6.Turner JR, Buschmann MM, Romero-Calvo I, Sailer A, Shen L. The role of molecular remodeling in differential regulation of tight junction permeability. Semin Cell Dev Biol. 2014;36:204–212. doi: 10.1016/j.semcdb.2014.09.022. [DOI] [PMC free article] [PubMed] [Google Scholar]
- 7.Buschmann MM, Shen L, Rajapakse H, Raleigh DR, Wang Y, Wang Y, Lingaraju A, Zha J, Abbott E, McAuley EM, Breskin LA, Wu L, Anderson K, Turner JR, Weber CR. Occludin ocel-domain interactions are required for maintenance and regulation of the tight junction barrier to macromolecular flux. Mol Biol Cell. 2013;24:3056–3068. doi: 10.1091/mbc.E12-09-0688. [DOI] [PMC free article] [PubMed] [Google Scholar]
- 8.Weber CR, Raleigh DR, Su L, Shen L, Sullivan EA, Wang Y, Turner JR. Epithelial myosin light chain kinase activation induces mucosal interleukin-13 expression to alter tight junction ion selectivity. J Biol Chem. 2010;285:12037–12046. doi: 10.1074/jbc.M109.064808. [DOI] [PMC free article] [PubMed] [Google Scholar]
- 9.Marchiando AM, Shen L, Graham WV, Edelblum KL, Duckworth CA, Guan Y, Montrose MH, Turner JR, Watson AJ. The epithelial barrier is maintained by in vivo tight junction expansion during pathologic intestinal epithelial shedding. Gastroenterol. 2011;140:1208–1218. e1201–1202. doi: 10.1053/j.gastro.2011.01.004. [DOI] [PMC free article] [PubMed] [Google Scholar]
- 10.Marchiando AM, Shen L, Graham WV, Weber CR, Schwarz BT, Austin JR, 2nd, Raleigh DR, Guan Y, Watson AJ, Montrose MH, Turner JR. Caveolin-1-dependent occludin endocytosis is required for tnf-induced tight junction regulation in vivo. J Cell Biol. 2010;189:111–126. doi: 10.1083/jcb.200902153. [DOI] [PMC free article] [PubMed] [Google Scholar]
- 11.Schumann M, Siegmund B, Schulzke JD, Fromm M. Celiac disease: Role of the epithelial barrier. Cell Molec Gastroenterol Hepatol. 2017;3:150–162. doi: 10.1016/j.jcmgh.2016.12.006. [DOI] [PMC free article] [PubMed] [Google Scholar]
- 12.Cereijido M, Contreras RG, Gonzalez-Mariscal L. Development and alteration of polarity. Annu Rev Physiol. 1989;51:785–795. doi: 10.1146/annurev.ph.51.030189.004033. [DOI] [PubMed] [Google Scholar]
- 13.Shen L, Weber CR, Raleigh DR, Yu D, Turner JR. Tight junction pore and leak pathways: A dynamic duo. Annu Rev Physiol. 2011;73:283–309. doi: 10.1146/annurev-physiol-012110-142150. [DOI] [PMC free article] [PubMed] [Google Scholar]
- 14.Raleigh DR, Boe DM, Yu D, Weber CR, Marchiando AM, Bradford EM, Wang Y, Wu L, Schneeberger EE, Shen L, Turner JR. Occludin s408 phosphorylation regulates tight junction protein interactions and barrier function. J Cell Biol. 2011;193:565–582. doi: 10.1083/jcb.201010065. [DOI] [PMC free article] [PubMed] [Google Scholar]
- 15.Van Itallie CM, Tietgens AJ, Anderson JM. Visualizing the dynamic coupling of claudin strands to the actin cytoskeleton through ZO-1. Mol Biol Cell. 2016;28:524–534. doi: 10.1091/mbc.E16-10-0698. [DOI] [PMC free article] [PubMed] [Google Scholar]
- 16.Shen L, Weber CR, Turner JR. The tight junction protein complex undergoes rapid and continuous molecular remodeling at steady state. J Cell Biol. 2008;181:683–695. doi: 10.1083/jcb.200711165. [DOI] [PMC free article] [PubMed] [Google Scholar]
- 17.Yu D, Marchiando AM, Weber CR, Raleigh DR, Wang Y, Shen L, Turner JR. Mlck-dependent exchange and actin binding region-dependent anchoring of zo-1 regulate tight junction barrier function. Proc Natl Acad Sci USA. 2010;107:8237–8241. doi: 10.1073/pnas.0908869107. [DOI] [PMC free article] [PubMed] [Google Scholar]
- 18.Claude P. Morphological factors influencing transepithelial permeability: A model for the resistance of the zonula occludens. J Membr Biol. 1978;39:219–232. doi: 10.1007/BF01870332. [DOI] [PubMed] [Google Scholar]
- 19.Weber CR, Liang GH, Wang Y, Das S, Shen L, Yu AS, Nelson DJ, Turner JR. Claudin-2-dependent paracellular channels are dynamically gated. eLife. 2015;4:e09906. doi: 10.7554/eLife.09906. [DOI] [PMC free article] [PubMed] [Google Scholar]
- 20.Yu AS, Cheng MH, Angelow S, Gunzel D, Kanzawa SA, Schneeberger EE, Fromm M, Coalson RD. Molecular basis for cation selectivity in claudin-2-based paracellular pores: Identification of an electrostatic interaction site. J Gen Physiol. 2009;133:111–127. doi: 10.1085/jgp.200810154. [DOI] [PMC free article] [PubMed] [Google Scholar]
- 21.Stevenson BR, Anderson JM, Goodenough DA, Mooseker MS. Tight junction structure and zo-1 content are identical in two strains of madin-darby canine kidney cells which differ in transepithelial resistance. J Cell Biol. 1988;107:2401–2408. doi: 10.1083/jcb.107.6.2401. [DOI] [PMC free article] [PubMed] [Google Scholar]
- 22.Claude P, Goodenough DA. Fracture faces of zonulae occludentes from “tight” and “leaky” epithelia. J Cell Biol. 1973;58:390–400. doi: 10.1083/jcb.58.2.390. [DOI] [PMC free article] [PubMed] [Google Scholar]
- 23.Anderson JM. Molecular structure of tight junctions and their role in epithelial transport. News Physiol Sci. 2001;16:126–130. doi: 10.1152/physiologyonline.2001.16.3.126. [DOI] [PubMed] [Google Scholar]
- 24.Furuse M, Furuse K, Sasaki H, Tsukita S. Conversion of zonulae occludentes from tight to leaky strand type by introducing claudin-2 into madin-darby canine kidney i cells. J Cell Biol. 2001;153:263–272. doi: 10.1083/jcb.153.2.263. [DOI] [PMC free article] [PubMed] [Google Scholar]
- 25.Amasheh S, Meiri N, Gitter AH, Schoneberg T, Mankertz J, Schulzke JD, Fromm M. Claudin-2 expression induces cation-selective channels in tight junctions of epithelial cells. J Cell Sci. 2002;115:4969–4976. doi: 10.1242/jcs.00165. [DOI] [PubMed] [Google Scholar]
- 26.Van Itallie CM, Holmes J, Bridges A, Gookin JL, Coccaro MR, Proctor W, Colegio OR, Anderson JM. The density of small tight junction pores varies among cell types and is increased by expression of claudin-2. J Cell Sci. 2008;121:298–305. doi: 10.1242/jcs.021485. [DOI] [PubMed] [Google Scholar]
- 27.Sasaki H, Matsui C, Furuse K, Mimori-Kiyosue Y, Furuse M, Tsukita S. Dynamic behavior of paired claudin strands within apposing plasma membranes. Proc Natl Acad Sci USA. 2003;100:3971–3976. doi: 10.1073/pnas.0630649100. [DOI] [PMC free article] [PubMed] [Google Scholar]
- 28.Marcial MA, Carlson SL, Madara JL. Partitioning of paracellular conductance along the ileal crypt-villus axis: A hypothesis based on structural analysis with detailed consideration of tight junction structure-function relationships. J Membr Biol. 1984;80:59–70. doi: 10.1007/BF01868690. [DOI] [PubMed] [Google Scholar]
- 29.Van Itallie CM, Fanning AS, Bridges A, Anderson JM. Zo-1 stabilizes the tight junction solute barrier through coupling to the perijunctional cytoskeleton. Mol Biol Cell. 2009;20:3930–3940. doi: 10.1091/mbc.E09-04-0320. [DOI] [PMC free article] [PubMed] [Google Scholar]
- 30.Van Itallie CM, Fanning AS, Holmes J, Anderson JM. Occludin is required for cytokine-induced regulation of tight junction barriers. J Cell Sci. 2010;123:2844–2852. doi: 10.1242/jcs.065581. [DOI] [PMC free article] [PubMed] [Google Scholar]
- 31.Krug SM, Amasheh S, Richter JF, Milatz S, Gunzel D, Westphal JK, Huber O, Schulzke JD, Fromm M. Tricellulin forms a barrier to macromolecules in tricellular tight junctions without affecting ion permeability. Mol Biol Cell. 2009;20:3713–3724. doi: 10.1091/mbc.E09-01-0080. [DOI] [PMC free article] [PubMed] [Google Scholar]
- 32.Zolotarevsky Y, Hecht G, Koutsouris A, Gonzalez DE, Quan C, Tom J, Mrsny RJ, Turner JR. A membrane-permeant peptide that inhibits mlc kinase restores barrier function in in vitro models of intestinal disease. Gastroenterol. 2002;123:163–172. doi: 10.1053/gast.2002.34235. [DOI] [PubMed] [Google Scholar]
- 33.Clayburgh DR, Barrett TA, Tang Y, Meddings JB, Van Eldik LJ, Watterson DM, Clarke LL, Mrsny RJ, Turner JR. Epithelial myosin light chain kinase-dependent barrier dysfunction mediates t cell activation-induced diarrhea in vivo. J Clin Invest. 2005;115:2702–2715. doi: 10.1172/JCI24970. [DOI] [PMC free article] [PubMed] [Google Scholar]
- 34.Wang F, Graham WV, Wang Y, Witkowski ED, Schwarz BT, Turner JR. Interferon-gamma and tumor necrosis factor-alpha synergize to induce intestinal epithelial barrier dysfunction by up-regulating myosin light chain kinase expression. Am J Pathol. 2005;166:409–419. doi: 10.1016/s0002-9440(10)62264-x. [DOI] [PMC free article] [PubMed] [Google Scholar]
- 35.Yu AS, McCarthy KM, Francis SA, McCormack JM, Lai J, Rogers RA, Lynch RD, Schneeberger EE. Knockdown of occludin expression leads to diverse phenotypic alterations in epithelial cells. Am J Physiol - Cell Physiol. 2005;288:C1231–1241. doi: 10.1152/ajpcell.00581.2004. [DOI] [PubMed] [Google Scholar]
- 36.Ikenouchi J, Furuse M, Furuse K, Sasaki H, Tsukita S, Tsukita S. Tricellulin constitutes a novel barrier at tricellular contacts of epithelial cells. J Cell Biol. 2005;171:939–945. doi: 10.1083/jcb.200510043. [DOI] [PMC free article] [PubMed] [Google Scholar]
- 37.Van Itallie CM, Mitic LL, Anderson JM. Claudin-2 forms homodimers and is a component of a high molecular weight protein complex. J Biol Chem. 2011;286:3442–3450. doi: 10.1074/jbc.M110.195578. [DOI] [PMC free article] [PubMed] [Google Scholar]
- 38.Suzuki H, Nishizawa T, Tani K, Yamazaki Y, Tamura A, Ishitani R, Dohmae N, Tsukita S, Nureki O, Fujiyoshi Y. Crystal structure of a claudin provides insight into the architecture of tight junctions. Science. 2014;344:304–307. doi: 10.1126/science.1248571. [DOI] [PubMed] [Google Scholar]
- 39.Suzuki H, Tani K, Tamura A, Tsukita S, Fujiyoshi Y. Model for the architecture of claudin-based paracellular ion channels through tight junctions. J Mol Biol. 2015;427:291–297. doi: 10.1016/j.jmb.2014.10.020. [DOI] [PubMed] [Google Scholar]
- 40.Yamazaki Y, Tokumasu R, Kimura H, Tsukita S. Role of claudin species-specific dynamics in reconstitution and remodeling of the zonula occludens. Mol Biol Cell. 2011;22:1495–1504. doi: 10.1091/mbc.E10-12-1003. [DOI] [PMC free article] [PubMed] [Google Scholar]
- 41.Cording J, Berg J, Kading N, Bellmann C, Tscheik C, Westphal JK, Milatz S, Gunzel D, Wolburg H, Piontek J, Huber O, Blasig IE. In tight junctions, claudins regulate the interactions between occludin, tricellulin and marveld3, which, inversely, modulate claudin oligomerization. J Cell Sci. 2013;126:554–564. doi: 10.1242/jcs.114306. [DOI] [PubMed] [Google Scholar]