

Abstract
The vertebrate-conserved RNA-binding protein (RBP) DND1 is required for survival of primordial germ cells (PGCs), as well as germ cell tumour (TGCT) suppression in mice1–5. Here we report that DND1 binds a UU[A/U] trinucleotide motif predominantly in messenger RNA (mRNA) 3′ untranslated regions (UTRs), and destabilizes target mRNAs through direct recruitment of the CCR4-NOT deadenylase (CCR4) complex. Transcriptomic analysis revealed that the extent of suppression is dependent on the number of DND1 binding sites. The DND1-dependent mRNA destabilization is required for survival of murine PGCs and spermatogonial stem cells (SSCs) by suppressing apoptosis. The target RNA spectrum includes positive regulators of apoptosis, inflammation, and modulators of signalling pathways regulating stem cell pluripotency including the TGF-β super family, all of which are aberrantly elevated in Dnd1-deficient PGCs. We propose that the induction of the posttranscriptional suppressor DND1 synergizes with concurrent transcriptional changes to sharpen developmental transitions during cellular differentiation and maintenance of the germline.
Vertebrate PGCs are specified from pluripotent epiblast cells and migrate into the developing gonads, where they differentiate into either male or female germ cells6. In mice, Dnd1 expression is specifically induced in PGC precursors at embryonic day (E) 6.5–6.75 and maintained until the pre-meiotic spermatogonia stage in adult testes7 (Extended Data Fig. 1a–c). Loss of Dnd1 gene function (Ter-mutation, Dnd1ter/ter) results in a substantial loss of PGCs at ~E8.5, male sterility, as well as a high incidence of TGCTs in 129Sv mice1–5. Dnd1 encodes a vertebrate-conserved RBP with a single RNA recognition motif (RRM) (Extended Data Fig. 1d–f). It has been proposed that DND1 counteracts miRNA-guided mRNA destabilisation based on the observation that DND1 blocked the recruitment of miRNA/AGO complexes to vicinal miRNA target sites in the 3′ UTR of the CDKN1B/P27KIP18. In contrast, another study identified DND1 as a cofactor of NANOS2-mediated gene repression9.
To investigate the molecular function of DND1 protein, we generated stable HEK293 cells expressing doxycycline (Dox)-inducible FLAG-HA-tagged DND1 (FH-DND1) (Extended Data Fig. 1g). These cells did not express endogenous DND1, and 24 h after Dox addition FH-DND1 protein accumulated to levels similar to endogenous DND1 in murine germline stem cells (GSCs), an in vitro counterpart of SSCs10 (~2.3×10⁶ vs. ~1.4×10⁶ molecules/cell, Extended Data Fig. 1g–m). Photoactivatable ribonucleoside-enhanced crosslinking and immunoprecipitation (PAR-CLIP)11 in these cells yielded a single ribonucleoprotein band at the expected ~45 kDa molecular mass (Fig. 1a). Recovered RNA from three PAR-CLIP experiments was deep-sequenced (Supplementary Table 1) and genome-aligned reads were grouped into clusters by PARalyzer12 to identify those enriched for crosslink-induced T-to-C conversions. We identified 60,310 clusters, referred to as binding sites, of which 78% were mapped to 8,837 distinct mRNAs (Supplementary Table 1, Extended Data Fig. 2a,b). Most crosslinked reads originated from exonic sequences, consistent with the predominantly cytosolic localization of DND1 (Fig. 1b, Extended Data Fig. 2c). Motif analysis yielded a 3-nt UU[U/A] RNA recognition element (RRE) present in 88.9% of the binding sites (Figs. 1c,d, Extended Data Fig. 2d).
Fig. 1. Human DND1 reduced target mRNA expression levels.
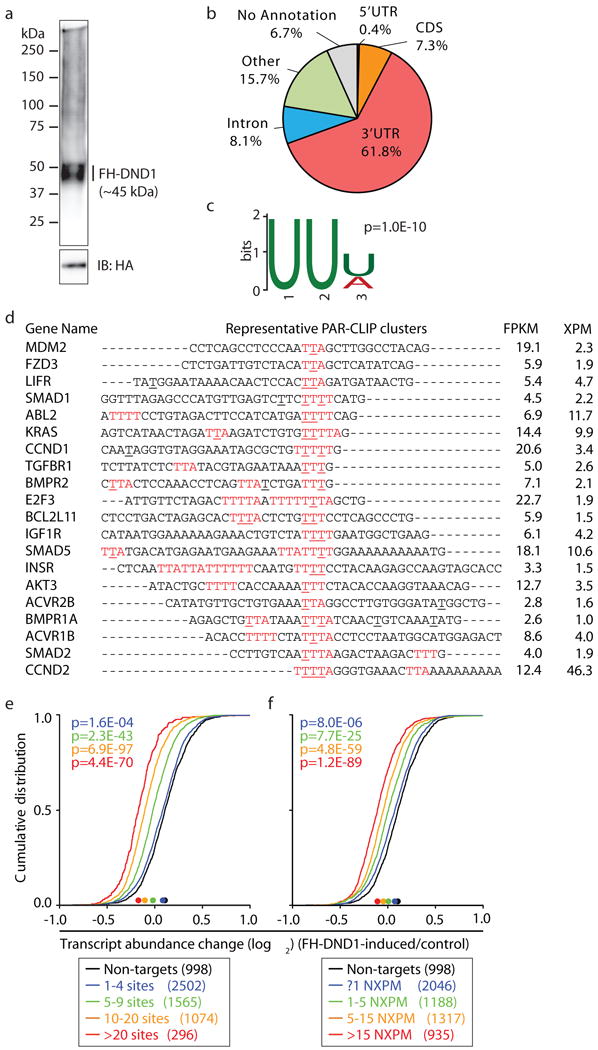
a, Autoradiograph of crosslinked and radiolabelled FH-DND1 ribonucleoprotein separated by SDS-PAGE. b, Distribution of crosslinked sequence reads. c, Sequence logo representation of the DND1 RRE. d, Sequence alignment of representative DND1 binding sites. Red letters, RRE; underlined, positions of cross-linking (≥20% of reads); bold letters, crosslinking found in replicates 1 and 2; XPM, crosslinked reads per million. e and f, mRNA expression changes upon FH-DND1 induction in HEK293 cells determined by RNA-seq. The empirical cumulative distribution function (CDF) of DND1 targets binned by number of (e) binding sites or (f) number of NXPM (coloured lines) compared to expressed non-targets (FPKM ≥5, black line). Median change is indicated by dots on the x-axis. p-values determined by Mann-Whitney-U (MWU) test.
The RRE of DND1 is contained within AU-rich elements (AREs; AUUUA) established to influence mRNA half-life by recruitment of ARE-binding proteins (ARE-BPs), such as ELAVL1/HuR and ZFP36/TTP13 (Extended Data Fig. 2e,f). We therefore investigated the influence of DND1 on target mRNA stability upon DND1 induction in HEK293 and found significantly lowered target mRNA levels by RNA-seq (Supplementary Table 1). This reduction was dependent on the number of DND1 binding sites and the number of crosslinked reads per target mRNA relative to its overall mRNA abundance (normalized crosslinked reads per million, NXPM). Targets with ≥20 sites were on average ~5 times more destabilized than targets with 1–4 binding sites (1.27- vs. 1.05-fold median reduction in target mRNA abundance; Fig. 1e). Similarly, mRNAs collecting ≥15 NXPM and were on average ~10 times more destabilized than targets <1 NXPM (1.20- vs. 1.02-fold median reduction; Fig. 1f). Only binding sites located in the 3′ UTR contributed to the DND1-mediated target mRNA reduction (Extended Data Figs. 2g–i). The DND1-mediated target mRNA reduction was unaffected by inhibition of transcription, suggesting posttranscriptional regulation (Extended Data Fig. 2j).
To elucidate the molecular mechanism of DND1-mediated target repression, we identified interaction partners of DND1 by mass spectrometry of RNase-treated FH-DND1 immunoprecipitates (Extended Data Fig. 3a,b, Supplementary Table 2). We detected 6 of the 12 members of the CCR4 complex among the top-enriched proteins (Fig. 2a, Extended Data Fig. 3b,c). We mapped the vertebrate-conserved N-terminal region of the CCR4 scaffolding subunit CNOT1 as the interaction domain with DND1 by using pulldown experiments with GST-tagged CNOT1 variants from FH-DND1 cell lysates (Fig. 2b, Extended Data Fig. 3d,e). This interaction was direct as the GST-CNOT11–551 fusion protein also pulled down recombinantly expressed FLAG-His-tagged DND1 (Fig. 2c). The shRNA-knockdown (KD) of CNOT1 and CNOT7 (Extended Data Fig. 3f, Supplementary Table 1) strongly abrogated DND1-mediated repression (Fig. 2d–f). Furthermore, tethering of a DND1-PP7-coat protein fusion to a reporter RNA containing cognate PP7-hairpin sequences in its 3′ UTR also reduced reporter RNA levels in a CCR4-dependent manner (Extended Data Fig. 3g,h). Our data suggest that DND1 binding led to target mRNA destabilization by direct recruitment of the CCR4 complex.
Fig. 2. DND1 interacted with the CCR4 complex to mediate mRNA decay.
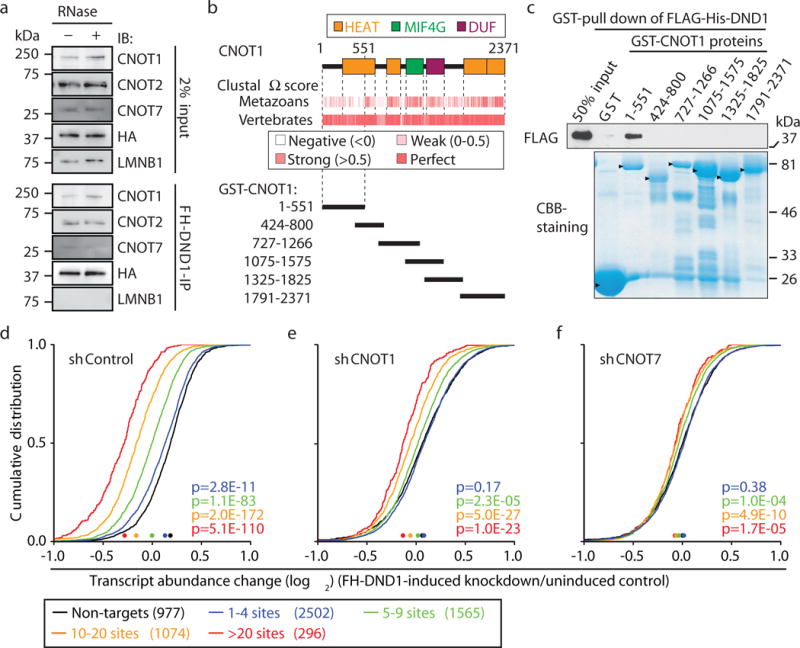
a, Immunoblot probed for the indicated proteins after FLAG-IP from FH-DND1 HEK293 lysates with and without RNases. Raw gel data, see Supplementary Fig. 1. b, Domain organization of human CNOT1 (upper) and fragments (lower) used in pulldown experiments, and conservation in metazoans or vertebrates (middle). c, Pulldown of recombinant FLAG-His-tagged DND1 by recombinant GST-CNOT1 fragments. Top panel, immunoblots probed with anti-FLAG. Bottom panel Coomassie Brilliant Blue (CBB) stain of input GST-CNOT1 proteins (arrowheads). d–f, CDF of FH-DND1-mediated mRNA expression changes after transduction of (d) control shRNA, (e) shCNOT1, or (f) shCNOT7; for labelling, see Fig. 1e.
Next, we explored the gene regulatory pathways affected by DND1. Pathway analysis of the top 300 DND1 targets showed enrichment for genes associated with signalling pathways regulating pluripotent stem cells and cancer development (e.g. TGF-β, WNT, and PI3K-AKT signalling) (Extended Data Fig. 4, Supplementary Table 3). The precise regulation of TGF-β levels and suppression of pluripotency genes are also critical for subsequent male differentiation in the gonad and a signal imbalance leads to male infertility and is correlated with TGCT formation14, i.e. phenotypes observed for Dnd1 loss-of-function1.
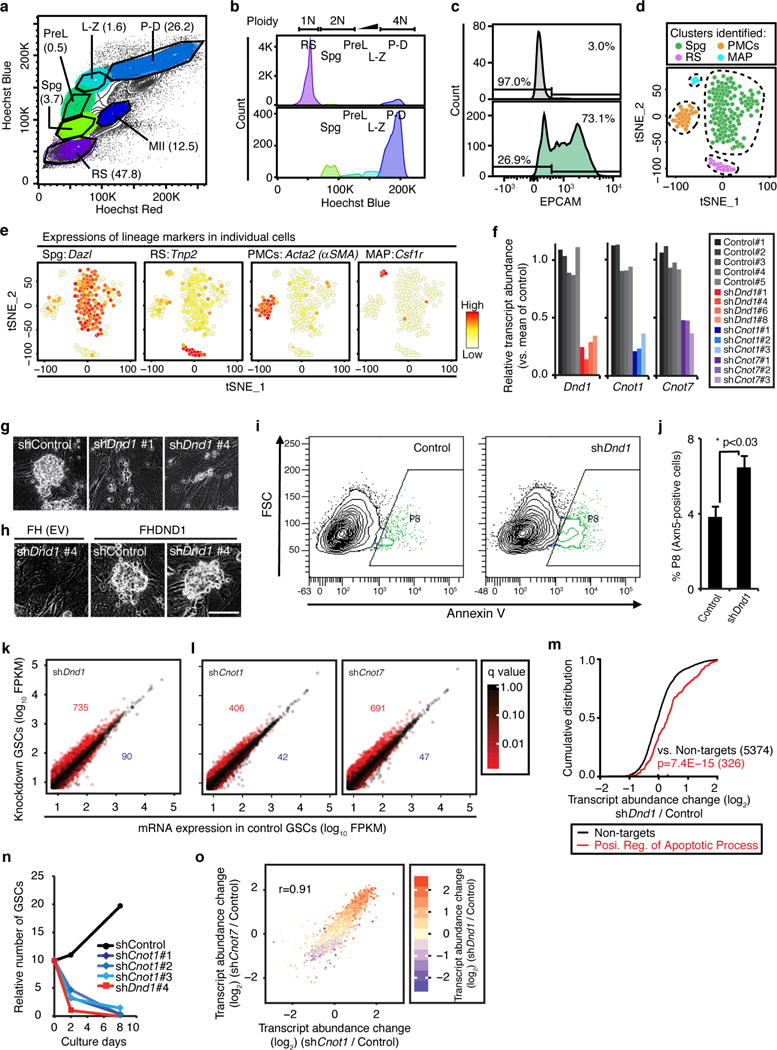
In order to validate our results in murine Dnd1-expressing PGCs and spermatogonia, we determined DND1 PAR-CLIP targets in SNL cells stably expressing FH-DND1 and found that mouse and human DND1 targeted homologous mRNAs and pathways (Spearman ρ=0.59) (Extended Data Fig. 5, Supplementary Table 4). We then determined the mRNA profiles of individual spermatogenic cells from mouse testes using Drop-seq15. We obtained the transcriptomes of 187 testicular cells, which included 115 spermatogonia (Fig. 3a, Extended Data Fig. 6a–e, Supplementary Table 5). t-Distributed Stochastic Neighbor Embedding (t-SNE) analysis16 identified three subtypes of spermatogonia: undifferentiated type-A spermatogonia (undiff. Spg; Nanos3-positive, 50 cells), differentiating type-A spermatogonia (diff. Spg, Kit-positive, 51 cells), and type-B-like spermatogonia (B-like Spg, Brca2-high, 14 cells). Undiff. Spg exhibited the highest expression of Dnd1, which was reduced in diff. Spg, and undetectable in more advanced cell types, such as B-like Spg (Fig. 3b). DND1 target mRNA expression showed an inverse relationship with Dnd1 levels and increased significantly between undiff. and diff. Spg (Fig. 3c) and even more between undiff. Spg and B-like Spg (Fig. 3d) (1.27- and 1.49-fold increase of median mRNA level for the top quartile of targets).
Fig. 3. DND1-mediated target mRNA destabilization in adult murine spermatogonia and spermatogonial stem cells.
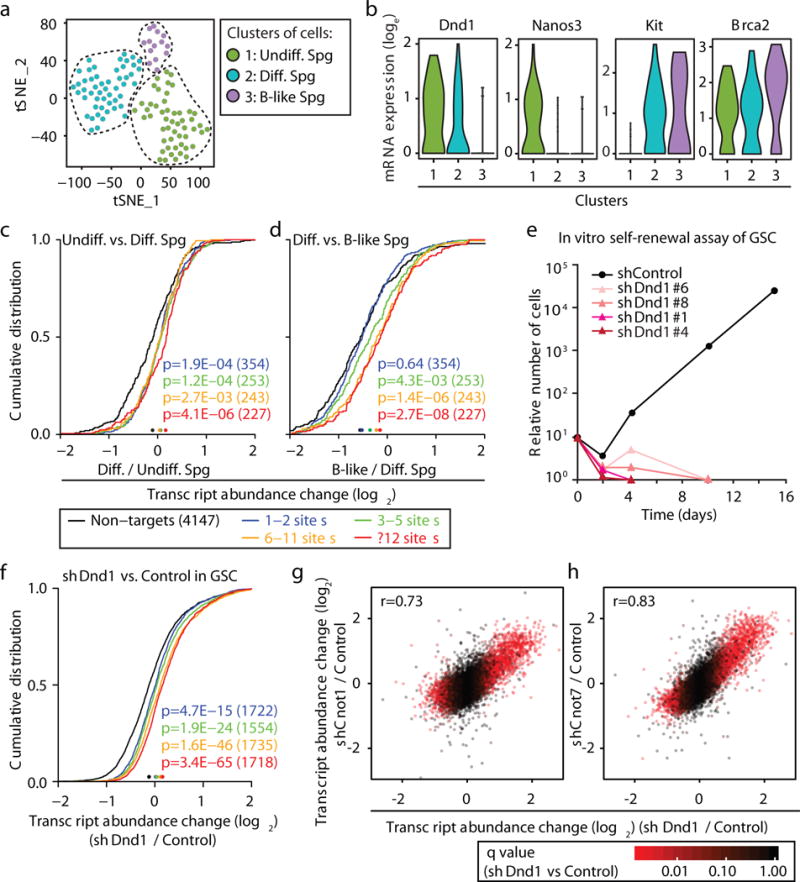
a, t-SNE analysis16 of Drop-seq data from adult murine spermatogonia (Spg). Clusters of undiff. (green), diff. (blue), and B-like Spg (purple) are shown. b, RNA expression levels of the indicated genes in the three Spg types. c,d CDF of average transcript abundance change from scRNA-seq comparing (c) Undiff. and Diff. Spg., and (d) Diff. and B-like Spg. Binning of mouse 4SU PAR-CLIP targets as in Fig. 1e (Supplementary Table 5). e, Time course counting relative number of GSCs transduced at d0 with the indicated shRNAs. f, Transcript abundance change of GSCs transduced with either shDnd1 or a control shRNA. g–h, Scatterplot of transcript abundance changes of shDnd1/Control and (g) shCnot1/Control or (h) shCnot7/Control. Colour according to q-value. Pearson’s r is indicated.
For loss-of-function analyses, we cultured undiff. spermatogonia and established murine GSCs10. Depletion of Dnd1 by shRNAs resulted in a significant increase in apoptosis and a complete loss of GSCs, indicating its critical role in SSC self-renewal (Figs. 3e, Extended Data Fig. 6f–j). mRNA profiling in Dnd1-KD and control GSCs revealed, as expected, an upregulation of DND1 PAR-CLIP targets upon Dnd1 depletion, including positive regulators of apoptosis (Fig. 3f, Extended Data Fig. 6k,m). Next, we depleted Cnot1 and Cnot7 in GSCs (Extended Data Fig. 6f). Analogous to Dnd1-KD GSCs, we found a significant loss of Cnot1-KD GSCs within 8 days, supporting a critical role of the CCR4 complex in SSC self-renewal (Extended Data Fig. 6n). CNOT1-, CNOT7-, and DND1 shared overlapping downstream targets: pairwise comparison of mRNA changes showed a strong correlation between Dnd1-KD and Cnot1-KD (Pearson’s r=0.73) or Cnot7-KD (r=0.83) (Fig. 3g,h, Extended Data Fig. 6l,o). Thus, we concluded that DND1 targets and mechanism are conserved among vertebrates, and that DND1 is one of the major mRNA-directed protein engaging the CCR4 complex to regulate the transcriptome of SSCs. Additionally, by competing for access to CCR4, DND1 may temporarily dampen miRNA-guided destabilizing effects, offering an alternative explanation for the previously observed loss of miRNA control of CDKN1B upon DND1 overexpression8 (Extended Data Fig. 3i).
Next, we investigated the role of DND1 during PGC development, a process previously characterized as a complex interplay of transcriptional and posttranscriptional regulation17. We recapitulated PGC specification18 and induced PGC-like cells (PGCLCs) from ESC-derived epiblast-like cells (EpiLCs) in sphere cell culture. First, we compared the mRNA profiles of EpiLCs with whole spheres consisting of ~40–50% PGC-precursors at day 2 (d2) of the induction course, as well as to sorted PGCLCs at d4 (Supplementary Table 6). The ~7- to 10-fold induction of Dnd1 expression in d2 and d4 PGCLCs (88 and 133 FPKM) was accompanied by a down-regulation of DND1 PAR-CLIP targets (Fig. 4a, Extended Data Fig. 7a,b). This inverse expression pattern of Dnd1 and its target mRNAs was also observed in gene expression profiles from in vivo PGC precursors19, further supporting the role of DND1 as a negative regulator of target gene expression (Extended Data Fig. 7c,d, Supplementary Table 7).
Fig. 4. DND1 preferentially destabilizes target mRNAs that are concurrently transcriptionally silenced during the time course of PGCLC differentiation.
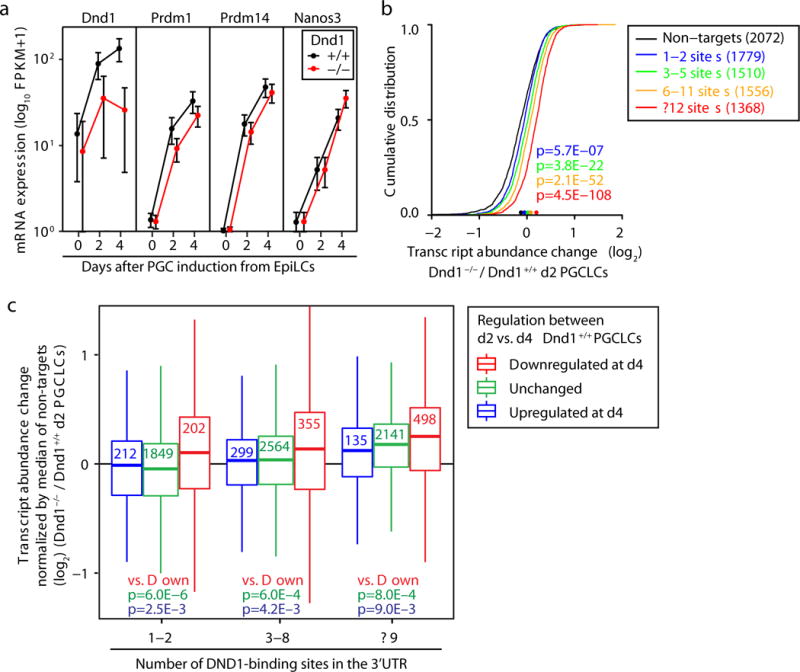
a, Expression level of PGC marker genes across d0 to d4 of PGCLC induction from wild-type and Dnd1−/− EpiLCs. b, CDF of transcript abundance change from RNA-seq comparing d2 Dnd1+/+ and Dnd1−/− PGCLCs. Binning as in Fig. 3f. c, Boxplots of transcript abundance change comparing d2 Dnd1+/+ and Dnd1−/− PGCLC for transcripts with the indicated number of DND1-binding sites. These groups were further binned according to whether transcripts were silenced (q<0.05; red box), unchanged (q≥0.05; green box), or upregulated (q<0.05; blue box) between d2 and d4 of the PGCLC induction time-course in wild-type cells.
We established three independent Dnd1−/− ESC lines (Extended Data Fig. 7e–g), all of which were incapable of supporting germline development in vivo (Extended Data Fig. 8a–c). We induced PGCLCs from these cells and observed that the induction of germ cell genes, including critical factors for PGC development (e.g. Prdm1, Prdm14, and Nanos3) in Dnd1−/− PGCLCs was comparable to wild type despite a ~72% reduction of d4 Dnd1−/− PGCLC numbers, which mirrored the ~85% loss of PGCs right after the successful PGC specification in Dnd1ter/ter embryos5 (Fig. 4a, Extended Data Figs. 8d,e and 9a,b). Transcriptomic analysis of Dnd1−/− EpiLCs (d0), d2, and d4 PGCLCs revealed, as expected, a significant upregulation of DND1 target mRNAs by d2 (Fig. 4b, Extended Data Figs. 8f and 9c,e,f). We next subdivided DND1 target mRNAs according to whether they were upregulated, downregulated, or unchanged in wildtype PGCLCs between d2 and d4. We observed that Dnd1 loss preferentially affected those DND1 target mRNAs that are also transcriptionally silenced (downregulated) during PGCLC induction (Fig. 4c). Thus, we propose that analogous to other posttranscriptional regulators, including miRNAs20, DND1 helps sharpen developmental transitions in developing PGCs by clearing mRNAs of genes undergoing parallel transcriptional silencing.
We observed a broad upregulation of functional groups of genes relating to the phenotype triggered by Dnd1 loss, including regulators of apoptosis and inflammation (Extended Data Fig. 8c, Supplementary Table 8). Increased inflammatory signalling may drive inflammatory apoptosis and contribute to the loss of Dnd1−/− PGCs3 (Extended Data Figs. 6j,m, 9c,d). Considering that DND1 was found to shuttle between nucleus and cytoplasm21, it is conceivable that loss of function of DND1 and increased target mRNA abundance may trigger an aberrant nucleic-acid-driven innate response contributing to the inflammatory apoptosis22. The activation of transcription of pluripotency genes including Nanog23, TGF-β signalling14, and inflammatory signalling may contribute to the formation of TGCTs in Dnd1ter/ter mutant mice (Extended Data Fig. 9c–g).
A small group of RBP family proteins, including piRNA pathway, DAZ, NANOS, and DND1 proteins, are specifically expressed in the germline24 and implicated in facilitating RNA turnover25–29. These factors provide specificity for target RNA recognition and recruit and possibly coactivate general RNA turnover complexes to control posttranscriptional gene regulation essential for development and maintenance of the mammalian germ line.
Methods
Microarray
The microarray expression data (139 samples from 6 previous publications19, listed in Supplementary Table 9) were downloaded from Gene Expression Omnibus (GEO) and the CEL files were normalized concurrently for all samples using the dChip software30.
Cell lines and culture conditions
HEK293 T-REx Flp-In cells (Thermo Fisher Scientific) were grown in in Dulbecco’s modified Eagle’s medium (DMEM) (Thermo Fisher Scientific; cat #11965-118) supplemented with 10% (v/v) fetal bovine serum (FBS) (SIGMA-ALDRICH; cat #F4135-500ML), 1× penicillin-streptomycin solution (Thermo Fisher Scientific; cat #15140-122), 100 μg/ml zeocin (cat #ant-zn-5; Invivogen) and 15 μg/ml blasticidin (cat #ant-bl-5; Invivogen). Cell lines stably expressing FLAG-HA- (FH-) DND1 were generated as described previously31 and maintained in the same cell culture medium supplemented with 100 μg/ml HygroGold (cat #ant-hg-5; Invivogen) and 15 μg/ml blasticidin (cat #ant-bl-5; Invivogen). Expression of FH-DND1 was induced by addition of 250 ng/ml doxycycline. Mouse embryonic fibroblast cell line, SNL cells, were grown in DMEM (Thermo Fisher Scientific; cat #11965-118) supplemented with 10% (v/v) fetal bovine serum (FBS) (SIGMA-ALDRICH; cat #F4135-500ML), 1× penicillin-streptomycin solution (Thermo Fisher Scientific; cat #15140-122), 1× MEM non-essential amino acids solution (Thermo Fisher Scientific; cat #11140-050), and 1 mM sodium pyruvate (Thermo Fisher Scientific; cat #11360-070). Mouse FH-DND1 stable cells were established by using lentiviral vector generated from pLVE-FH-Dnd1-IN and maintained with the SNL cell culture medium supplied with 250 μg/ml of Geneticin/G418 (Thermo Fisher Scientific; cat #10131-035). All cells were routinely authenticated and tested for mycoplasma contamination.
PAR-CLIP
4SU PAR-CLIP was performed as described previously11. PAR-CLIP cDNA libraries were sequenced on an Illumina HiSeq 2500 instrument. Clusters of overlapping reads uniquely mapping to the human genome hg19 and mouse mm10, respectively, were generated using the PARalyzer software12 allowing for one mismatch and otherwise default settings. Clusters were annotated against Gencode gtf files; human: gencode.v19.chr_patch_hapl_scaff.annotation.gtf; mouse: gencode.vM2.chr_patch_hapl_scaff.annotation.gtf (http://www.gencodegenes.org). Alignment data is also available on https://rnaworld.rockefeller.edu/DND1/. We intersected the two deepest datasets (Replicate 1 and 2; Spearman correlation ρ=0.91; Extended Data Fig. 2a,b). The shared clusters were defined as “DND1 binding sites” in our transcriptomic analyses.
Tethering Assay
For Extended Data Fig. 3g,h, DND1 cDNA was cloned in frame with the sequence coding for the PP7 coat protein into pCMV-PP7 (provided by D.R. Larson and M. Palangat, NCI/NIH). Unaltered pCMV-PP7 was used to adjust the overall amount of plasmid DNA, which was maintained constant across transfection experiments. Plasmid pcTET2 containing ß-globin cDNA fused to 4× PP7 stem loops in its 3′ UTR and was used for doxycycline-inducible expression of the reporter RNA (provided by J.R. Hogg, NHLBI/NIH). Increasing concentration of pCMV-DND1-PP7 (0, 0.25, 0.75, 1, and 1.5 μg) were co-transfected with 0.25 μg of the reporter plasmid using 6 μl/well Lipofectamine 3000 (Invitrogen) according to manufacturer’s recommendation into HEK293 T-REx cells grown in 12-well plates to 70% confluency. Twenty-four hours after transfection, expression of the reporter RNA was induced by adjusting the culture medium concentration to 0.1 μg/ml doxycycline and further incubated for 24 h. ß-globin mRNA levels were quantified by qPCR using the following primers: forward 5′-AGC TGC ACT GTG ACA AGC TG; reverse 5′-CTG GTG GGG TGA ATT CTT TG and normalized against GAPDH (Primers: forward: 5′-GGA GCG AGA TCC CTC CAA AAT; reverse: 5′-GGC TGT TGT CAT ACT TCT CAT GG). When combined with the depletion of CNOT1 and CNOT7, 0.25 μg of shRNA expression plasmids (pLKO.1 or pLKO.5; Supplementary Table 9) were first transfected into HEK293 T-REx cells using 6 μl/well Lipofectamine 3000 (Invitrogen) for 72 h into HEK293 T-REx cells grown in 12-well plates to 70% confluency. After 72 h, cells were split 1:2 before co-transfection of 0.25 μg shRNA plasmids, 1 μg of pCMV-DND1-PP7 (or pCMV-PP7 for control), and 0.25 μg of reporter plasmid using 6 μl/well Lipofectamine 3000. Twenty-four hours after transfection, expression of the reporter RNA was induced by adjusting the culture medium concentration to 0.1 μg/ml doxycycline and further incubated for 24 h.
Co-Immunoprecipitation experiments
FH-DND1-HEK293 cells from one confluent 15-cm plate were lysed in NP40 lysis buffer (50 mM HEPES, pH 7.5, 150 mM KCl, 2 mM MgCl2, 1 mM NaF, 0.5% (v/v) NP40, 0.5 mM DTT, complete EDTA-free protease inhibitor cocktail (Roche)) and FH-DND1 immunoprecipitated with anti-FLAG-M2 magnetic beads (SIGMA-ALDRICH, cat #M8823) in the presence or absence of 5 U/μl RNase A and 200 U/μl RNase T1 (RNase A/T1 mix, Thermo-Fisher, cat #AM2286). Magnetic beads were washed twice with NP40 lysis buffer and the immunoprecipitate eluted with SDS-gel loading buffer. Co-immunoprecipitated proteins were detected using Western Blotting with the following antibodies: anti-DYKDDDDK (Cell Signaling Technology, cat #2368), anti-CNOT1 (Proteintech, cat #14276-1-AP), anti-CNOT6 (Cell Signaling Technology, cat #13415), anti-CNOT7 (Proteintech, cat #14102-1-AP), and anti-TUBA (Cell Signaling Technology, cat #2125).
RNA-sequencing
Oligo(dT)-selected RNA was converted into cDNA for RNA sequencing using the Illumina TruSeq RNA Sample Preparation Kit v2 or TruSeq Stranded mRNA Sample Prep Kit according to the instructions of the manufacturer and sequenced on an Illumina HiSeq 2500 or NextSeq 500 platform using 100- or 150-nt single-end sequencing, respectively. For RNA-seq analysis of CNOT1- or CNOT7-depleted FH-DND1 HEK293 cells, the cells were transfected with shRNA expression plasmids by using Lipofectamin 3000 (Thermo Fisher Scientific; cat #L3000015), grown with supplementation of 4 μg/mL of puromycine, and harvested 4 d after transfection. GSCs are collected 4 d after lentiviral transduction. For RNA-seq analysis of GSCs, the cells are harvested 4 d after lentiviral transduction.
Lentivirus
For lentiviral transduction, lentiviral plasmids (pLKO.1 or pLKO.5 for shRNAs; pLVE-FH-EV/mouseDND1-IN for DND1 rescue experiment in GSCs) plasmids were prepared or purchased from SIGMA-ALDRICH as listed in Supplemental Table 9. Packaging plasmids, psPAX2 and pMD2.G, were provided by D. Trono (Addgene plasmids #12260 and #12259, respectively). Lentivirus particles were produced by transfecting 293T/17 cells as described elsewhere (https://www.addgene.org/tools/protocols/pLKO/), concentrated by using Lenti-X Concentrator (Clontech; cat #631231), and suspended in HBSS(+). The virus titer was measured by colony formation assay using 293T/17 cells or the Lenti-X GoStix Kit (Clontech; cat #631244). The multiplicity of infection (MOI) was adjusted to ~5. Lentivirus-transduced GSCs were selected with 125–500 ng/ml puromycin or 200 μg/ml G418 at 2 d after lentiviral transduction. For growth assay, 1.3×10⁵ GSCs are plated on 24-well plate. For the cDNA rescue experiment of Dnd1-KD GSCs, FLAG-HA-tagged mouse DND1 (FH-DND1) was transduced into GS cells using lentiviruses and stable transformants were established by G418 selection. As negative control, a stable transformant with empty vector (FH/EV) was established. shDnd1#4, which targets the 3′ UTR of the Dnd1 transcripts, was transduced into all stable transformants to specifically deplete endogenous Dnd1.
Plasmid construction
Plasmid pENTR4 human DND1 (hDND1) was generated by PCR amplification of the respective coding sequences (CDS) followed by restriction digest with SalI and NotI and ligation into pENTR4 (Thermo Fisher Scientific) to create pENTR4-hDND1 (deposited in Addgene; plasmid #70070). pENTR4-hDND1 was recombined into pFRT/TO/FLAG/HA-DEST destination plasmid (Thermo Fisher Scientific) using the GATEWAY LR recombinase (Thermo Fisher Scientific).
For efficient induction of transgene expression in GSCs and SNL cells, we modified a lentiviral expression vector by fusing the 3′ UTR sequence of Eef1a132 to the CDS of Dnd1 (data not shown). The DNA sequences of internal ribosome entry site (IRES) and neomycin-resistant gene (neor) were PCR-amplified from pLV-tTRKRAB-red [provided by D. Trono (Addgene plasmid #12250)33] and pEGFP-N1 (Clonetech), respectively. The mouse Dnd1 coding sequence and 3′ UTR of mouse Eef1a1 (NM_010106.2; 5′- ATATTACCCCTAACACCTGCCACCCCAGTCTTAATCAGTGGTGGAAGAACGGTCTCAGAACTGTTTGTCTCAATTGGCCATTTAAGTTTAATAGTAAAAGACTGGTTAATGATAACAATGCATCGTAAAACCTTCAGAAGGAAAGAATGTTGTGGACCATTTTTTTTGTGTGTGGCAGTTTTAAGTTATT-3′) were cloned by PCR flanked with BamHI sites and EcoRI and KpnI sites, respectively. Then, a BamHI-IRES-neor (IN)-EcoRI-3′ UTR-of-Eef1a1(E)-KpnI fragment was synthesized by PCR flanked with PspXI-FLAG-HA(FH)-BamHI at the 5′ end. Then, the PspXI-FH-BamHI-IRES-neor-EcoRI-E-KpnI fragment was subcloned into PspXI and KpnI sites of pLV-tTRKRAB-red to create pLVE-FH-IN (deposited in Addgene; plasmid #70071). This plasmid was used as a negative control (FH-only or empty vector). The Dnd1 coding sequence was cloned into the BamHI site of pLVE-FH-IN to create pLVE-FH-Dnd1-IN (deposited in Addgene; plasmid #70072).
For knockdown experiments, The RNAi Consortium (TRC) shRNA-expression plasmids were purchased from SIGMA-ALDRICH as listed in Supplementary Table 9. For shDnd1 expression plasmids, shRNA-coding DNA fragments were synthesized and subcloned into the AgeI and EcoRI sites of the TRC cloning plasmid, pLKO.1 (provided by D. Root; Addgene plasmid #10878)34 to create pLKO.1-shDnd1 #1-#8 (deposited in Addgene; plasmids #70058-#70060, #70065-#70069). pLKO.1-scramble shRNA was provided by D. Sabatini (Addgene plasmid #1864)35.
For preparation of recombinant FLAG- and 6×His-tagged DND1 protein, human DND1 CDS was cloned into NcoI and BamHI sites of pET11d (cat #69439-3; EMD Millipore) after codon optimization for bacterial expression to create pET11d-FHisDND1 (deposited in Addgene; plasmid #70083). Expression plasmids of GST-CNOT1 deletion mutants (pGEX-6P1-CNOT1) were provided by N. Sonenberg36.
GO and KEGG analysis
Gene Ontology (GO) and KEGG pathway analysis were carried out using the DAVID gene ontology functional annotation tool (http://david.abcc.ncifcrf.gov/)37,38 with default parameters. We ranked terms according to the P-value (also known as EASE score), which is derived from a modified Fisher’s exact test.
Motif analysis
Motif analysis was carried out using the MEME suite, DREME (http://meme.nbcr.net/meme/doc/dreme.html)39. We defined a set of top 1,000 clusters from a PAR-CLIP library stringently digested with RNase T1 (replicate 3, An external database for a full list of DND1 binding sites is available at https://rnaworld.rockefeller.edu/DND1/), ranked by number of crosslinked sequence reads and 3′ UTR sequences of non-target mRNAs as control.
Animals and stem cell cultures
The Rockefeller University Institutional Animal Care and Use Committee (IACUC) approved all procedures. Timed pregnant mice were purchased from Taconic Farm. Mouse embryonic fibroblasts (MEFs) were derived from E12.5 embryos of ICR mice and maintained in Dulbecco’s modified Eagle’s medium (DMEM) (Thermo Fisher Scientific; cat #11965-118) supplemented with 10% (v/v) fetal bovine serum (FBS) (SIGMA-ALDRICH; cat #F4135-500ML), 1× penicillin-streptomycin solution (Thermo Fisher Scientific; cat #15140-122;), 1× MEM non-essential amino acids solution (Thermo Fisher Scientific; cat #11140-050), and 1 mM sodium pyruvate (Thermo Fisher Scientific; cat #11360-070). MEFs were treated with 10 μg/mL mitomycin C (SIGMA-ALDRICH; cat #M4287) for 2 h and washed twice with PBS(-) before using them as feeder cells. Germline stem cells (GSCs) were established from testes of ICR mice at postnatal day (P) 3–5 and maintained as described previously10 on feeder cells. Embryonic stem cells were established from 129Sv strain of mice (129S6/SvEvTac) as described previously40 with some modifications; ESCs were maintained with N2B27/2iLIF medium supplied with 1% knockout serum replacement (KSR) (Thermo Fisher Scientific; cat #10828-010) on cell culture plates coated with 0.1% (w/v) gelatine. ESC-lines were sexed by sex-chromosome-specific PCRs, and male ESC lines were used in the analyses.
Apoptosis assay by using fluorescence-activated cell-sorting (FACS) analysis
shRNA-transduced GSCs were dissociated 3 d after lentiviral transduction as described above, briefly cultured with the complete GSC medium for 15 min, washed with PBS(−) supplemented with 0.1% BSA (Thermo Fisher Scientific; cat #15260-037), and collected by centrifugation. Annexin V was detected by using FITC Annexin V Apoptosis Detection Kit I (BD Bioschences, cat #556547). Large clumps of cells were removed using a cell strainer (BD Biosciences). Cells were sorted and analysed by flow cytometry (LSR II; BD Biosciences).
Chimera assay
ESCs (129S6/SvEvTac) were transformed with a PiggyBac plasmid carrying an mCherry expression cassette under control of a CAG promoter. To generate chimeric embryos, ~10–15 ESCs were injected into the blastocoel cavity of blastocysts from B6(Cg)-Tyrc-2J/J (B6 albino) mice. Injected blastocysts were transferred to 2.5-dpc pseudopregnant females, and the chimeric embryos were harvested at gestational day 12.5 of surrogate mother. The contribution of ES cells in chimeras was evaluated by eye color and mCherry expression.
CRISPR-Cas9-mediated gene editing for generating Dnd1 mutant ESCs
CRISPR-Cas9-mediated genome editing was performed as described previously41. We designed three small guide RNAs (sgRNAs) and used pairs of the sgRNAs42 for the targeted deletions of RNP-encoding region of Dnd1 loci (Extended Data Fig. 7e). The following primers were used for the PCR-genotyping: sense primer, 5′-ATC CTT GTG GAC CAC AGT AAC C-3′; anti-sense primer, 5′-GGT TCA AAC CAC TGA AGG TCA TC-3′. The PCR products were cloned into a pGEM-T Easy plasmid (Promega, cat #A1360), and ~10 clones/ESC-line were sequenced. The results were further confirmed by RNA-seq analyses (Extended Data Fig. 7b,c).
Induction of epiblast-like cells (EpiLCs) and primordial germ cell-like cells (PGCLCs) from embryonic stem cells (ESCs)
1.5×10⁵ cell/well of ESCs were plated on a 12-well plate and induced into EpiLCs for 48 h as described previously43. The EpiLCs were then cultured under a floating condition by plating 2–3×10³ cells per well of a 96-Well Clear Round Bottom Ultra Low Attachment Microplate (Corning, cat#7007) in GK15 medium supplemented with LIF, BMP4 (500 ng/mL), SCF (100 ng/mL), and EGF (50 ng/mL). d4 PGCLCs were purified with a fluorescence-activated cell sorter (FACS) (ARIA II; BD Biosciences) by using anti-SSEA1/CD71-eFluor660 (1:20 dilution; eBioscience, cat #50-8813-41) and anti-ITGB3/CD61-PE antibodies (1:200 dilution; BioLegend, cat #104307).
Drop-seq of murine spermatogonia from adult testes and data analysis
Germ cells were isolated and purified according to a previously published protocol44 (Extended Data Fig. 6a,b). The fraction enriched with spermatogonia was confirmed by quantification of the expression of the surface marker antigen of spermatogonia, EPCAM, using FACS (anti-EPCAM-FITC; fold dilution, 1:100; eBioscience, cat #11-5791-80) (Extended Data Fig. 6c).
Single cell sequencing of the spermatogonia-enriched fraction was performed using Drop-seq method as described previously15 (Drop-Seq Laboratory Protocol, version 3.1; http://mccarrolllab.com/dropseq/). The amplified cDNA was purified and quantified on TapeStation (Agilent 2200). The cDNA was tagmented and amplified with Nextera XT DNA sample prep kit (Illumina) using P5-SMART and N701 primers. The library was purified, quantified and sequenced on the NextSeq 500 (High-output) platform using custom Read1 primer. The raw data was analyzed as described in Drop-seq Core Computational Protocol, version 1.0.1 (http://mccarrolllab.com/dropseq/). Read 2 was trimmed at the 5´ end to remove any adapter sequence, and the 3´ end was trimmed to remove polyA tails of length 6 or greater. These reads were aligned to mouse (mm10) genome using STAR v2.4.2a. Dropseq tools 1.12 were used to generate the gene expression matrix for downstream clustering analysis.
Using the Seurat package for R45, distinct cell clusters were obtained via PCA and visualized by tSNE plotting. We first identified the set of genes that was most variable across datasets, after controlling for the relationship between mean expression and variability. We calculated the mean and a dispersion measure (variance/mean) for each gene across all 200 single cells, and placed genes into 20 bins based on their average expression. Within each bin, we then z-normalized the dispersion measure of all genes within the bin, in order to identify outlier genes whose expression values were highly variable even when compared to genes with similar average expression. We used a z-score cutoff of 0.7 to identify 447 highly variable genes. In this analysis all genes were evaluated for variability including the presumed ubiquitously expressed genes that were excluded from the previous analysis, which is a potential advantage of this method. We reduced our PCA to 12 significant principal components as previously described and used these principal component loadings as input for t-Distributed Stochastic Neighbor Embedding (tSNE)16, as implemented in the tsne package in R with the “perplexity” parameter set to 14. This allowed us to differentiate transcriptomes of spermatogonia from post-meiotic cells and somatic cells including round spermatids, peritubular myoid cells, and macrophages (Extended Data Fig. 6d). We extracted single cells data of spermatogonia and repeated the above process for further differentiating subtypes of spermatogonia with the same z-score cutoff of 0.7 identifying 308 highly variable genes. We reduced our PCA to 2 significant component loadings for tSNE with the perplexity term set to 17.
GST-pulldown assays
FLAG-His-DND1 protein was expressed in E. coli BL21 (DE3) and purified with Ni-NTA agarose (cat #30210; QIAGEN). GST-CNOT1 proteins were expressed and purified as described previously36,46. GST pulldown experiments were performed as described previously47. Briefly, 5 μg of each GST protein was immobilized on glutathione-Sepharose beads and incubated for 16 h at 4 °C with purified FLAG-His-DND1 or whole cell extract prepared from HEK293 cells expressing FHDND1 in Buffer C containing 0.1 M KCl and 0.1% NP40 with gentle rocking. After washing three times with Buffer C containing 0.1 M KCl and 0.1% NP40, bound proteins were eluted by boiling beads with Laemmli sample buffer at 98 °C for 5 min.
Western blot analysis and antibodies
Proteins were separated on the SDS-polyacrylamide gel, blotted onto the Immobilon-P Transfer Membrane (Millipore, Bedford, MA), and probed with primary and secondary antibodies by using SNAP i.d. Protein Detection System (cat #SNAP2BASE; EMD Millipore). Immunodetection was performed with ECL Select Western Blotting Detection Reagent (cat #RPN2235; GE healthcare). Luminescent signal was detected by a LAS3000 image analyzer (FUJIFILM). The intensity of each signal was quantified by ImageJ software. The primary antibodies used were as follows: anti-HA mouse monoclonal, cat #MMS-101R-500, Covance; anti-FLAG M2 mouse monoclonal, cat #F3165, SIGMA; anti-FLAG rabbit polyclonal, cat #F7425, SIGMA; anti-CNOT7 mouse monoclonal, cat #sc-101009, Santa Cruz Biotechnology; anti-CNOT11 (C-6) mouse monoclonal, cat #sc-377068, Santa Cruz Biotechnology; anti-TUBA mouse monoclonal, cat #T9026, SIGMA. The following HRP-conjugated secondary antibodies from DAKO were used: anti-mouse IgG goat polyclonal, cat #P0447; anti-rabbit IgG goat polyclonal, cat #P0448; anti-goat IgG rabbit polyclonal, cat #P0449.
Conservation analysis
Conservation analyses were carried out using Clustal Omega (http://www.clustal.org/omega/)48–50. Amino acid sequences retrieved from NCBI database were used in the sequence alignment of DND1 proteins in Extended Data Fig. 1d–f or CNOT1 proteins in Fig. 3b (DND1 proteins: human, NP_919225.1; mouse, NP_775559.2; Xenopus, NP_001037899.1; zebrafish, NP_997960.1 or CNOT1 proteins: C. elegans_NP_498516.2; Drosophila_NP_724798.3; Zebrafish, NP_001073420.1; Xenopus, NP_001090658.1; Chicken, NP_001264062.1; Human, NP_001252541; Mouse, NP_835179.1).
Data Availability
PAR-CLIP sequencing data and RNA-seq data are available on the NCBI Short-Read Archive (SRA) under the accession number PRJNA352073. An external database for a full list of DND1 binding sites is available at https://rnaworld.rockefeller.edu/DND1/.
Extended Data
Extended Data Figure 1. Dnd1 expression, conservation and cell lines.
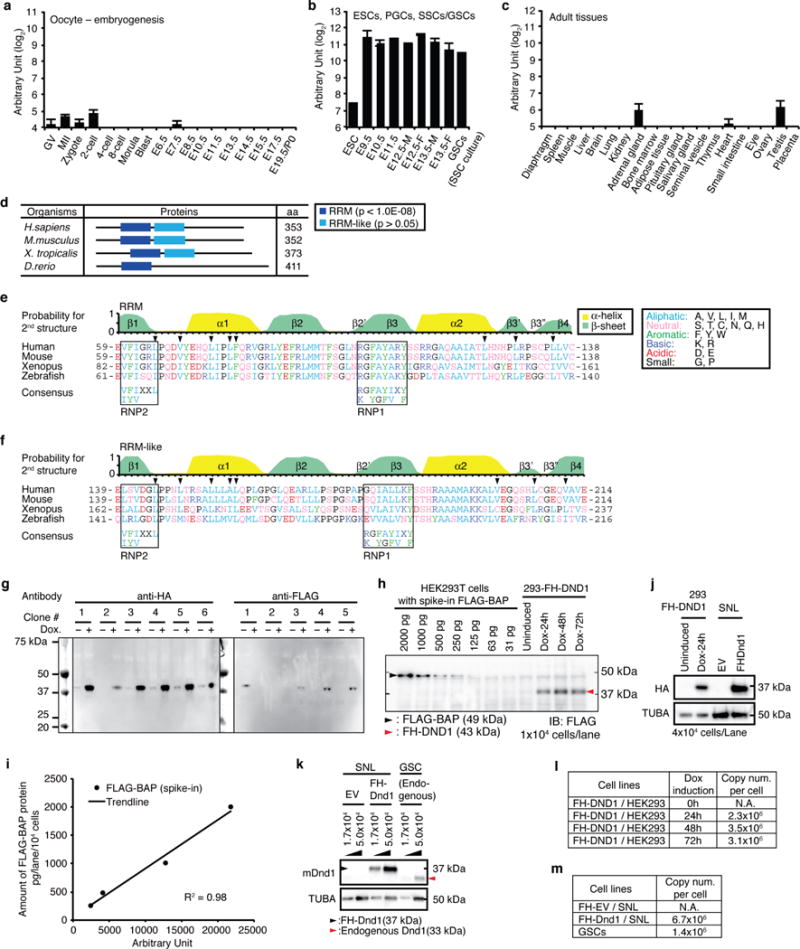
a–c, Dnd1 mRNA abundance determined by RNA-seq, a, during embryogenesis from oocytes to birth (Postnatal day 0, P0) at embryonic day (E) 19.5, b, in embryonic stem cells (ESCs), developing PGCs isolated from E9.5 to E13.5 embryos, and in vitro culture of spermatogonial stem cells (germline stem cells, GSCs), and c, in adult tissues. Error bars indicate SEM (3–5 replicates). Abbreviations: GV, germinal vesicle oocytes; MII, mature metaphase II oocytes; -M, male; -F, female. d, Domain organization of DND1 proteins from representative vertebrates determined by SMART (Normal mode, http://smart.embl.de/)51. The peptide length in aa is indicated. RRM (p <10−8) and RRM-like (p >0.05) domains are represented as blue and light blue boxes, respectively. e,f, Structure and amino acid sequence comparison of DND1 RRM (e) and RRM-like (f) domains between human and other vertebrates. The top panel indicates the probability for α-helix (yellow) and β-sheet (green) formation of human DND1 predicted by NetSurfP52 (http://www.cbs.dtu.dk/services/NetSurfP/), as well as information on secondary structure elements required to form the RRM-fold53–55. The arrowheads indicate the residues forming the hydrophobic interactions for the β3′-β3″ β-hairpin. Similarity in the amino acid composition was assessed based on the classification of the amino acid residues as shown in the legend; aliphatic (A and V), aromatic (F, Y, and W), basic (K and R), acidic (D and E), neutral (S, T, C, N, Q, and H), or small (G and P). The highly conserved ribonucleoprotein motifs, RNP2 and RNP1, involved in protein-RNA interaction, are indicated in black boxes, together with their consensus sequences, (L/I)-(Y/F)-(V/I)-X-X-L and (R/K)-G-(F/Y)-(G/A)-(F/Y)-(I/V)-X-(F/Y), respectively53,54. Note that aromatic residues in RNP1 and 2 and basic residues in RNP1 are not conserved in the RRM-like domain (f). Additionally, compared with the RRM domain, the probability to form β3′ and β3″ sheets in the RRM-like domain is low and the aliphatic residues (V200 and L206 in human) constraining the β3′-β3″ β-hairpin (arrowheads) are less conserved. g, Screen for stable HEK293 cell clones inducibly expressing FLAG-HA-tagged (FH)-DND1. Clone 4 was selected for PAR-CLIP experiments and clones 1 and 4 were used for apoptosis assays. h, The indicated amounts of purified FLAG-tagged protein (FLAG-BAP) were spiked into lysates from parental Flp-In HEK293-TRex cells. Expression of FH-DND1 in stable HEK293 cell lines was induced by doxycycline for the indicated amount of time. The equivalent of 104 cells was loaded into each well of the SDS-PAGE for immunoblotting. FLAG-BAP and FH-DND1 were detected using anti-FLAG M2 antibodies. i, Calibration curve from the signal intensity of FLAG-BAP (h) quantified by ImageJ software and plotted against the amount of FLAG-BAP (pg/104 cells). The regression line and coefficient of determination (R2) are shown. j, Protein expression of human or mouse FH-DND1 in HEK293 cells with or without Dox treatment for the indicated time or in mouse SNL cells, respectively. 4×10⁴ cells were loaded in each lane of the SDS-polyacrylamide gel. Immunoblot from was probed with anti-HA antibodies (upper panel). The same membrane was re-probed for α-tubulin (TUBA) as loading control. k, Protein expression of mouse FH-DND1 (black arrowhead) in SNL cells or endogenous mouse DND1 (red arrowhead) in GSCs, respectively. SNL cells transformed with empty vector (EV) was used as negative control. Immunoblot was probed with anti-DND1-antibody9. TUBA served as loading control. Lysate from the indicated amount of cells was loaded onto each lane of the SDS-polyacrylamide gel. l, Copy numbers per cell of FH-DND1 in HEK293 cells after induction of transgene expression for the indicated amount of time. Values were determined by quantification (h,j). m, Copy numbers per cell of FH-DND1 and endogenous DND1 in mouse cells, determined by quantification of the DND1 band from (k).
Extended Data Figure 2. DND1 PAR-CLIP analysis.
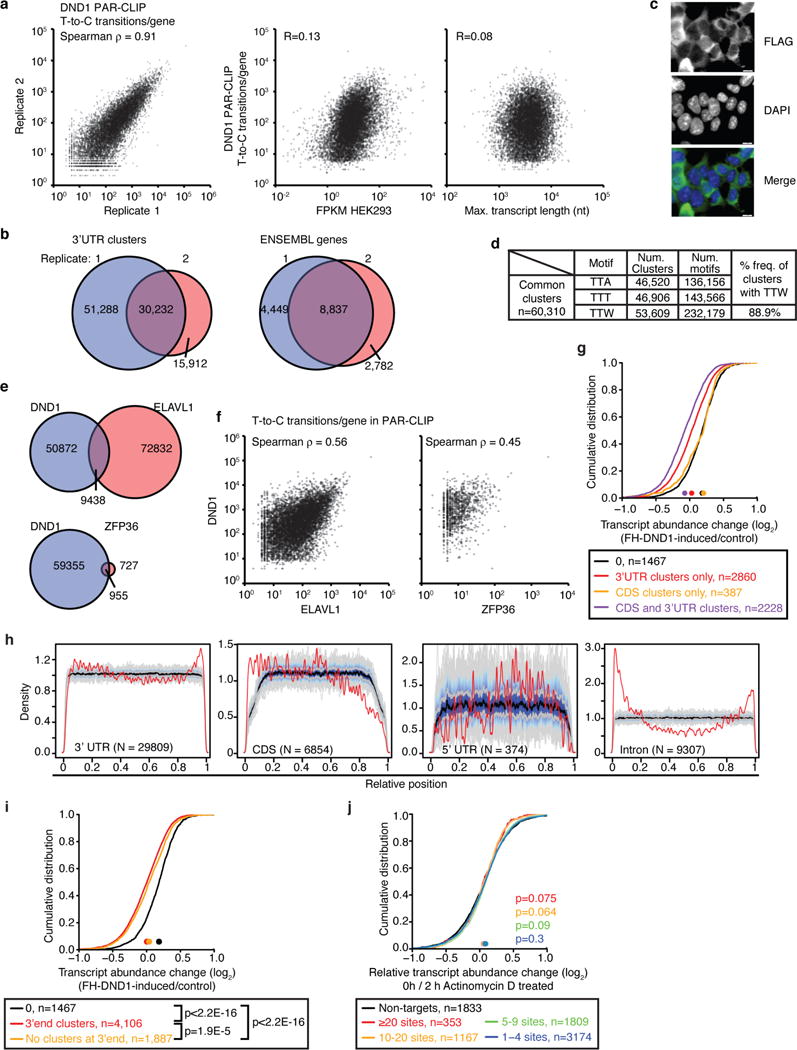
a, Left panel: Scatterplot of the T-to-C transition per gene for the two DND1 4SU-PAR-CLIP replicates from FH-DND1 expressing HEK293 cells. Spearman correlation is indicated. Middle panel: Scatterplot relating mRNA expression levels in FH-DND1 HEK293 cells with T-to-C transitions per mRNA for the intersected DND1 4SU-PAR-CLIP experiments from (a). Right panel: Scatterplot relating transcript length with T-to-C transitions per mRNA for the intersected DND1 4SU-PAR-CLIP experiments from (a). b, Left panel: Genomic overlap of 3′ UTR clusters derived from the two DND1 PAR-CLIP replicates in (a). Right panel: Overlap of bound transcripts of the two DND1 PAR-CLIP replicates in (a). c, Immunofluorescence staining of the FLAG-epitope in HEK293 cells inducibly expressing FH-DND1. d, Count of the DND1 binding motif in the intersected DND1 4SU PAR-CLIP. Note that multiple motifs can be found in a cluster. e, Overlap of DND1 binding sites with those of other AU-rich element binding, ELAVL1/HuR56 (top panel) and ZFP36/TTP (bottom panel). f, Scatterplot of T-to-C transitions per gene for DND1 PAR-CLIP and ELAVL1 PAR-CLIP (left panel) or ZFP36 PAR-CLIP (right panel). Spearman correlation coefficient is indicated. g, mRNA expression changes upon transgene induction in FH-DND1 HEK293 cells were determined by RNA-seq. The empirical cumulative distribution function (CDF) of DND1 PAR-CLIP targets binned according to presence of DND1 binding sites exclusively in the 3′ UTR (red line) or exclusively in the CDS (orange line), as well as mRNA targets with binding sites in both CDS and 3′ UTR (purple line), and compared to expressed non-targets (FPKM≥5, black line). h, Normalized density of DND1 PAR-CLIP binding sites over the 3′ UTR, CDS, 5′ UTR and introns (red lines) compared to a randomized background (grey lines). DND1 binding sites were enriched within 100 nt of the cleavage and polyadenylation site. i, mRNAs bound within 100 nt of the mRNA polyA tail were only slightly more destabilized than those bound elsewhere in the 3′ UTR. mRNA expression changes upon transgene induction in FH-DND1 HEK293 cells were determined by RNA-seq. The empirical cumulative distribution function (CDF) of DND1 PAR-CLIP targets binned according to presence of DND1 binding sites within this window (red line) or >100 nt distance of the mRNA polyA-tail (orange line) and compared to expressed non-targets (FPKM ≥5, black line). Coordinates of the polyA tails found in 5 out of 7 3′ end sequencing experiments in HEK293 cells obtained from http://polyasite.unibas.ch were used. The median transcript abundance change is indicated by a dot on the x-axis. p-values were determined by the MWU test. j, Transcriptional inhibition by actinomycin D did not change the DND1-mediated reduction of target mRNA levels. mRNA expression changes in FH-DND1 HEK293 cells (+/- Dox) were compared to expression changes in FH-DND1 HEK293 cells (+/- Dox) after inhibition of transcription with Actinomycin D for 4 h. DND1 targets and non-targets were binned as in Fig. 1e.
Extended Data Figure 3. DND1 interaction with CCR4-NOT is required for target mRNA repression.
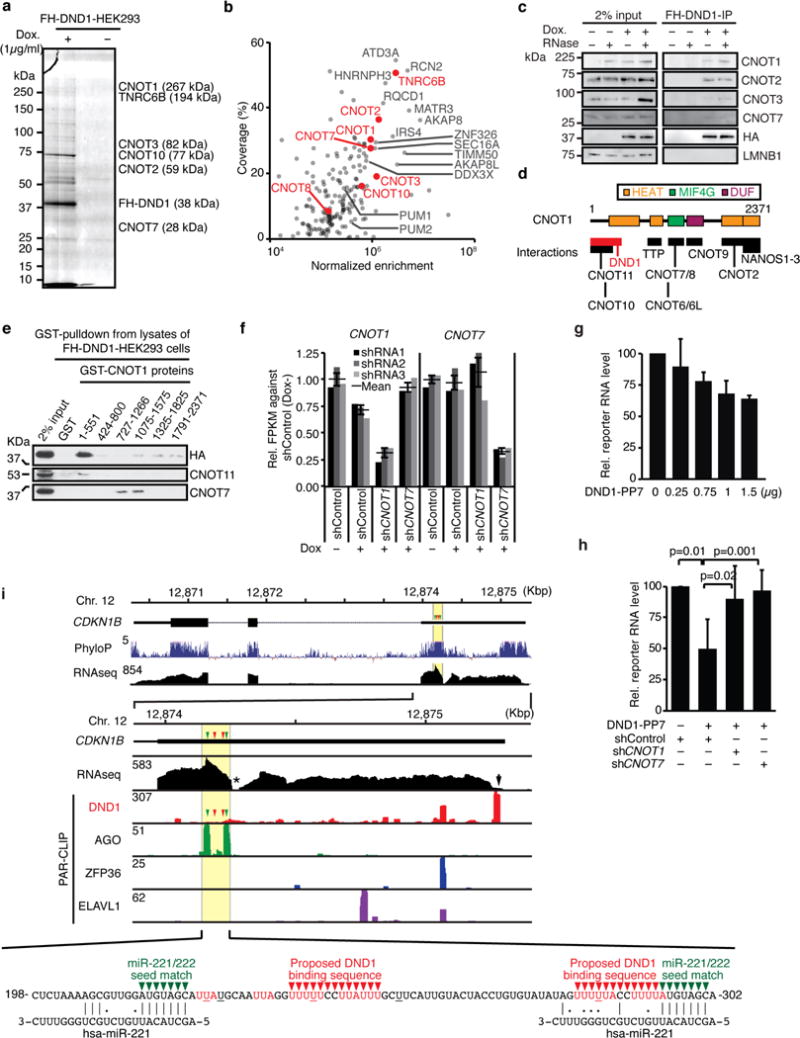
a, Colloidal Blue staining of SDS-PAGE fractionating an RNase-treated anti-FLAG immunoprecipitate (IP) from lysates of HEK293 cells uninduced (−) or induced (+) to express FH-DND1. A selection of the enriched protein components of the CCR4/NOT-complex co-immunoprecipitated identified by mass spectrometry and their mass are shown. b, Scatterplot of % coverage and enrichment of signal intensity for FH-DND1 IP calculated against FLAG immunoprecipitate from uninduced HEK293 cells for proteins identified by mass spectrometry. For a complete list of identified proteins, see Supplementary Table 2. c, Immunoblot probed for the indicated proteins after FLAG-immunoprecipitation (IP) from lysates of FH-DND1-HEK293 cells with and without FH-DND1 induction by Doxycycline or RNase A/T1 treatment. d, Scheme of known interactions of CNOT129,36. e, Immunoblot probed for the indicated proteins after GST-pulldown of recombinant GST-CNOT1 proteins (Fig. 2c) from lysates of FH-DND1 HEK293 cells with RNase A treatment. f, mRNA expression levels determined by RNA-seq in HEK293 cells uninduced (−) or induced (+) to express FH-DND1 after transfection of shRNA-expression plasmids. Three independent shRNA sequences were used as replicates. The relative expression levels of CNOT1 and CNOT7 are shown, as well as the mean value (black line) and standard error (SEM, error bars). g, The indicated amounts of plasmids encoding DND1-PP7 fusion protein and β-globin mRNA containing 4× PP7 hairpin loops in its 3′ UTR were co-transfected into HEK293 cells. β-globin reporter expression was quantified by qRT-PCR. Mean of relative expression levels of reporter mRNA (four replicates) were shown. Error bars, standard deviation (SD); p-values, Student’s t-test. h, β-globin reporter expression was quantified after knockdown of CNOT1 and CNOT7. The indicated shRNA plasmids were transfected 72 h prior to co-transfection of indicated reporter and shRNA plasmids to ensure depletion of CNOT proteins upon reporter expression. Mean of relative expression levels of reporter mRNA (four replicates) are shown. Error bars, SD; p-values, Student’s t-test. i, Top panel: Gene structure of the CDKN1B gene and phyloP conservation score. Central panel: Alignment of DND1 (red), AGO1-4 (green), ZFP36 (blue), and ELAVL1 (purple) PAR-CLIP sequence reads to the 3′ UTR of the CDKN1B mRNA. The RNA-seq coverage is shown in black and the PhyloP conservation score is shown in dark blue. Note that the conservation of RNA sequences in the area mutated by Kedde et al. (yellow highlight)8 is significantly higher than the mean conservation of the open reading frame (top panel). miR-221/AGO and DND1 target sites in the 3′ UTR are indicated by green and red arrowheads, respectively. Bottom panel: RNA sequence of the region studied by Kedde et al.8 aligned with miR-221 sequences. DND1 PAR-CLIP binding motifs are shown in red character. The nucleotides with frequent crosslinking (≥20%) are underlined in black or red. A G-rich sequence and the polyA-signal (AAUAAA), presumably causing insufficient RNA-seq coverage, are indicated with an asterisk and black arrow, respectively.
Extended Data Figure 4. Pathway analysis of the top DND1 targets.
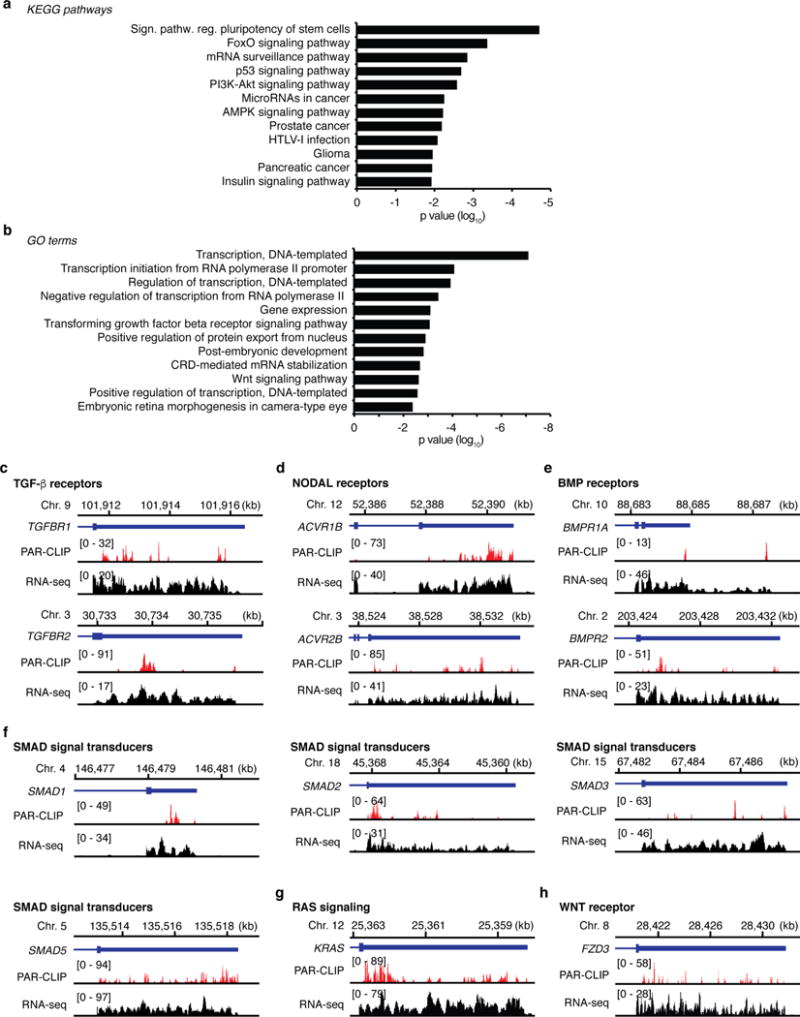
KEGG pathway (a) and GO (b) analyses of the top 300 DND1 targets according to the number of clusters in the 3′ UTR. Top 12 KEGG pathways and GO terms ranked by p-value are shown (Supplementary Table 3). c-h, Genome browser tracks showing 3′ end portions of representative targets genes involving the KEGG pathway “Signalling pathways regulating pluripotency of stem cells”. The coverage track from HEK293 and the mapped sequence read from the intersection of the replicates of the FH-DND1 PAR-CLIP experiments are shown. The selected genes were categorized according to the known functions: c, TGF-β receptors; d, NODAL receptors; e, BMP receptors; f, SMAD signal transducers; g, RAS signalling; h, WNT receptor.
Extended Data Figure 5. PAR-CLIP in mouse SNL cells shows conservation of DND1 targeting.
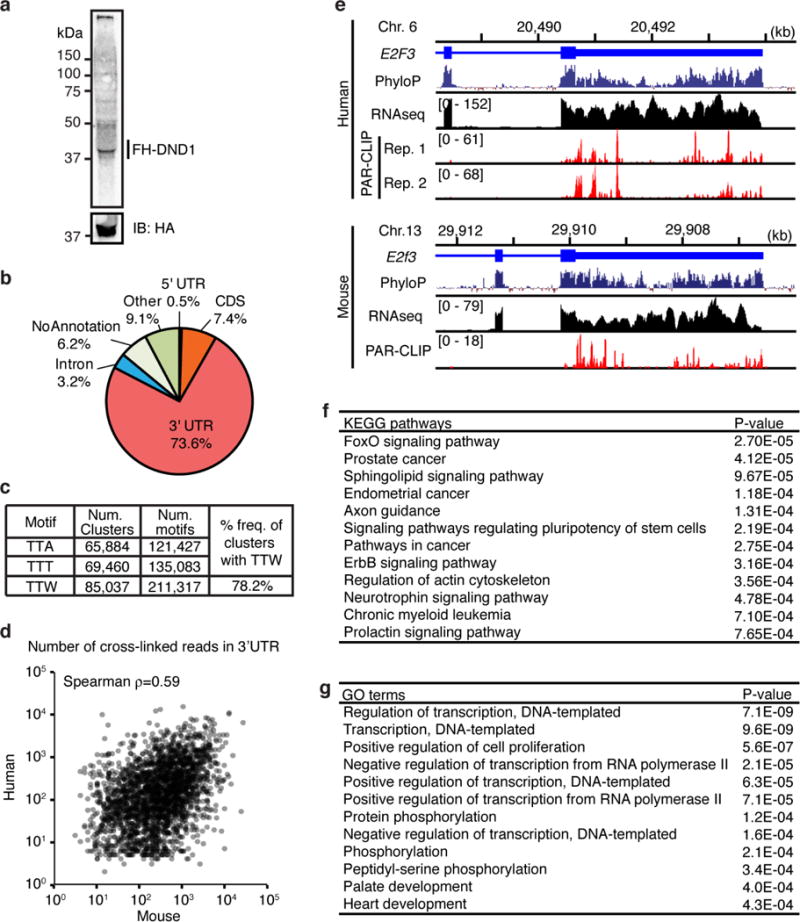
a, Autoradiograph of crosslinked, 32P-labelled, RNA-FH-DND1 immunoprecipitate separated by SDS-PAGE after 4SU PAR-CLIP in MEFs. b, Distribution of crosslinked sequence reads across annotation categories. We detected a total of 108,705 sites, of which 78% were mapped to 9,697 mRNAs, predominantly in exonic sequences. c, Occurrence of the TT[T/A] RRE in the 108,705 binding sites (Supplementary Table 4). d, Scatterplot comparing number of T-to-C transitions in the 3′ UTR of target mRNAs from DND1 PAR-CLIP in HEK293 cells and their mouse homologs from PAR-CLIP in mouse FH-DND1 expressing murine SNL cells. e, Genome browser tracks showing portions of the human E2F3 (top panel) and its mouse homolog E2f3 (bottom panel). The conservation tracks (PhyloP), the coverage track from HEK293 and mouse ESC RNA-seq, and the mapped sequence read from each replicate of the FH-DND1 PAR-CLIP experiments are shown. f-g, KEGG pathway (f) and GO (g) analyses of the top 300 DND1 targets from mouse PAR-CLIP according to the number of clusters in the 3′ UTR. Top 12 KEGG pathways and GO terms ranked by p-value are shown (Supplementary Table 3).
Extended Data Figure 6. Analysis of DND1 function in adult murine spermatogonia.
a, Hoechst profile of seminiferous tubular cells visualized in a “Hoechst Blue”/“Hoechst Red” contour plot. Numbers in parentheses indicate percentage of each population. Spermatogenic cells show heterogeneous morphologies, intracellular complexities, and DNA contents reflecting meiotic cell cycle. Spg, spermatogonia; PreL, preleptotene spermatocytes; L-Z, leptotene-zygotene spermatocytes; P-D, pachytene-diplotene spermatocytes; MII, meiosis II spermatocytes; RS, round spermatids. Further analysis of the Spg fraction is presented in Fig. 3. b, DNA content of the gated spermatogenic cells in (a) reveals successful separation of developing spermatogenic cells. c, Histogram of EPCAM+ spermatogonia in Spg population is shown in lower panel. The upper panel represents unstained control from the same cell suspension. d, t-SNE analysis of single-cell RNA-seq experiments from sorted spermatogonia (Spg from (a)) reveals specific clusters representing the indicated cell types. Abbreviations: Spg, spermatogonia; RS, round spermatids; PMCs, peritubular myoid cells; MAPs, macrophages. e, Heatmap representation of the expression of indicated genes on the tSNE plot. Cell types from (c) were identified according to the expression levels of marker genes. In total, 187 cells were analysed, and 115 cells of these cells (61%) were determined as actual spermatogonia according to expressions of lineage marker genes including Dazl. Numbers of other cell populations were: RS, 16 cells; PMCs, 29 cells; MAP, 5 cells. f, Knockdown efficiency of four different Dnd1-shRNA constructs (red) and three different Cnot1- and Cnot7-shRNA constructs (blue and purple, respectively) compared to five control shRNAs (grey) assessed by RNA-seq. g, Appearance of GSCs four days after transduction with the indicated shRNA (bar, 50 μm). h, Appearance of GSCs transduced with the indicated shRNA, as well as with an empty (upper panel) and FH-Dnd1 cDNA construct (lower panel; bar, 50 μm). i, Representative FACS contour plots for shRNA-transduced GSCs with the signal intensity of Annexin V on the x-axis (log10 scale) and the forward scatter (FSC) on the y-axis. Annexin V-positive cells represent early apoptotic cells and are gated as P8 population (green). j, The mean % population in P8 in three replicates of shDnd1 and Control are shown with SEMs. p<0.03 (Student’s t-test). k, Scatterplot comparing the average FPKM value of GSCs treated with shDnd1 and control shRNAs. The numbers of two-fold up- or down-regulated genes with p <0.05 are indicated in red or blue, respectively. l, Scatterplots comparing the mean FPKM value of (left panel) shCnot1 (three replicates) and (right panel) shCnot7 (three replicates) with control (five replicates). Transcripts are coloured according to q-value of transcript abundance change. m, CDF of transcript abundance changes between GSCs treated with shDnd1 and control shRNAs. Black line represents transcripts not targeted by DND1 and the red line represents targets classified as positive regulators of apoptosis according to GO (GO:0043065). The median transcript abundance change is indicated by a dot on the x-axis. p-values were determined by the MWU test. n, Proliferation of shRNA-transduced GSCs. The cumulative numbers of shControl-, shDnd1, or shCnot1-transduced GSCs were shown in black, red, or blue coloured dots, respectively. shRNAs were transduced by using lentiviral (LV) vectors at d0. 25 ng/ml puromycin was added at d2 to the culture medium to select stable transformants. o, Scatterplot similar to Fig. 3g–h of the log2 of transcript abundance changes of shCnot1/Control and shCnot7/Control. Pearson’s correlation coefficient is indicated. Transcripts are coloured according to the log2 of transcript abundance change of shDnd1/Control.
Extended Data Figure 7. DND1 target mRNAs are silenced in developing PGC and Cas9-mediated gene knockout of Dnd1 in murine ESCs.
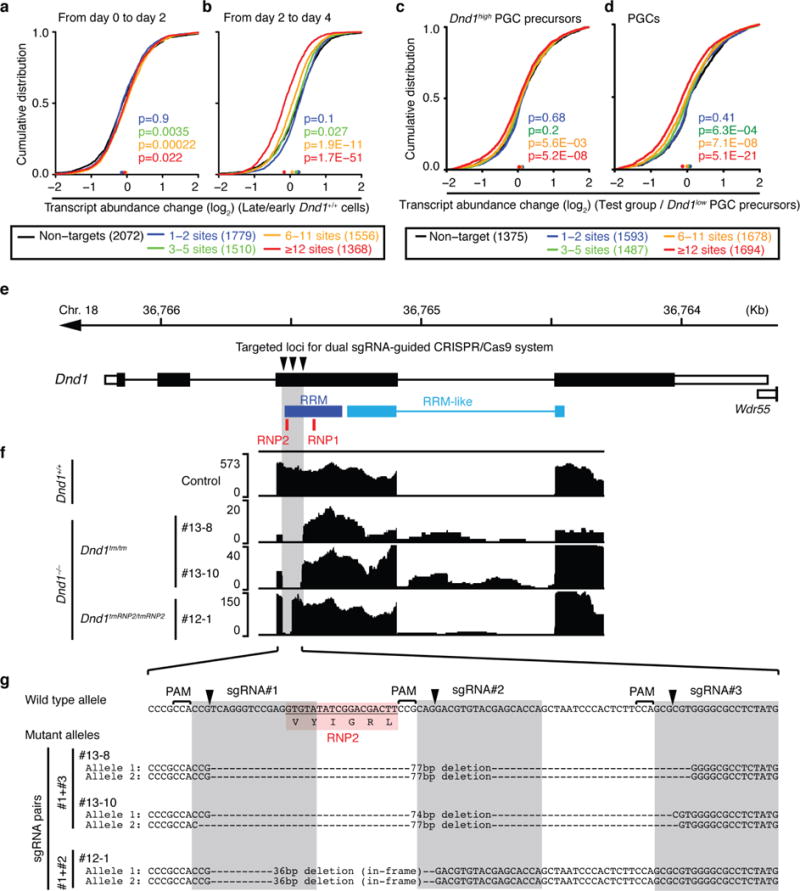
a–b, mRNA-expression change between (a) d0 and d2 PGCLC and (b) d2 and d4 PGCLC induced from EpiLCs was determined by RNA-seq (Supplementary Table 6). Expressed mouse DND1 PAR-CLIP target mRNAs (FPKM>5) were binned according to the number of binding sites (colored lines) and compared to expressed non-targets (FPKM>5, black line). The empirical cumulative distribution function (CDF) was plotted. The median transcript abundance change is indicated by a dot on the x-axis. p-values were determined by the MWU test. c, mRNA abundance change between Dnd1high- and Dnd1low-PGC-precurcors at E6.5–6.75 (n=6 each) was determined previously by single cell microarray analysis (Supplementary Tables 7 and 9). Expressed mouse DND1 PAR-CLIP target mRNAs (log2 array signal intensity >8) were binned and compared to expressed non-targets (log2 array signal intensity >8, black line) and the cumulative distribution function plotted as described in (a). d, Same as (c), except mRNA abundance change in specified PGCs at E7.25 (n=8) compared to Dnd1low-PGC precursor cells (n=6) was shown. e, Genome browser track showing the gene structure of Dnd1 on mouse chromosome 18. The bottom track indicates the regions encoding the RNA binding domain of DND1. RNP1 and RNP2 motifs contacting RNA (Extended Data Fig. 2). f, RNA-seq tracks for the same region as (a) showing the deletions induced by the sgRNAs for three different clones. g, Sanger DNA sequencing of the indicated region confirms successful deletions by the sgRNAs predicting to cut at the indicated positions. #13-8 and -10 showed targeted deletion of RNP2 associated with frame shift, resulting in the generation of null mutations in both alleles (Dnd1tm/tm). #12-1 has in-frame deletions for loss-of-RNP2 (Dnd1tmRNP2/tmRNP2). There was no distinguishable phenotype between these mutant mice in the germline development (Extended Data Fig. 8 and data not shown) and thus, we combined data from these three lines referred to as Dnd1−/−.
Extended Data Figure 8. Characterization of of Dnd−/− ESCs and induced PGCLCs.

a, Scheme of blastocyst injection protocol to generate chimeric mouse embryos for the analysis of the developmental potential of Dnd−/− ESCs. b, Injected ESCs successfully form chimeric mouse embryos. c, Analysis of the PGCs from chimeric E12.5 embryos. DDX4 served as marker for germ cells and mCherry marked cells derived from injected ESCs. Only Dnd+/+ ESCs were able to give rise to DDX4-positive PGCs. d, Representative FACS plots comparing the ITGB3-positive PGCLC fraction after four days of induction from Dnd+/+ (left panel) or Dnd−/− EpiLCs (right panel). e, Quantification of relative induction efficiency of PGCLCs from Dnd+/+ or Dnd−/− EpiLCs. f, Scatterplot of gene expression levels comparing Dnd1−/− and Dnd1+/+ cells at d0 (left panel), d2 (middle panel), and d4 (right panel) of the PGCLC induction time course. Transcripts are coloured by the q-value of transcript abundance change.
Extended Data Figure 9. Analysis of transcript abundance changes of specific transcript categories in Dnd1−/− PGCLCs.
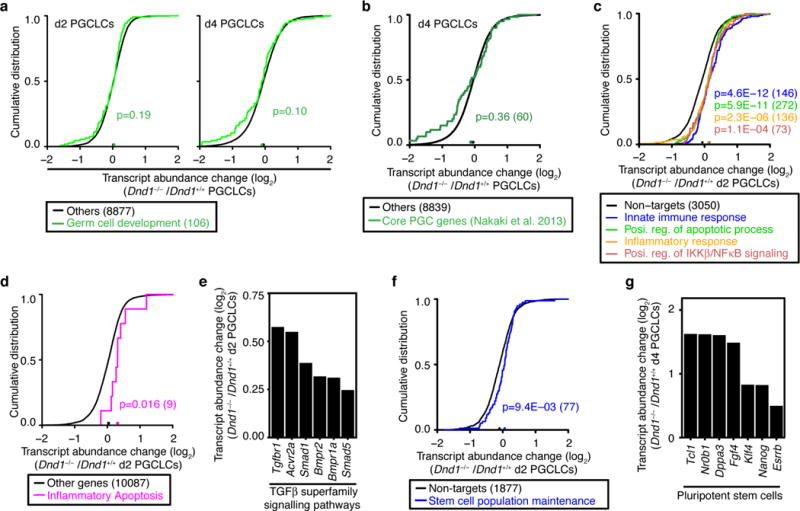
a, CDF of transcript abundance changes between Dnd1+/+ and Dnd1−/− PGCLCs at between d2 (left) and d4 (right). The green lines represent DND1 targets classified as GO category, germ cell development (GO:0007281), and the black line represents all the other genes. The median transcript abundance change is indicated by a dot on the x-axis. p-values were determined by the MWU test. b, CDF of transcript abundance change between d4 Dnd1+/+ and Dnd1−/− PGCLCs. The green line represents the genes defined as Core PGC genes (Nakaki et al. Nature 2013), and the black line represents all the other genes. The median transcript abundance change is indicated by a dot on the x-axis. p-values were determined by the MWU test. c, CDF of transcript abundance changes between d2 Dnd+/+ and Dnd−/− PGCLC. Black line represents transcripts not targeted by DND1 and the coloured lines represent DND1 targets classified according to the indicated GO categories (Innate immune response, 0045087; Positive regulation of apoptotic process, 0043065; Inflammatory response, 0006954; Positive regulation of IKKβ/NFκB signalling 0043123). The median transcript abundance change is indicated by a dot on the x-axis. p-values were determined by the MWU test. d, CDF of transcript abundance changes between d2 Dnd+/+ and Dnd−/− PGCLC. The purple line represent transcripts classified as mediators of inflammatory apoptosis (GO:0006925), regardless of DND1 binding. The black line represents all the other genes. The median transcript abundance change is indicated by a dot on the x-axis. p-values were determined by the MWU test. e, Transcript abundance change of representative genes involved in TGF-β superfamily signalling pathways (Extended Data Fig. 8,9). f, CDF of transcript abundance changes between d2 Dnd+/+ and Dnd−/− PGCLC. Black line represents transcripts not targeted by DND1 and the blue line represent DND1 targets classified as genes involved in stem cell population maintenance by GO (GO:0019827). The median transcript abundance change is indicated by a dot on the x-axis. p-values were determined by the MWU test. g, Transcript abundance change of representative pluripotency genes.
Supplementary Material
Acknowledgments
The authors acknowledge expert support by the members of the Rockefeller University resource centers (C. Zhao, Genomics; H. Molina, Proteomics; S. Mazel, Flow Cytometry; A. North, Bio-imaging; R Norinsky, Chimera assay) and of the NIAMS Genomics Core (G. Gutierrez-Cruz and S. Dell’Orso). We also thank M. Morita (McGill University, Montréal, Canada) for critical discussions on biochemical analysis, K. Hayashi (Kyusyu University, Japan) and Y. Saito (Rockefeller University) for technical guidance regarding PGCLC induction, and N. Mukherjee (Max-Delbrück Centrum for Molecular Medicine, Berlin, Germany) for bioinformatic tools, E. Macosko, M. Goldman, and S. McCarroll for advice to establish DropSeq, and S. Yamada and S. Keeney (Memorial Sloan Kettering Cancer Center, New York, NY) for technical guidance regarding spermatogenic cell sorting. The GST-CNOT constructs were provided by N. Sonenberg (McGill University, Montréal, Canada). pCMV-PP7 and β-globin-4×PP7-hairpin reporter plasmid were provided by D.R. Larson and M. Palangat (National Cancer Institute/NIH) and J.R. Hogg (National Heart, Lung, and Blood Institute/NIH), respectively. T.T. is an HHMI investigator. The study was supported, in part, by the Starr Cancer Foundation (T.T.), the Starr Foundation (T.T., Ma.Y.: TRI-SCI 2014-036; R.G.R.: TRI-SCI), NCI (R.G.R.), NCATS/NIH/CTSA, the Vilcek Foundation (Ma.Y.; UL1 TR000043), DAAD (C.M.), and NIH TRA (T.T.; R01CA159227). The Intramural Research Program of NIAMS/NIH supports S.M., H.L.M., and M.H. Ma.Y. was a recipient of a JSPS Research Fellowship.
Footnotes
Author Contributions
Ma.Y. and M.H. conceived the study, together with T.T. Ma.Y. performed all mouse experiments with help of Mi.Y. M.H. performed PAR-CLIP, IP-MS, and tethering reporter assays in human cell lines with help of P.M., S.M. and H.L.M. Ma.Y. conducted all knockdown and knockout experiments and corresponding RNA-seq analysis with support of M.H. C.M. collected IHC images in human cells and performed PAR-CLIP experiment and analysis in mouse cells assisted by A.G. R.G.R. and M.J. designed and performed the CNOT pulldown experiments together with Ma.Y. H.S., E.D., and Ma.Y. performed Drop-seq and analysed data. M.H. analysed all data together with M.Y. M.Y., M.H., and T.T. wrote the manuscript.
References
- 1.Youngren KK, et al. The Ter mutation in the dead end gene causes germ cell loss and testicular germ cell tumours. Nature. 2005;435:360–364. doi: 10.1038/nature03595. [DOI] [PMC free article] [PubMed] [Google Scholar]
- 2.Northrup E, et al. The ter mutation in the rat Dnd1 gene initiates gonadal teratomas and infertility in both genders. PLoS ONE. 2012;7:e38001. doi: 10.1371/journal.pone.0038001. [DOI] [PMC free article] [PubMed] [Google Scholar]
- 3.Cook MS, Coveney D, Batchvarov I, Nadeau JH, Capel B. BAX-mediated cell death affects early germ cell loss and incidence of testicular teratomas in Dnd1(Ter/Ter) mice. Dev Biol. 2009;328:377–383. doi: 10.1016/j.ydbio.2009.01.041. [DOI] [PMC free article] [PubMed] [Google Scholar]
- 4.Noguchi T, Noguchi M. A recessive mutation (ter) causing germ cell deficiency and a high incidence of congenital testicular teratomas in 129/Sv-ter mice. J Natl Cancer Inst. 1985;75:385–392. [PubMed] [Google Scholar]
- 5.Sakurai T, Iguchi T, Moriwaki K, Noguchi M. The ter mutation first causes primordial germ cell deficiency in ter/ter mouse embryos at 8 days of gestation. Dev Growth Differ. 1995;37:293–302. doi: 10.1046/j.1440-169X.1995.t01-2-00007.x. [DOI] [PubMed] [Google Scholar]
- 6.Saitou M, Yamaji M. Primordial germ cells in mice. Cold Spring Harb Perspect Biol. 2012;4:a008375. doi: 10.1101/cshperspect.a008375. [DOI] [PMC free article] [PubMed] [Google Scholar]
- 7.Yabuta Y, Kurimoto K, Ohinata Y, Seki Y, Saitou M. Gene expression dynamics during germline specification in mice identified by quantitative single-cell gene expression profiling. Biol Reproduction. 2006;75:705–716. doi: 10.1095/biolreprod.106.053686. [DOI] [PubMed] [Google Scholar]
- 8.Kedde M, et al. RNA-binding protein Dnd1 inhibits microRNA access to target mRNA. Cell. 2007;131:1273–1286. doi: 10.1016/j.cell.2007.11.034. [DOI] [PubMed] [Google Scholar]
- 9.Suzuki A, et al. Dead end1 is an essential partner of NANOS2 for selective binding of target RNAs in male germ cell development. EMBO Rep. 2016;17:37–46. doi: 10.15252/embr.201540828. [DOI] [PMC free article] [PubMed] [Google Scholar]
- 10.Kanatsu-Shinohara M, et al. Long-term proliferation in culture and germline transmission of mouse male germline stem cells. Biol Reproduction. 2003;69:612–616. doi: 10.1095/biolreprod.103.017012. [DOI] [PubMed] [Google Scholar]
- 11.Hafner M, et al. Transcriptome-wide identification of RNA-binding protein and microRNA target sites by PAR-CLIP. Cell. 2010;141:129–141. doi: 10.1016/j.cell.2010.03.009. [DOI] [PMC free article] [PubMed] [Google Scholar]
- 12.Corcoran DL, et al. PARalyzer: definition of RNA binding sites from PAR-CLIP short-read sequence data. 2011;12:R79. doi: 10.1186/gb-2011-12-8-r79. [DOI] [PMC free article] [PubMed] [Google Scholar]
- 13.Barreau C, Paillard L, Osborne HB. AU-rich elements and associated factors: are there unifying principles? Nucleic Acids Res. 2005;33:7138–7150. doi: 10.1093/nar/gki1012. [DOI] [PMC free article] [PubMed] [Google Scholar]
- 14.Spiller CM, et al. Endogenous Nodal signaling regulates germ cell potency during mammalian testis development. Development. 2012;139:4123–4132. doi: 10.1242/dev.083006. [DOI] [PubMed] [Google Scholar]
- 15.Macosko EZ, et al. Highly parallel genome-wide expression profiling of individual cells using nanoliter droplets. Cell. 2015;161:1202–1214. doi: 10.1016/j.cell.2015.05.002. [DOI] [PMC free article] [PubMed] [Google Scholar]
- 16.van der Maaten L, Hinton G. Visualizing data using t-SNE. J Mach Learn Res. 2008;9:2579–2605. [Google Scholar]
- 17.Kurimoto K, et al. Quantitative dynamics of chromatin remodeling during germ cell specification from mouse embryonic stem cells. Cell Stem Cell. 2015;16:517–532. doi: 10.1016/j.stem.2015.03.002. [DOI] [PubMed] [Google Scholar]
- 18.Hayashi K, et al. Offspring from oocytes derived from in vitro primordial germ cell-like cells in mice. Science. 2012;338:971–975. doi: 10.1126/science.1226889. [DOI] [PubMed] [Google Scholar]
- 19.Kurimoto K, et al. Complex genome-wide transcription dynamics orchestrated by Blimp1 for the specification of the germ cell lineage in mice. Genes Dev. 2008;22:1617–1635. doi: 10.1101/gad.1649908. [DOI] [PMC free article] [PubMed] [Google Scholar]
- 20.Ebert MS, Sharp PA. Roles for microRNAs in conferring robustness to biological processes. Cell. 2012;149:515–524. doi: 10.1016/j.cell.2012.04.005. [DOI] [PMC free article] [PubMed] [Google Scholar]
- 21.Slanchev K, et al. Control of Dead end localization and activity–implications for the function of the protein in antagonizing miRNA function. Mech Dev. 2009;126:270–277. doi: 10.1016/j.mod.2008.10.006. [DOI] [PubMed] [Google Scholar]
- 22.Roers A, Hiller B, Hornung V. Recognition of Endogenous Nucleic Acids by the Innate Immune System. Immunity. 2016;44:739–754. doi: 10.1016/j.immuni.2016.04.002. [DOI] [PubMed] [Google Scholar]
- 23.Korkola JE, et al. Down-regulation of stem cell genes, including those in a 200-kb gene cluster at 12p13.31, is associated with in vivo differentiation of human male germ cell tumors. 2006;66:820–827. doi: 10.1158/0008-5472.CAN-05-2445. [DOI] [PubMed] [Google Scholar]
- 24.Gerstberger S, Hafner M, Tuschl T. A census of human RNA-binding proteins. Nat Rev Genet. 2014;15:829–845. doi: 10.1038/nrg3813. [DOI] [PMC free article] [PubMed] [Google Scholar]
- 25.Zhang P, et al. MIWI and piRNA-mediated cleavage of messenger RNAs in mouse testes. Cell Res. 2015;25:193–207. doi: 10.1038/cr.2015.4. [DOI] [PMC free article] [PubMed] [Google Scholar]
- 26.Reuter M, et al. Miwi catalysis is required for piRNA amplification-independent LINE1 transposon silencing. Nature. 2011;480:264–267. doi: 10.1038/nature10672. [DOI] [PubMed] [Google Scholar]
- 27.Collier B, Gorgoni B, Loveridge C, Cooke HJ, Gray NK. The DAZL family proteins are PABP-binding proteins that regulate translation in germ cells. EMBO J. 2005;24:2656–2666. doi: 10.1038/sj.emboj.7600738. [DOI] [PMC free article] [PubMed] [Google Scholar]
- 28.Suzuki A, Igarashi K, Aisaki KI, Kanno J, Saga Y. NANOS2 interacts with the CCR4-NOT deadenylation complex and leads to suppression of specific RNAs. Proc Natl Acad Sci USA. 2010;107:3594–3599. doi: 10.1073/pnas.0908664107. [DOI] [PMC free article] [PubMed] [Google Scholar]
- 29.Bhandari D, Raisch T, Weichenrieder O, Jonas S, Izaurralde E. Structural basis for the Nanos-mediated recruitment of the CCR4-NOT complex and translational repression. Genes Dev. 2014;28:888–901. doi: 10.1101/gad.237289.113. [DOI] [PMC free article] [PubMed] [Google Scholar]
- 30.Li C, Hung Wong W. Model-based analysis of oligonucleotide arrays: model validation, design issues and standard error application. Genome Biol. 2001;2 doi: 10.1186/gb-2001-2-8-research0032. RESEARCH0032. [DOI] [PMC free article] [PubMed] [Google Scholar]
- 31.Spitzer J, Landthaler M, Tuschl T. Rapid creation of stable mammalian cell lines for regulated expression of proteins using the Gateway® recombination cloning technology and Flp-In T-REx® lines. Meth Enzymol. 2013;529:99–124. doi: 10.1016/B978-0-12-418687-3.00008-2. [DOI] [PubMed] [Google Scholar]
- 32.Al-Zoghaibi F, et al. Bioinformatics and experimental derivation of an efficient hybrid 3′ untranslated region and use in expression active linear DNA with minimum poly(A) region. Gene. 2007;391:130–139. doi: 10.1016/j.gene.2006.12.013. [DOI] [PubMed] [Google Scholar]
- 33.Wiznerowicz M, Trono D. Conditional suppression of cellular genes: lentivirus vector-mediated drug-inducible RNA interference. J Virol. 2003;77:8957–8961. doi: 10.1128/JVI.77.16.8957-8961.2003. [DOI] [PMC free article] [PubMed] [Google Scholar]
- 34.Moffat J, et al. A lentiviral RNAi library for human and mouse genes applied to an arrayed viral high-content screen. Cell. 2006;124:1283–1298. doi: 10.1016/j.cell.2006.01.040. [DOI] [PubMed] [Google Scholar]
- 35.Sarbassov DD, Guertin DA, Ali SM, Sabatini DM. Phosphorylation and regulation of Akt/PKB by the rictor-mTOR complex. Science. 2005;307:1098–1101. doi: 10.1126/science.1106148. [DOI] [PubMed] [Google Scholar]
- 36.Fabian MR, et al. Structural basis for the recruitment of the human CCR4-NOT deadenylase complex by tristetraprolin. Nat Struct Mol Biol. 2013;20:735–739. doi: 10.1038/nsmb.2572. [DOI] [PMC free article] [PubMed] [Google Scholar]
- 37.Huang DW, Sherman BT, Lempicki RA. Systematic and integrative analysis of large gene lists using DAVID bioinformatics resources. Nat Protoc. 2009;4:44–57. doi: 10.1038/nprot.2008.211. [DOI] [PubMed] [Google Scholar]
- 38.Huang DW, Sherman BT, Lempicki RA. Bioinformatics enrichment tools: paths toward the comprehensive functional analysis of large gene lists. Nucleic Acids Res. 2009;37:1–13. doi: 10.1093/nar/gkn923. [DOI] [PMC free article] [PubMed] [Google Scholar]
- 39.Bailey TL. DREME: motif discovery in transcription factor ChIP-seq data. Bioinformatics. 2011;27:1653–1659. doi: 10.1093/bioinformatics/btr261. [DOI] [PMC free article] [PubMed] [Google Scholar]
- 40.Yamaji M, et al. PRDM14 ensures naive pluripotency through dual regulation of signaling and epigenetic pathways in mouse embryonic stem cells. Cell Stem Cell. 2013;12:368–382. doi: 10.1016/j.stem.2012.12.012. [DOI] [PubMed] [Google Scholar]
- 41.Ran FA, et al. Genome engineering using the CRISPR-Cas9 system. Nat Protoc. 2013;8:2281–2308. doi: 10.1038/nprot.2013.143. [DOI] [PMC free article] [PubMed] [Google Scholar]
- 42.Chen X, et al. Dual sgRNA-directed gene knockout using CRISPR/Cas9 technology in Caenorhabditis elegans. Sci Rep. 2014;4:7581. doi: 10.1038/srep07581. [DOI] [PMC free article] [PubMed] [Google Scholar]
- 43.Hayashi K, Ohta H, Kurimoto K, Aramaki S, Saitou M. Reconstitution of the mouse germ cell specification pathway in culture by pluripotent stem cells. Cell. 2011;146:519–532. doi: 10.1016/j.cell.2011.06.052. [DOI] [PubMed] [Google Scholar]
- 44.Bastos H, et al. Flow cytometric characterization of viable meiotic and postmeiotic cells by Hoechst 33342 in mouse spermatogenesis. Cytometry A. 2005;65:40–49. doi: 10.1002/cyto.a.20129. [DOI] [PubMed] [Google Scholar]
- 45.Satija R, Farrell JA, Gennert D, Schier AF, Regev A. Spatial reconstruction of single-cell gene expression data. Nat Biotechnol. 2015;33:495–502. doi: 10.1038/nbt.3192. [DOI] [PMC free article] [PubMed] [Google Scholar]
- 46.Rouya C, et al. Human DDX6 effects miRNA-mediated gene silencing via direct binding to CNOT1. RNA. 2014;20:1398–1409. doi: 10.1261/rna.045302.114. [DOI] [PMC free article] [PubMed] [Google Scholar]
- 47.Jishage M, et al. Transcriptional regulation by Pol II(G) involving mediator and competitive interactions of Gdown1 and TFIIF with Pol II. Mol Cell. 2012;45:51–63. doi: 10.1016/j.molcel.2011.12.014. [DOI] [PMC free article] [PubMed] [Google Scholar]
- 48.Goujon M, et al. A new bioinformatics analysis tools framework at EMBL-EBI. Nucleic Acids Res. 2010;38:W695–9. doi: 10.1093/nar/gkq313. [DOI] [PMC free article] [PubMed] [Google Scholar]
- 49.McWilliam H, et al. Analysis tool web services from the EMBL-EBI. Nucleic Acids Res. 2013;41:W597–600. doi: 10.1093/nar/gkt376. [DOI] [PMC free article] [PubMed] [Google Scholar]
- 50.Sievers F, et al. Fast, scalable generation of high-quality protein multiple sequence alignments using Clustal Omega. Mol Syst Biol. 2011;7:539–539. doi: 10.1038/msb.2011.75. [DOI] [PMC free article] [PubMed] [Google Scholar]
- 51.Letunic I, Doerks T, Bork P. SMART: recent updates, new developments and status in 2015. Nucleic Acids Res. 2015;43:D257–60. doi: 10.1093/nar/gku949. [DOI] [PMC free article] [PubMed] [Google Scholar]
- 52.Petersen B, Petersen TN, Andersen P, Nielsen M, Lundegaard C. A generic method for assignment of reliability scores applied to solvent accessibility predictions. BMC Struct Biol. 2009;9:51. doi: 10.1186/1472-6807-9-51. [DOI] [PMC free article] [PubMed] [Google Scholar]
- 53.Handa N, et al. Structural basis for recognition of the tra mRNA precursor by the Sex-lethal protein. Nature. 1999;398:579–585. doi: 10.1038/19242. [DOI] [PubMed] [Google Scholar]
- 54.Wang X, Tanaka Hall TM. Structural basis for recognition of AU-rich element RNA by the HuD protein. Nat Struct Biol. 2001;8:141–145. doi: 10.1038/84131. [DOI] [PubMed] [Google Scholar]
- 55.Kuwasako K, et al. Solution structure of the second RNA recognition motif (RRM) domain of murine T cell intracellular antigen-1 (TIA-1) and its RNA recognition mode. Biochemistry. 2008;47:6437–6450. doi: 10.1021/bi7024723. [DOI] [PubMed] [Google Scholar]
- 56.Mukherjee N, et al. Integrative regulatory mapping indicates that the RNA-binding protein HuR couples pre-mRNA processing and mRNA stability. Mol Cell. 2011;43:327–339. doi: 10.1016/j.molcel.2011.06.007. [DOI] [PMC free article] [PubMed] [Google Scholar]
Associated Data
This section collects any data citations, data availability statements, or supplementary materials included in this article.
Supplementary Materials
Data Availability Statement
PAR-CLIP sequencing data and RNA-seq data are available on the NCBI Short-Read Archive (SRA) under the accession number PRJNA352073. An external database for a full list of DND1 binding sites is available at https://rnaworld.rockefeller.edu/DND1/.