

Abstract
In Drosophila, just as in vertebrates, changes in external temperature are encoded by bidirectional opponent thermoreceptor cells: some cells are excited by warming and inhibited by cooling, whereas others are excited by cooling and inhibited by warming1,2. The central circuits that process these signals are not understood. In Drosophila, a specific brain region receives input from thermoreceptor cells2,3. Here we show that distinct genetically-identified projection neurons (PNs) in this brain region are excited by cooling, warming, or both. The PNs excited by cooling receive mainly feedforward excitation from cool thermoreceptors. In contrast, the PNs excited by warming (“warm-PNs”) receive both excitation from warm thermoreceptors and crossover inhibition from cool thermoreceptors via inhibitory interneurons. Notably, this crossover inhibition elicits warming-evoked excitation, because warming suppresses tonic activity in cool thermoreceptors. This in turn disinhibits warm-PNs and sums with feedforward excitation evoked by warming. Crossover inhibition could cancel non-thermal activity (noise) that is positively-correlated among warm and cool thermoreceptor cells, while reinforcing thermal activity which is anti-correlated. Our results show how central circuits can combine signals from bidirectional opponent neurons to construct sensitive and robust neural codes.
The simplest model of thermosensory processing is that warm thermoreceptor cells contribute only to the representation of warming, whereas cool cells contribute only to the representation of cooling (the “labeled line” hypothesis4,5). In support of this idea, ablating heat-activated thermoreceptor cells in the mouse abolishes behavioral responses to noxious warming but not cooling6. Similarly, in Drosophila, silencing warm-activated thermoreceptor cells attenuates behavioral responses to warming but not cooling; conversely, silencing cool-activated thermoreceptor cells attenuates behavioral responses to cooling but not warming2. An alternative model is that different thermoreceptor cells interact centrally, so that a single cell contributes to the representation of both cooling and warming4,5. This idea could explain perceptual phenomena like the thermal grill illusion, where interlaced warm and cool objects produce the perception of burning heat7.
We investigated these possibilities in the Drosophila thermosensory system. Peripheral thermoreceptor cells in Drosophila reside mainly in the antenna8–10, and are housed inside two structures termed the arista and the sacculus2,3. The arista contains three cells that are excited by warming and inhibited by cooling (“warm cells”), as well as three cells that are excited by cooling and inhibited by warming (“cool cells”). The sacculus contains additional cool cells. All these cells project to a region of the brain called the proximal antennal protocerebrum11. Recent studies have identified several genes involved in thermal transduction in the antenna2,3,10,12. Among these, the warm receptor Gr28b.d has a particularly specific expression pattern3,13, permitting genetic access to the warm cells in the arista.
In a visual screen of ~7000 Gal4 lines14, we identified several that label central neurons having dendrites in proximal antennal protocerebrum and axons projecting to higher brain regions. We call such cells thermosensory projection neurons (PNs). We used these Gal4 lines to drive GFP expression in small groups of PNs and performed in vivo whole-cell current-clamp recordings from these neurons. We included biocytin in the patch pipette to reconstruct the morphology of individual neurons.
Because peripheral thermoreceptor cells reside in the antenna, we generated a thermal stimulus by manipulating the temperature of a stream of solution flowing over the antenna while keeping the temperature of the brain constant (Extended Data Fig. 1). As a control, we confirmed that cutting the axons of peripheral thermoreceptor cells abolished responses in this brain region (see Online Methods). We used large temperature changes to robustly activate peripheral thermoreceptor cells (~10°C). These large temperature changes were delivered at two speeds: fast (~100 ms) and slow (~7 s). We also used small steps (<1°C over ~100 ms) to measure sensitivity near threshold. This panel of stimuli revealed four physiological types of PNs, each with a distinctive morphology (Extended Data Fig. 2).
First, two PN types were excited by cooling and inhibited by warming. One type showed strong adaptation to sustained temperature decreases (Figure 1a2; Extended Data Fig. 3). These PNs also responded better to fast cooling than to slow cooling. We term these “fast-cool-PNs”. Fast-cool-PNs were highly sensitive to small cooling steps (Figure 1a3). Fast-cool-PNs project to the lateral protocerebrum, a higher brain region that receives multimodal inputs15.
Figure 1. Projection neurons excited by cooling.

(a) Fast-cool-PNs.
(a1) In vivo recording from a fast-cool-PN. Stimuli are steps from ~24°C to ~13°C or ~34 °C.
(a2) Mean firing rate for the fast-cool-PNs, ± s.e.m. across experiments (n = 7–10 PNs per stimulus).
(a3)Sensitivity to small temperature steps: mean change in firing rate versus change in temperature, ± s.e.m. (n = 5).
(a4) Proposed circuit for fast-cool-PNs (see Supplementary Discussion regarding circuit diagrams).
(b) Slow-cool-PNs. Prolonged depolarization can elicit complex spikes (b1, inset, expanded 12-fold). (b2) n = 7–14; (b3) n = 7. In (b4), the smaller arrow represents a weaker connection.
By contrast, the second type of cool-PN showed little adaptation to large sustained temperature decreases (Figure 1b2; Extended Data Fig. 3). Moreover, slow and fast cooling elicited similar peak firing rates (Figure 1b2). We term these “slow-cool-PNs”. Slow-cool-PNs project to the mushroom body, a higher brain region involved in learning and memory16. Slow-cool-PNs were less sensitive than fast-cool-PNs to small cooling steps (Figure 1a3, b3). Thus, these two cool-PN types encode different features of cool stimuli (Supplementary Discussion).
These cool-PN types have dendrites that overlap with the axons of the cool thermoreceptor cells (Extended Data Fig. 4). Recall that there are two structures in the antenna that contain cool cells, the arista and sacculus. Clipping the arista largely eliminated the responses of fast-cool-PNs (Figure 1a2). By contrast, clipping the arista left the responses of slow-cool-PNs mainly intact, although it diminished the initial response to cooling, and it reduced tonic firing at room temperature (Figure 1b2). All responses in slow-cool-PNs were abolished by cutting the antennal nerve (data not shown). Together, these results suggest a simple wiring scheme: fast-cool-PNs receive input from the cool cells in the arista, whereas slow-cool-PNs receive input mainly from the cool cells in the sacculus, with a weaker input from cool cells in the arista.
The idea of a simple wiring scheme was reinforced by additional experiments on the cool-PNs. Namely, we observed only slight disinhibition in the cooling responses of cool-PNs when we bath-applied antagonists of inhibitory neurotransmitter receptors (Extended Data Fig. 5). Warming still suppressed the tonic activity of the cool-PNs when synaptic inhibition was blocked, implying that warming can inhibit these neurons by suppressing tonic excitation from cool thermoreceptor cells. Cool-PN responses were essentially unaltered by a functional null mutation in Gr28b.d, the warm receptor in the arista3 (Extended Data Fig. 5). Together, these results imply that the thermal responses of the cool-PNs are driven primarily by cool thermoreceptor cells, with little role for warm thermoreceptor cells (Figure 1a4, 1b4).
Unlike the representation of cooling, we found that the representation of warming is mediated by a relatively complex circuit. We identified one PN type that is excited by warming and inhibited by cooling (Figure 2a). These “warm-PNs” project to the lateral protocerebrum (Extended Data Fig. 2). Warm-PNs responded better to fast warming than to slow warming, and they showed adaptation to prolonged temperature increases (Figure 2b, Extended Data Fig. 3). Their responses were abolished by removing the arista (data not shown).
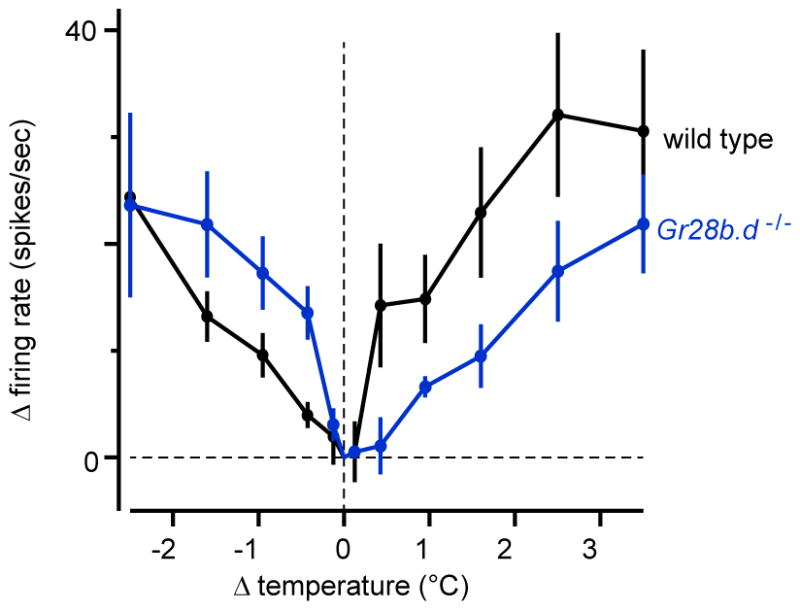
Figure 2. Projection neurons excited specifically by warming.

(a) A warm-PN. Cooling evokes a barrage of excitatory postsynaptic potentials (inset, expanded 4-fold).
(b) Mean firing rate for warm-PNs (n = 6–8).
(c) Mean firing rate with inhibition blocked using picrotoxin (an antagonist of GABA-A and GluCl receptors20,25) and CGP54626 (a GABA-B antagonist25) (n = 3–4). Spiking at cooling onset suggests excitation from the cool pathway. Spiking at cooling offset likely arises from the warm pathway and is normally masked by slowly-decaying cooling-evoked inhibition.
(d) Mean firing rate in the Gr28b.d mutant (n = 5–7). The response to slow warming was smaller than wild type, although this trend did not reach statistical significance (p = 0.20). Blocking inhibition eliminates the excitatory response to fast warming steps (n = 4).
(e) Mean firing rate in genetic background for histamine experiments, before injecting histamine (n = 7). A histamine-gated chloride channel is expressed in warm thermoreceptor cells.
(f) Injecting histamine to silence warm thermoreceptor cells significantly reduces responses to slow warming (n = 7, p < 0.05, paired t-test). Blocking inhibition eliminates warming-evoked excitation and unmasks cooling-evoked excitation (n = 6). See Extended Data Fig. 7 for controls.
(g) Sensitivity to small temperature steps (wild type n = 9; wild type with inhibition blocked n = 6; Gr28b.d mutant n = 5, Gr28b.d mutant with inhibition blocked n = 3). In wild type, blocking inhibition had no significant effect (unpaired t-tests, with iterative Bonferroni corrections; see Online Methods). However, responses were significantly smaller in the mutant near the threshold of warming-evoked excitation (+0.425 °C, p = 0.017).
(h) Proposed circuit for the warm-PNs.
Blocking synaptic inhibition depolarized warm-PNs (by 6 ± 1 mV, mean ± s.e.m.), suggesting these cells are subject to tonic inhibition. Notably, blocking synaptic inhibition also unmasked weak cooling-evoked excitation in warm-PNs (Figure 2c). This implies that these PNs receive input from both warm and cool thermoreceptor cells in the arista, and weak cooling-evoked excitation is normally masked by strong cooling-evoked inhibition. Moreover, although cooling hyperpolarizes these cells, it also elicits a barrage of excitatory postsynaptic potentials riding on the hyperpolarized membrane potential (Figure 2a, inset). This observation is further evidence that these cells receive excitatory input from cool thermoreceptor cells. Finally, we note that the dendrites of warm-PNs overlap with the axons of both warm and cool thermoreceptor cells (Extended Data Fig. 4), compatible with the idea that they receive input from both.
Surprisingly, mutating the warm receptor Gr28b.d did not abolish excitatory responses to warming in these PNs (Figure 2d). Indeed, responses to fast warming were almost unchanged. Interestingly, however, responses to slow warming were smaller than in wild type PNs. These results suggest that there are two pathways for generating warming-evoked excitation in these PNs. Gr28b.d is necessary for generating normal responses to slow warming, but fast warming recruits a second pathway independent of Gr28b.d (Supplementary Discussion).
Based on these results, we hypothesized the cool pathway can excite these neurons in response to warming, via disinhibition. This hypothesis is motivated by the observation that cool thermoreceptor cells are tonically active and their tonic activity is suppressed by warming2. An interposed inhibitory neuron could relay this tonic activity in the form of tonic inhibition, and warming would withdraw this inhibition. This hypothesis predicts that blocking synaptic inhibition will eliminate the second pathway. Indeed, we found that blocking inhibition abolished warming-evoked excitation in warm-PNs in the Gr28b.d mutant (Figure 2d). This result was not observed in a wild type background: in that case, blocking inhibition potentiated warming responses rather than eliminating them (Figure 2c). As an additional control, we confirmed that blocking inhibition had essentially no effect in the cool-PNs in the Gr28b.d mutant (Extended Data Fig. 5).
In principle, a mutation in the warm receptor Gr28b.d might cause the circuit to re-wire, or there might be other receptor molecules that could mediate responses in warm thermoreceptor cells when Gr28b.d is absent. To address these caveats, we acutely silenced the warm thermoreceptor cells themselves. We used the LexA system to selectively express a histamine-gated chloride channel (Ort) in warm thermoreceptor cells under the control of the Gr28b.d promoter (Extended Data Fig. 6). Neurons that mis-express Ort in this manner can be acutely silenced by histamine17. We first confirmed that simply expressing Ort in warm thermoreceptor cells did not substantially alter the responses of warm-PNs (Figure 2e). During these recordings, we then microiontophoresed histamine into the antenna to silence the warm thermoreceptor cells. PN responses to fast warming were largely intact, although responses to slow warming were significantly reduced (Figure 2f). Blocking inhibition nearly abolished warming-evoked excitation when the warm thermoreceptor cells were silenced (Figure 2f). Thus, this manipulation phenocopies the Gr28b.d mutant. These results further support a model whereby the cool pathway can cause warming-induced excitation, via disinhibition.
Small temperature steps (<1°C) yielded further insight into the two pathways which provide input to warm-PNs. Under normal conditions, warm-PNs were excited by small warming steps (Figure 2g). Blocking inhibition unmasked a response to small cooling steps (Figure 2g). Responses to small warming steps were still present in the Gr28b.d mutant, but – unlike responses to large warming steps – they were significantly reduced. Responses to small warming steps were eliminated in the mutant after inhibition was blocked (Figure 2g). These results bolster the conclusion that both the warm pathway and the cool pathway can drive excitatory responses in warm-PNs (Figure 2h). The warm pathway is most important when the rate of warming is low (~1°C per s, as in our “small” stimuli and “slow large” stimuli). The cool pathway becomes dominant when the rate of warming is high (~10°C over 100 ms).
The fourth and final projection neuron type we identified was excited by both cooling and warming (Figure 3a). These “warm-cool-PNs” project to the lateral protocerebrum (Extended Data Fig. 2). They responded to fast but not slow changes in temperature, and their responses to sustained stimuli were strongly adapting (Figure 3b, Extended Data Fig. 3). Thus, these neurons signal rapid temperature shifts, regardless of the direction of those shifts. Removing the arista eliminated all responses in these neurons (data not shown). Blocking inhibition depolarized these cells (by 8 ± 4 mV, mean ± s.e.m.) with modest effects on their thermal responses (Figure 3c).
Figure 3. Projection neurons excited by both warming and cooling.

(a) A warm-cool-PN. Fast warming and cooling elicit transient bursts of spikes (insets, expanded 7-fold). Stimulus offset does not elicit a response, probably because temperature is changing more slowly.
(b) Mean firing rate (n = 10–13).
(c) Mean firing rate with inhibition blocked (n = 3–5).
(d) Mean firing rate in the Gr28b.d mutant, before and after blocking inhibition (n = 7–11 and 4).
(e) Mean firing rate in genetic background for histamine experiments, before injecting histamine (n = 4). A histamine-gated chloride channel is expressed in warm thermoreceptor cells.
(f–g) Responses after injecting histamine to silence warm thermoreceptor cells (n = 4) and after blocking inhibition (n = 3). See Extended Data Fig. 7 for controls.
(h) Proposed circuit for the warm-cool-PNs.
Notably, warming-evoked excitation persisted in warm-cool-PNs neurons in the Gr28b.d mutant (Figure 3d, Extended Data Fig. 8), just as we observed in warm-PNs. As before, blocking synaptic inhibition abolished warming-evoked excitation in the Gr28b.d mutant (Figure 3d). Silencing thermoreceptor warm cells with histamine again phenocopied the Gr28b.d mutation (Figure 3e–g). These results imply that warming-evoked excitation in these cells arises from two sources: increased excitation from the warm pathway, and withdrawal of tonic inhibition from the cool pathway (Figure 3h). The dendrites of warm-cool-PNs overlap with the axons of both warm and cool receptor cells (Extended Data Fig. 4), compatible with the conclusion that they receive input from both.
These findings predict there are inhibitory neurons in this brain region that are tonically active, inhibited by warming, and excited by cooling. To test these predictions, we made recordings from inhibitory local neurons in this brain region. The main inhibitory neurotransmitters in the Drosophila brain are GABA and glutamate18–20, and so we labeled either GABAergic or glutamatergic neurons with GFP to target our electrodes these cells (Extended Data Fig. 9). In total, we recorded from 17 inhibitory neurons that arborized locally in this brain region and responded to thermal stimuli (Extended Data Fig. 2).
Most of the inhibitory local neurons (LNs) we recorded from (14 of 17) were tonically active at room temperature, inhibited by warming, and excited by cooling (Figure 4a-f). We term these “cool-LNs”. (The three remaining LNs had the opposite tuning profile; Extended Data Fig. 10.) Cool-LNs were found within both the GABAergic and glutamatergic populations.
Figure 4. Inhibitory local neurons responding to thermal stimuli.

(a) Recording from a GABAergic LN that is excited by cooling and inhibited by warming (a “cool-LN”).
(b) Trial-averaged responses.
(c) Sensitivity to small temperature steps. Neurotransmitter release from these neurons may be related to both membrane potential and firing rate.
(d–f) Same as above, but for a different GABAergic LN.
(g) Sensitivity to small temperature steps in thermoreceptor cells of the arista, measured as the change in GCaMP3 fluorescence. See also Extended Data Fig. 6.
(h) Sensitivity to small temperature steps, measured from the membrane potential of fast-cool-PNs, the more sensitive of the two cool-PN types. Each line represents a different experiment. The population of cool thermoreceptors must be at least this sensitive to warming.
Several features of PN responses are explained by a model where cool-LNs inhibit the warm-PNs and warm-cool-PNs. First, cooling excites these LNs, which could mask cooling-evoked excitation onto warm-PNs (and also attenuate cooling-evoked excitation in warm-cool-PNs), except when synaptic inhibition is blocked. Conversely, warming inhibits cool-LNs, which should disinhibit PNs, allowing them to become excited even when the warm receptor is mutated or warm thermoreceptor cells are silenced, but in a manner that depends on intact synaptic inhibition.
In sum, our results indicate an asymmetry in the central processing of warm versus cool stimuli. Cool-PNs are driven primarily by excitation from cool thermoreceptor cells. These simple circuits evoke the classic concept of the labeled line. By contrast, warm-PNs and warm-cool-PNs receive excitation from both the warm and cool pathway, as well as potent crossover inhibition from the cool pathway. This more complex arrangement is reminiscent of some circuits in the mammalian spinal cord (Supplementary Discussion).
Why might it be useful for warm-PNs and warm-cool-PNs to receive crossover inhibition from the cool pathway? This circuit motif may help cancel non-thermal activity (noise) that is correlated among warm and cool thermoreceptor cells. Correlated activity could arise from mechanical forces that bend the arista21, thereby deforming and potentially depolarizing both warm and cool cells22. Unlike the thermal responses of these cells, which are anti-correlated, correlated activity in warm and cool thermoreceptor cells would be canceled by crossover inhibition. Crossover inhibition might also increase sensitivity to small warming steps, because cool thermoreceptor cells are sensitive to warming, even though they are inhibited rather than excited by warming (Figure 4g,h). Interestingly, some insects lack warm receptor cells entirely and yet possess both cool-PNs and warm-PNs. It has been suggested that disinhibition might be the only source of warming-evoked excitation in the warm-PNs of these insects23,24. In mammals, many cool peripheral thermoreceptor cells are inhibited by warming, and warm peripheral thermoreceptor cells are inhibited by cooling1. Thus, the mammalian spinal cord might also use crossover inhibition, because each receptor type is informative about both warming and cooling.
ONLINE METHODS
Fly stocks
The genotypes used in each figure are as follows:
Figure 1a1,2,3,4: GMR95C02-Gal4,pJFRC2-10XUAS-IVS-mCD8::GFP
Figure 1b1,2,3,4: GMR49B06-Gal4,pJFRC2-10XUAS-IVS-mCD8::GFP and GMR67D03-Gal4,pJFRC2-10XUAS-IVS-mCD8::GFP.
Figure 2a–c: GMR95C02-Gal4,pJFRC2-10XUAS-IVS-mCD8::GFP
Figure 2d: Gr28bMB03888;GMR95C02-Gal4,pJFRC2-10XUAS-IVS-mCD8::GFP
Figure 2e–f: LexAOp-HA-Ort/Gr28b.d-LexA;GMR95C02-Gal4,pJFRC2-10XUAS-IVS-mCD8::GFP/+
Figure 2g: GMR95C02-Gal4,pJFRC2-10XUAS-IVS-mCD8::GFP (wild type) and Gr28bMB03888;GMR95C02-Gal4,pJFRC2-10XUAS-IVS-mCD8::GFP (Gr28b.d−/−)
Figure 3a–c: GMR54A03-Gal4,pJFRC2-10XUAS-IVS-mCD8::GFP
Figure 3d: Gr28bMB03888;GMR54A03-Gal4,pJFRC2-10XUAS-IVS-mCD8::GFP
Figure 3e–g: LexAOp-HA-Ort/Gr28b.d-LexA;GMR54A03-Gal4,pJFRC2-10XUAS-IVS-mCD8::GFP/+
Figure 4a–f: pJFRC7-/+;Gad1-Gal4/+
Figure 4g: 20XUAS-GCaMP3/+;Gr28b.d-Gal4/+ (warm cells) and 20XUAS-GCaMP3/+;;GMR79C04-Gal4/+ (cool cells)
Figure 4h: GMR95C02-Gal4,pJFRC2-10XUAS-IVS-mCD8::GFP
The Gal4 lines used to drive transgene expression in specific cell types are as follows:
GMR54A03-Gal4 – 1 warm-cool-PN
GMR49B06-Gal4 – 1 slow-cool-PN
GMR67D03-Gal4 – 1 slow-cool-PN (different from that labeled by 49B06)
GMR95C02-Gal4 – ~ 4 fast-cool-PN and 1 warm-PN
GMR52G03-Gal4 – ~ 3 glutamatergic LNs (see Extended Data Fig. 10)
GMR91H10-Gal4 – ~ 3 glutamatergic LNs (see Extended Data Fig. 10)
GMR79C04-Gal4 – 3 cool thermoreceptor cells in the arista
Gr28b.d-Gal4 – 3 warm thermoreceptor cells in the arista
Gad1-Gal4 – multiple GABAergic LNs
Flies (Drosophila melanogaster) were raised on standard cornmeal agar medium supplemented with rehydrated potato flakes on a 12 h light/dark cycle at 25°C. All experiments were performed on adult female flies between 6 hours and 2 days post-eclosion. The GMR Gal4 lines are described in Pfeiffer et al. (ref. 14) and were obtained from the Bloomington Drosophila Stock Center (BDRC). The GMR line that labels the warm-cool-PN (54A03) also stochastically labeled 1–2 additional nearby somata; we were not able to obtain recordings from these additional neurons due to weak and unreliable labeling. The GMR line that labels 3 cool thermoreceptor cells in the arista (79C04) was identified based on a visual screen for expression in the proximal antennal protocerebrum and was validated using GCaMP3 imaging of the arista (Figure 4i and Extended Data Fig. 6); it reliably drives expression of fluorescent reporter transgenes in only three cells in the arista, in contrast to a previously-identified line, NP4486-Gal4 (ref. 2), which can drive expression >3 cells in the arista on a stochastic basis (data not shown). Gr28b.d-Gal4 was first published in ref. 13. Gad1-Gal4 (line 2B) was constructed by Toshi Kitamoto using a Gad1 promoter fragment and was first published in ref. 26, where it was called “Gad2B-Gal4”. Gr28bMB03888 was reported in ref. 27, and also in ref. 3 (where it was termed the “Mi” allele); we obtained it from the BDRC. pJFRC2-10XUAS-IVS-mCD8::GFP (su(Hw)attP1) and 26XLexAop2-mCD8::GFP(attP2) were reported in ref. 28 and were obtained from the BDRC. 20XUAS-GCaMP3 (attP18) was reported in ref. 29 and obtained from the BDRC. pJFRC7-20XUAS-IVS-mCD8::GFP (attP40) was reported in 30; prior to that report, the same transgene was described in another insertion site28. UAS-nls:GFP was obtained from the BDRC. LexAOp-HA-Ort was a generous gift from Chi-Hon Lee.
Generation of transgenic flies
The Gr28b.d promoter fragment was PCR amplified from genomic DNA and assembled into the EcoRI/KpnI digested pBPnlsLexA::GADflUw vector (Addgene) using the Gibson Assembly Master Mix (NEB). The PCR primers used were 5′-GGCCCTTTCGTCTTCAAGAATTCGTCACCATGGCCCTGCACTTCACC-3′ and 5′-GGGTGGCATTTTGATTGCTAGCGGTACCTCAACGTATTTTTAAAATATTTATAGTATGTA-3′. The underlined regions indicate regions of overlap with the vector. Constructs were sequenced prior to injection into y,w;attP40 embryos. Genetic Services, Inc. provided transgenic production services. The expression patterns of transgenic flies were verified by crossing each LexA line to a GFP reporter and examining GFP expression in the arista and the proximal antennal protocerebrum (Extended Data Fig. 6).
The LexAOp-HA-Ort vector was constructed by inserting the 2xHA-ORT fragment from pUAST-2xHA-ORT (ref. 31) into the pLOT vector32, and injected in y,w embryos via P-element transformation.
Electrophysiological recordings
In vivo whole-cell patch clamp recordings from neural somata were performed under visual control using an upright compound microscope to direct the electrode to a GFP+ soma. The fly was restrained in a platform which allowed the brain and antennae to be bathed in saline while most of the fly remained dry. Recordings were performed essentially as previously described25, except for the following modifications detailed in ref. 20. The head was rotated 180° around the neck connective, so that the ventral side of the brain was facing upwards and therefore accessible to visualization via the water-immersion objective above the preparation. The fly remained alive throughout the experiment even when the head was rotated in this manner, as evidenced by continual spontaneous movements of the body, as well as normal brain activity. It was necessary to rotate the head because both the PNs and the LNs that innervate the proximal antennal protocerebrum have somata ventral to the antennal lobes, and so are inaccessible when the brain is dorsal-side up.
The brain was perfused in external saline containing (in mM): 103 NaCl, 3 KCl, 5 N-tris(hydroxymethyl) methyl-2-aminoethane-sulfonic acid, 8 trehalose, 10 glucose, 26 NaHCO3, 1 NaH2PO4, 1.5 CaCl2, and 4 MgCl2 (osmolarity adjusted to 270-275 mOsm). The saline was bubbled with 95% O2/5% CO2 to a pH of 7.3. The internal solution for patch-clamp pipettes were contained the following (in mM): 140 potassium aspartate, 10 HEPES, 1 EGTA, 4 MgATP, 0.5 Na3GTP, 1 KCl, and 13 biocytin hydrazide. The pH of the internal solution was adjusted to 7.2 and the osmolarity was adjusted to ~265 mOsm.
In initial experiments, we filled all recorded neurons with biocytin to visualize their morphology. Some of the lines we used in this study drive Gal4 expression in more than one neuron in the region where the somata of neurons arborizing in the posterior antennal protocerebrum are located (just ventral to the antennal lobe), but we found that each morphological type of neuron had characteristic electrophysiological properties and temperature responses, and so we could accurately identify each type within the relevant Gal4 line based on these characteristics alone. Hence in subsequent recordings, neurons were classified based on these criteria and not every cell was filled. However, PN recordings made in the Gr28b.d mutant background were always filled, and LNs were also always filled.
Recordings were performed with an Axopatch 200B amplifier (Axon Instruments). Recorded voltages were low-pass filtered at 5 kHz and digitized at 10 kHz. The seal conductance can create a small tonic depolarization in small neurons33 so in many experiments we injected a small amount of constant hyperpolarizing current to bring the cell back down to its native resting potential. We estimated the native resting potential of all these cell types to be ~-40 mV, based on measuring spontaneous spiking in cell-attached mode prior to rupturing the seal, and then matching the spontaneous spike rate in whole-cell mode33. Spontaneous spikes are typically not visible in cell-attached recordings from warm-PNs, and so we assumed a resting potential of ~-40 mV for these cells. In most experiments where a cell was depolarized as a result of blocking synaptic inhibition, we returned the cell to its original potential before measuring its responses to thermal stimuli, so as to avoid any confounding effects of depolarization per se. All reported membrane potential values are uncorrected for the liquid junction potential, which is −13 mV (ref. 33).
In some experiments, we used picrotoxin (100 μM) and CGP54626 (50 μM) to block synaptic inhibition midway through the experiment. These drugs were added to the saline perfusate. In most experiments where a cell was depolarized as a result of blocking synaptic inhibition, we returned the cell to its original potential before measuring its responses to thermal stimuli. This procedure minimized any confounding effects of depolarization per se. In warm-cool-PNs, blocking synaptic inhibition tended to induce oscillations in the membrane potential, and so small effects of this manipulation should be interpreted with caution.
LN recordings
Flies with Gad1-Gal4 driving pJFRC7-20XUAS-IVS-mCD8::GFP were analyzed with dual confocal immunofluorescence microscopy, using anti-CD8 and anti-GABA antibodies, as previously described25. We found that 90% of CD8::GFP+ cells in the cluster of cell bodies just ventral to the antennal lobe were also GABA+. Because we restricted our electrodes to cell bodies in that region, and we also filled each recorded cell with biocytin to verify that it innervated the proximal antennal protocerebrum, it is likely that almost all the LNs we recorded using this Gal4 line are GABAergic. In these experiments, around two-thirds of cells that we recorded from in the Gad1-Gal4 line did not respond to our thermal stimuli and were discarded; many of these are likely to represent antennal lobe PNs and LNs, based on the morphologies we observed when we filled a subset of these cells with biocytin. We used a similar procedure to target our electrodes to the glutamatergic LNs: flies with either GMR52G03-Gal4 or GMR91H10-Gal4 driving pJFRC2-10XUAS-IVS-mCD8::GFP were immunostained using anti-CD8 and anti-dVGluT antibodies, as previously described 20. We found that all the CD8::GFP+ cells in the cluster of cell bodies just ventral to the antennal lobe were dVGluT+. As before, we restricted our electrodes to cell bodies in that region, and we filled each recorded cell with biocytin to verify that it innervated the PAP.
Thermal stimulus delivery
Because all neurons are sensitive to temperature, and because temperature gradients between the recording and ground electrodes can produce electrical artifacts, we wanted to spatially restrict temperature changes to the peripheral thermoreceptor cells in the antenna to specifically study how peripheral signals are processed in the brain. Therefore, we designed a jet micro-thermode capable of delivering a fast temperature stimulus to a ~150 μm target (Extended Data Fig. 1). The thermode system consists of two components: a room-temperature, laminar flow saline perfusion chamber (Warner Instruments, RC-26GLP), and a probe that delivers a jet of temperature-controlled saline. The fly is placed at the center of the chamber and the probe is positioned ~100 μm from the ipsilateral antenna, oriented so that the jet of saline flows across both aristae and both antennae but not the rest of the fly. The tip of the arista is immobilized with UV glue. The laminar flow of the perfusion chamber ensures that the saline jet continues on past the antenna and out of the chamber without substantial mixing with the rest of the bath. The bath temperature was kept at 23–25° C. We verified that the baseline firing rate of all PN types adapted almost completely within a few minutes to temperature changes within this range. The hydrodynamics of the system were visualized by adding a solution of 500 μM phenol red to the saline jet. We adjusted the flow rates of the perfusion chamber and saline jet until no visible mixing occurred. Simultaneous thermocouple measurements (see below) were performed to ensure that the temperature of the bath near the brain remained stable when temperature stimuli were presented to the antenna. The intrinsically thermosensitive neurons of the brain12 would therefore be insensitive to our stimuli. As additional controls for the spatial specificity of our thermal stimuli, we verified that cutting the antennal nerves bilaterally abolished responses in all PN types. Additionally, removing the aristae bilaterally essentially eliminated all temperature responses in the fast-cool-PNs (see Figure 1a), and it completely eliminated the responses of the warm-PNs, warm-cool-PNs, and glutamatergic LNs (data not shown).
The jet was produced by sending saline from a reservoir (pressurized to ~5 psi) through a narrow tube that terminated in a 160 μm nozzle (Small Parts, 0.0063” ID polyimide tubing, TWPT-0063-30). Upstream of the nozzle, the tube passed through a heat exchanger made from two concentric pipes. The outer pipe was fed with a constant flow of water pumped in from a hot bath (~40° C) or a cold bath (~0° C). Water from only one of the baths flowed into the heat exchanger at a time. A system of three 3-way solenoid valves selected between hot mode and cold mode.
The heat exchanger was powerful enough to bring the saline jet (as measured at the antenna) to ~13° C in cold mode and ~34° C in hot mode. After switching modes, the jet temperature took ~7 s to plateau. During this slow transition, the valves could also stop flow entirely to the outer pipe (no-flow mode) when the heat exchanger was at room temperature (~24° C). By switching between these three modes, we could achieve slow temperature transitions between three different temperatures: ~13°, ~24°, and ~34° C. This method was the basis for our “slow cool” and “slow warm” stimuli.
Finally, a separate “fast” solenoid valve was installed in line with the pressurized saline tube. Opening and closing this “fast” valve turned the jet on or off. When the jet is turned off, the steady laminar flow of the bath quickly washes over the antenna, bringing it back to bath temperature (~24° C). Switching this valve allowed for fast (~100 ms) transitions between a hot (or cold) jet and the ~24° C bath. This method was the basis for our “fast cool” and “fast warm” stimuli.
To produce small temperature steps, the heat exchanger was heated to ~34° C, then cooled with ice so that the jet delivered saline that was only a few degrees warmer than the bath. We then gradually cooled the heat exchanger with ice while periodically opening and closing the “fast” valve to produce a fast jump at the antenna (within 100 ms) to a temperature just above 24° C. Over several minutes, the temperature in the heat exchanger progressively fell to 24° C, and then continued to fall. In this manner, we were able to finely sample a range of temperatures several degrees above and below 24° C. Because here the stimulus control was performed manually, we could not achieve precisely the same temperature stimuli in every experiment. We therefore recorded the temperature at the antenna in each stimulus trial and post hoc binned the data by temperature to construct the sensitivity plots showing average responses to small temperature steps. In the course of these experiments, we observed that central neurons did not respond when the jet temperature precisely equaled the bath temperature (to the limits of precision of our thermocouple), indicating that these neurons do not respond to any mechanical effects of the jet.
Temperature measurements
Temperature measurements at the location of the antenna were made using K-type thermocouples with a 75–100 μm tip (Omega Engineering, CHAL-001 thermocouple and SMPW-CC-K-M connector). One wire of the thermocouple was threaded into a microbore Teflon tube (Cole-Parmer, EW-06417-11) to provide mechanical rigidity and insulation between the two thermocouple wires. The thermocouple was mounted on a micromanipulator and its tip was positioned entirely within the saline jet, which included 500 μM phenol red for visualization. Thermocouple measurements were acquired and digitized at 99 Hz by a National Instruments USB-9213 Thermocouple Measurement Device. Temperature measurements displayed in the figures represent the mean of several experiments with the same commands to the stimulus device; because these measurements were highly consistent across experiments (generally within 1°C of the mean), we did not measure the temperature in every experimental replicate.
Histochemistry
In some experiments (noted above), the morphology of the recorded neuron was visualized after recording by incubating the brain with a fluorescent conjugate of streptavidin, as published previously34. Immunohistochemistry was performed as described previously25. Primary antibodies were obtained from the following sources (with dilutions in parentheses): mouse nc82 from the Developmental Studies Hybridoma Bank35 (nc82-s, 1:50), rat anti-CD8 from Invitrogen (MCD0800, 1:200), rabbit anti-GABA from Sigma25 (A2052, 1:200), rabbit anti-dVGluT (1:500; gift of Aaron DiAntonio, Washington University, St. Louis, ref. 19). Secondary antibodies (Invitrogen) were used at 1:250. To reconstruct neuronal morphology from biocytin fills, we hand-traced the skeletonized morphology using the Simple Neurite Tracer plugin in Fiji, using the Fill Out command to automatically generate a 3D volume, which we subsequently converted to a z-projection. The morphology of the slow-cool-PN has been described previously36.
Calcium imaging
Cool and warm cells were imaged in separate experiments. Widefield illumination was generated with a 100-W Hg arc lamp (Olympus) attenuated with a ND-25 neutral-density filter, band-pass filtered at 540–580 nm, and delivered to the specimen through a 40× water-immersion objective mounted in an upright compound microscope (Olympus BX51WIF). Phenol red was omitted from the saline jet during these experiments. Images were acquired using a sCMOS camera (Hamamatsu ORCA-Flash4.0 V2) with a 50-ms exposure time. Thermal stimuli were delivered in “fast” mode (i.e., with a rise time of 100 ms or less). Data was analyzed using custom MATLAB software. Calcium imaging confirmed that Gr28b.d-Gal4 drives expression in warm thermoreceptor cells in the arista, whereas GMR79C04-Gal4 drives expression in cool thermoreceptor cells in the arista (Extended Data Fig. 6).
Histamine iontophoresis
For histamine iontophoresis, a high-resistance sharp (~100 M) pulled glass micropipette was filled with a solution of 1M histamine dihydrochloride in saline. The pipette was inserted into the ipsilateral third antennal segment, and histamine was ejected using a 0.5-3 s pulse of positive current (300 nA) applied with an iontophoresis current generator (Model 260, World Precision Instruments) gated by a TTL pulse. Histamine ejection was initiated 4-5 s before the onset of the thermal stimulus. A constant negative backing current of 40 nA was applied to retain histamine in the pipette between ejections. These ejection parameters were chosen such that there was essentially no effect of histamine iontophoresis in control genotypes that lacked the LexA transgene (Extended Data Fig. 7), and the brief electrical artifact produced by the iontophoresis current pulse was small. Although some thermosensory PNs arborize bilaterally, in pilot experiments where we removed the contralateral antenna we observed no clear alteration in the thermal responses of these cells, and so we performed histamine iontophoresis only in the ipsilateral antenna. We chose to iontophorese histamine into the antenna in these experiments because in pilot studies we found that iontophoresing histamine into the brain had effects on the central neurons that did not depend on the LexAOp-HA-Ort transgene.
We also created a LexA line designed to specifically drive expression in the cool thermoreceptor cells by converting the GMR79C04-Gal4 line to a LexA line using established methods28, and we used this to drive expression of the histamine receptor in the cool thermoreceptor cells. However, when we attempted to silence the cool cells in this manner, we did not substantially alter the thermal responses of fast-cool-PNs, which clearly receive almost all their thermal input from the arista. The failure of this positive control is likely due to low transgene expression levels in the cool thermoreceptor cells, because GFP signals driven by this LexA line were also weak.
Data analysis
Reported numbers of replicates (n values) always represent numbers of cells recorded; in almost all cases, only one cell was recorded per brain. Error bars represent s.e.m. computed across cells (experiments). No formal statistical calculations were used to pre-determine sample sizes. Sample sizes were qualitatively governed by the observed cell-to-cell reliability in the measurements we performed in pilot experiments. Our sample sizes are similar to those generally employed in the field. Data distribution was assumed to be normal with similar variance between the groups that were compared statistically, but this was not formally tested. All statistical tests were two-sided. In no case were flies from the same genotype assigned to distinct experimental treatments, and so no randomization procedure was needed. No blinding was performed during experiments or analysis.
Spikes were detected using custom software in Igor Pro. Peri-stimulus time histograms were generated by calculating the firing rate in 50-ms bins that overlapped by 25 ms. Data for each cell represents an average of at least 4 trials of the same stimulus for electrophysiology experiments, and an average of 3 trials for calcium imaging experiments. All error bars represent s.e.m. computed across cells, as do the shaded bands in the peri-stimulus time histograms. For calcium imaging experiments, fluorescence was measured within a region of interest near the base of the arista that was drawn so as to contain the somata of 1-2 GCaMP-expressing cells in the same focal plane.
To compare responses to large temperature steps, we counted spikes in a 2-s period after step onset. To compare the sensitivity of cells to small temperature steps, we measured both mean temperature and mean neural activity (either firing rate or membrane potential) in a time window 100-400 ms after opening the valve for all cells except the warm-cool-PN, where we used a window of 100-200 ms after valve opening. Where we measured the mean membrane potential within a time window, we first low-pass filtered the membrane potential at 10 Hz to remove spikes. Because our device does not permit forward control of temperature with sub-degree precision, the exact temperatures we used were slightly different in each experiment. We therefore binned the data for the sensitivity analyses according to the measured temperature in each trial, averaging together different measurements in the same temperature bin within the same experiment. For each temperature bin we then computed then mean neural activity across experiments, and also the s.e.m. across experiments to generate the sensitivity plots; the x-axis value of each data point in the sensitivity plots represents the middle of each temperature bin. In order to perform tests of statistical significance on the sensitivity data, we used an iterative approach to avoid a multiple comparisons error. There is good reason to think there might be a true difference for small temperature steps that would not be evident for larger temperature steps, but we did not know a priori what temperature changes these neurons might be sensitive to. Therefore, for a given pair of genotypes and a given stimulus polarity (warming or cooling), we first compared responses to the smallest temperature step (0.125 °C) using an unpaired t-test. We then adjusted the threshold for significance (α) to reflect the cumulative number of tests performed (n) using a Bonferroni correction (α=0.05/n) and proceeded to test the adjacent temperature step (0.425 °C), and so on. This procedure maximized our statistical power for the smallest steps. Because statistical power decreased for increasingly larger steps, this procedure is appropriate for identifying the smallest step where a difference might occur, but not for identifying the entire temperature range over which there might be a difference.
Extended Data
Extended Data Figure 1. Jet micro-thermode schematic.

a) Schematic showing the major components of the jet micro-thermode. A pressurized reservoir forces saline through the inner chamber of a heat exchanger. The saline is then expelled as a jet through a 160 μm nozzle. This jet can be quickly turned on and off via a two-way solenoid valve (the “fast” valve). The outer chamber of the heat exchanger is fed by two pumps which circulate water from a hot and a cold water bath. Two three-way solenoid valves control the flow of water into the exchanger. A third valve (not shown) serves to return the outflow of the heat exchanger to the same bath that is feeding it.
b, c) In Hot Mode and Cold Mode the heat exchanger is heated or cooled by the continual circulation of water from one of the two baths through the outer chamber.
d) In the No Flow configuration, circulation in the outer chamber is stopped. This keeps the heat exchanger at a fairly constant temperature, stabilized by the thermal mass of the water in the outer chamber.
Extended Data Figure 2. Morphologies of neurons in the proximal antennal protocerebrum.

Images are z-projections of coronal sections (dorsal is up). The soma remains sealed to the patch pipette at the end of each recording, and so the soma and the proximal part of the primary neurite are not present in the reconstructed morphologies; they are indicated schematically (soma with a black ball and primary neurite with a thick black line). Morphologies shown here were representative of all filled examples of the same neuron type (except as noted below). Regions are color-coded according to the key in (f).
a) A fast-cool-PN. These neurons have dendrites in the proximal antennal protocerebrum and axons projecting to two regions of the lateral protocerebrum (posterior lateral protocerebrum and posterior slope). Some fast-cool-PNs arborized unilaterally (rather than bilaterally) in the proximal antennal protocerebrum; we pooled data from both morphologies because their physiological properties were indistinguishable.
b) A slow-cool-PN. These neurons have dendrites in the ipsilateral proximal antennal protocerebrum and axons projecting to a subregion of the calyx of the mushroom body. This morphology has been described previously36 (that study called this neuron a “transverse antennal lobe projection neuron”).
c) A warm-PN. These neurons have dendrites in the ipsilateral proximal antennal protocerebrum and axons projecting to two regions of the lateral protocerebrum (posterior lateral protocerebrum and posterior slope).
d) A warm-cool-PN. These neurons have dendrites in both the ipsi- and contralateral proximal antennal protocerebrum, as well as the ventral-posterior margin of the antennal lobe. Their axons project to two regions of the lateral protocerebrum (posterior lateral protocerebrum and posterior slope).
e) Two GABAergic LNs. All LNs we encountered in this study were bilateral. We define an “LN” here as a neuron that does not extend processes into any region except the proximal antennal protocerebrum (and the midline commissure that links them). Most LNs arborized broadly within the posterior antennal protocerebrum. and so are well-positioned to mediate cross-talk between warm and cool pathways.
f) Locations of color-coded brain regions in a coronal section through the brain.
Extended Data Figure 3. Adaptation to small temperature steps.

Sensitivity to small temperature steps, shown as the mean change in firing rate versus the change in temperature, averaged across experiments, ± s.e.m. (n = 5–9). Data in red are measured during a late period after stimulus onset (from 4 to 5 s after valve opening). Data in black are measured during an early period after stimulus onset (from 100 to 400 ms after valve opening, except for the warm-cool-PNs, where it was from 100 to 200 ms). Data in black are reproduced from Figure 1a (fast-cool-PNs), Figure 1b (slow-cool-PNs), Figure 2 (warm-PNs), and Extended Data Figure 7 (warm-cool-PNs). Note that slow-cool-PNs show little adaptation to large temperature steps (Figure 1b). However, their responses to small steps adapt strongly, like those of the other PN types.
Extended Data Figure 4. Innervation patterns in the proximal antennal protocerebrum.

Images are single coronal confocal sections through the proximal antennal protocerebrum, except where noted below. Magenta is neuropil (nc82 immunofluorescence). The approximate boundary of the proximal antennal protocerebrum is indicated in white outline.
a) Axon terminals of cold peripheral neurons and warm peripheral neurons. GFP expression is driven by specific Gal4 lines (GMR79C04-Gal4 for the cool cells, Gr28b.d-Gal4 for the warm cells). As noted previously2, the cool peripheral cells project to the lateral part of this brain region, whereas the warm peripheral cells project more medially. Neuropils surrounding the proximal antennal protocerebrum are labeled as LP (lateral protocerebrum), LAL (lateral accessory lobe) and SOG (subesophageal ganglion). Schematic at right shows a coronal section of the whole brain with the location of the proximal antennal protocerebrum indicated by white outlines.
b) Dendrites of three types of projection neurons. Each cell was filled with biocytin and visualized using a fluorescent streptavidin conjugate. The dendrites of the fast-cool-PNs reside in the lateral part of the proximal antennal protocerebrum. The same is true of the dendrites of the slow-cool-PNs (data not shown). The dendrites of the warm-PNs overlap with the axons of both warm and cool peripheral neurons. The dendrites of warm-cool-PNs are sparser than those of other PN types, so in a single section only scattered fragments of dendrite are visible; therefore a z-projection through the entire proximal antennal protocerebrum is shown in the image below.
Extended Data Figure 5. Circuit contributions to cool-PN responses.

(a) Fast-cool-PNs.
(a1) Mean firing rate for the fast-cool-PNs, ± s.e.m. Reproduced from Figure 1a.
(a2) Mean firing rate with synaptic inhibition blocked with picrotoxin and CGP54626 (n = 4–5).
(a3) Mean firing rate in the Gr28b.d mutant (n = 5–10).
(a4) Mean firing rate in the Gr28b.d mutant with inhibition blocked (n = 4–6).
(b) Slow-cool-PNs.
(b1) Mean firing rate for the slow-cool-PNs, ± s.e.m. Reproduced from Figure 1b.
(b2) Mean firing rate with synaptic inhibition blocked with picrotoxin and CGP54626 (n = 4–5).
(b3) Mean firing rate in the Gr28b.d mutant (n = 4–5).
(a4) Mean firing rate in the Gr28b.d mutant with inhibition blocked (n = 4).
In the Gr28b.d mutant, note that blocking inhibition produces only modest disinhibition in the cool-PNs. This contrasts with our results in the warm-PNs and warm-cool-PNs, where blocking inhibition in the mutant abolished all excitation evoked by the preferred stimulus for these neurons (Figure 2 and Figure 3). Genotypes are: a, Gr28bMB03888;GMR95C02-Gal4,pJFRC2-10XUAS-IVS-mCD8::GFP and b, Gr28bMB03888;GMR67D03-Gal4,pJFRC2-10XUAS-IVS-mCD8::GFP.
Extended Data Figure 6. Validation of the LexA line for warm peripheral cells and the Gal4 line for cool peripheral cells.

There are 6 thermoreceptor cells at the base of the arista, comprising 3 warm cells and 3 cool cells2. Gr28b.d-Gal4 labels the 3 warm cells3.
(a) Validation of the Gr28b.d-LexA line for warm peripheral cells.
(a1) We generated a LexA line using a Gr28b.d promoter fragment. Here we show that Gr28b.d-LexA labels 3 cells at the base of the arista. This image is a z-projection of a confocal stack through the base of the arista. Genotype is Gr28b.d-LexA/+;26XLexAop2-mCD8::GFP/+.
(a2) Axon terminals in the brain of peripheral neurons labeled by Gr28b.d-LexA (left) and Gr28b.d-Gal4 (right), both crossed with appropriate CD8::GFP reporter lines. As expected, the medial portion of the proximal antennal protocerebrum (outlined in white) is labeled with GFP. Images are single coronal confocal sections through the proximal antennal protocerebrum. Magenta is neuropil (nc82 immunofluorescence). Image on the right is reproduced from Extended Data Figure 3.
(b) Validation of the GMR79C04-Gal4 line for cool peripheral cells.
(b1) GMR79C04-Gal4 labels 3 cells at the base of the arista. Combining this driver with Gr28b.d-Gal4 labels 6 cells, indicating that these drivers label mutually exclusive populations of aristal neurons. These images show z-projections of confocal stacks through the base of the arista. Genotypes are Gr28b.d-Gal4/+;UAS-nls-GFP/+ (left), UAS-nls-GFP/+;GMR79C04-Gal4/+ (middle), Gr28b.d-Gal4/+;UAS-nls-GFP/GMR79C04-Gal4 (right).
(b2) Calcium imaging of neurons at the base of the arista shows that Gr28b.d-Gal4 labels cells that are excited by warming and inhibited by cooling, whereas GMR79C04-Gal4 labels cells that are excited by cooling and inhibited by warming. Shown here are representative experiments using the “large fast step” stimuli. Genotypes are 20xUAS-GCaMP3/+;Gr28b.d-Gal4/+ (warm cell imaging) and 20XUAS-GCaMP3/+;;GMR79C04-Gal4/+ (cool cell imaging). Note that Figure 4g shows data for all experiments using “small fast step” stimuli.
Extended Data Figure 7. Histamine injection controls.

In these experiments the LexA driver (Gr28b.d-LexA) was omitted, but otherwise the experimental protocol was the same as in Figure 2e,f and Figure 3e–g. After histamine was injected into the antenna, there was little effect on the thermal responses of warm-PNs or warm-cool-PNs.
a) Recordings from warm-PNs (n = 5). Genotype is LexAOp-HA-Ort/+;GMR95C02-Gal4,pJFRC2-10XUAS-IVS-mCD8::GFP.
b) Recordings from warm-cool-PNs (n = 4). Genotype is LexAOp-HA-Ort/+;GMR54A03-Gal4,pJFRC2-10XUAS-IVS-mCD8::GFP.
Extended Data Figure 8. Sensitivity to small temperature steps in warm-cool-PNs.
Sensitivity to small temperature steps, shown as the mean change in firing rate versus the change in temperature, averaged across experiments, ± s.e.m. (n = 5–9). Firing rate changes were averaged over a window from 100 ms to 200 ms after valve opening. Sensitivity was not significantly different in wild type versus the Gr28b.d mutant (unpaired t-tests with iterative Bonferroni corrections, see Online Methods). Blocking inhibition in these cells produced oscillatory activity that precluded analysis of responses to small steps with inhibition blocked.
Genotypes are: GMR54A03-Gal4,pJFRC2-10XUAS-IVS-mCD8::GFP (wild type) and Gr28bMB03888;GMR54A03-Gal4,pJFRC2-10XUAS-IVS-mCD8::GFP (Gr28b.d−/−)
Extended Data Figure 9. Validating the Gad1-Gal4 line as a marker of GABAergic local neurons in the posterior antennal protocerebrum.

In pilot studies, we found that all the local neurons we encountered in the proximal antennal protocerebrum had somata within a distinctive cluster ventral to the antennal lobes. We therefore targeted our electrodes to this cluster when we used a Gad1-Gal4 line26 to drive CD8::GFP expression in putative GABAergic neurons. In order to determine if the CD8::GFP-expressing somata in this cluster are indeed GABAergic, we performed dual immunofluorescence confocal microscopy with anti-CD8 and anti-GABA antibodies. This representative image shows that almost all CD8::GFP-expressing somata in this region are GABA-immunopositive (90% overall), although not all GABAergic somata express CD8::GFP. This image is a single coronal section through the cluster of somata.
Extended Data Figure 10. Additional examples of local neurons (LNs) in the proximal antennal protocerebrum.

For each LN, the sequence of panels is analogous to that of Figure 4: raw traces, peri-stimulus time histograms, and sensitivity plots. The morphologies of these cells (d and h) are displayed as in Extended Data Figure 1, with a red outline indicating the boundary of the proximal antennal protocerebrum.
a–d) A GABAergic LN. This LN is excited by warming and is inhibited by cooling. This cell was recorded in the genotype in pJFRC7-20XUAS-IVS-mCD8::GFP/+;Gad1-Gal4/+.
e–h) A glutamatergic LN. This LN is excited by cooling and is inhibited by warming, and its properties are similar to those of all the glutamatergic LNs we recorded from. In total we recorded from 6 glutamatergic LNs, three in the genotype GMR52G03-Gal4,pJFRC2-10XUAS-IVS-mCD8::GFP and three in the genotype GMR91H10-Gal4,pJFRC2-10XUAS-IVS-mCD8::GFP.
Supplementary Material
Acknowledgments
We are grateful to C.-H. Lee for the gift of LexAOp-HA-Ort flies, P. Garrity for Gr28b.d-Gal4, and A. Rajan for Gad1-Gal4 (line 2B). A. DiAntonio kindly supplied the anti-dVGluT antibody. We thank the Wilson laboratory, A. Samuel, P. Garrity, L. Griffith, and D. Ginty for comments on the manuscript. D. Rogulja’s laboratory and M. Y. Wong shared reagents and expertise. A portion of this work was supported by NIH grant R01 DC008174. W.W.L. is supported by an HHMI International Research Fellowship and a Presidential Scholarship from the MD-PhD Program at Harvard Medical School. R.I.W. is an HHMI Investigator.
Footnotes
Author Contributions
W.W.L. and R.I.W. conceived the experiments. O.M. and W.W.L. made the thermal stimulation device. W.W.L. performed the experiments. W.W.L. and R.I.W. analyzed the data and wrote the manuscript.
The authors declare no competing financial interests.
Supplemental Information is linked to the online version of the paper at www.nature.com/nature
References
- 1.Schepers RJ, Ringkamp M. Thermoreceptors and thermosensitive afferents. Neurosci Biobehav Rev. 2010;34:177–184. doi: 10.1016/j.neubiorev.2009.10.003. [DOI] [PubMed] [Google Scholar]
- 2.Gallio M, Ofstad TA, Macpherson LJ, Wang JW, Zuker CS. The coding of temperature in the Drosophila brain. Cell. 2011;144:614–624. doi: 10.1016/j.cell.2011.01.028. [DOI] [PMC free article] [PubMed] [Google Scholar]
- 3.Ni L, et al. A gustatory receptor paralogue controls rapid warmth avoidance in Drosophila. Nature. 2013;500:580–584. doi: 10.1038/nature12390. [DOI] [PMC free article] [PubMed] [Google Scholar]
- 4.Ma Q. Labeled lines meet and talk: population coding of somatic sensations. J Clin Invest. 2010;120:3773–3778. doi: 10.1172/JCI43426. [DOI] [PMC free article] [PubMed] [Google Scholar]
- 5.Prescott SA, Ratte S. Pain processing by spinal microcircuits: afferent combinatorics. Curr Opin Neurobiol. 2012;22:631–639. doi: 10.1016/j.conb.2012.02.010. [DOI] [PMC free article] [PubMed] [Google Scholar]
- 6.Cavanaugh DJ, et al. Distinct subsets of unmyelinated primary sensory fibers mediate behavioral responses to noxious thermal and mechanical stimuli. Proc Natl Acad Sci U S A. 2009;106:9075–9080. doi: 10.1073/pnas.0901507106. [DOI] [PMC free article] [PubMed] [Google Scholar]
- 7.Green BG. Temperature perception and nociception. J Neurobiol. 2004;61:13–29. doi: 10.1002/neu.20081. [DOI] [PubMed] [Google Scholar]
- 8.Sayeed O, Benzer S. Behavioral genetics of thermosensation and hygrosensation in Drosophila. Proc Natl Acad Sci U S A. 1996;93:6079–6084. doi: 10.1073/pnas.93.12.6079. [DOI] [PMC free article] [PubMed] [Google Scholar]
- 9.Zars T. Two thermosensors in Drosophila have different behavioral functions. J Comp Physiol A. 2001;187:235–242. doi: 10.1007/s003590100194. [DOI] [PubMed] [Google Scholar]
- 10.Tang X, Platt MD, Lagnese CM, Leslie JR, Hamada FN. Temperature integration at the AC thermosensory neurons in Drosophila. J Neurosci. 2013;33:894–901. doi: 10.1523/JNEUROSCI.1894-12.2013. [DOI] [PMC free article] [PubMed] [Google Scholar]
- 11.Chiang AS, et al. Three-dimensional reconstruction of brain-wide wiring networks in Drosophila at single-cell resolution. Curr Biol. 2011;21:1–11. doi: 10.1016/j.cub.2010.11.056. [DOI] [PubMed] [Google Scholar]
- 12.Hamada FN, et al. An internal thermal sensor controlling temperature preference in Drosophila. Nature. 2008;454:217–220. doi: 10.1038/nature07001. [DOI] [PMC free article] [PubMed] [Google Scholar]
- 13.Thorne N, Amrein H. Atypical expression of Drosophila gustatory receptor genes in sensory and central neurons. J Comp Neurol. 2008;506:548–568. doi: 10.1002/cne.21547. [DOI] [PubMed] [Google Scholar]
- 14.Pfeiffer BD, et al. Tools for neuroanatomy and neurogenetics in Drosophila. Proc Natl Acad Sci U S A. 2008;105:9715–9720. doi: 10.1073/pnas.0803697105. [DOI] [PMC free article] [PubMed] [Google Scholar]
- 15.Ito K, et al. A systematic nomenclature for the insect brain. Neuron. 2014;81:755–765. doi: 10.1016/j.neuron.2013.12.017. [DOI] [PubMed] [Google Scholar]
- 16.Heisenberg M. Mushroom body memoir: from maps to models. Nat Rev Neurosci. 2003;4:266–275. doi: 10.1038/nrn1074. [DOI] [PubMed] [Google Scholar]
- 17.Liu WW, Wilson RI. Transient and specific inactivation of Drosophila neurons in vivo using a native ligand-gated ion channel. Curr Biol. 2013;23:1202–1208. doi: 10.1016/j.cub.2013.05.016. [DOI] [PMC free article] [PubMed] [Google Scholar]
- 18.Enell L, Hamasaka Y, Kolodziejczyk A, Nassel DR. gamma-Aminobutyric acid (GABA) signaling components in Drosophila: immunocytochemical localization of GABA(B) receptors in relation to the GABA(A) receptor subunit RDL and a vesicular GABA transporter. J Comp Neurol. 2007;505:18–31. doi: 10.1002/cne.21472. [DOI] [PubMed] [Google Scholar]
- 19.Daniels RW, Gelfand MV, Collins CA, DiAntonio A. Visualizing glutamatergic cell bodies and synapses in Drosophila larval and adult CNS. J Comp Neurol. 2008;508:131–152. doi: 10.1002/cne.21670. [DOI] [PubMed] [Google Scholar]
- 20.Liu WW, Wilson RI. Glutamate is an inhibitory neurotransmitter in the Drosophila olfactory system. Proc Natl Acad Sci U S A. 2013;110:10294–10299. doi: 10.1073/pnas.1220560110. [DOI] [PMC free article] [PubMed] [Google Scholar]
- 21.Foelix RF, Stocker RF, Steinbrecht RA. Fine structure of a sensory organ in the arista of Drosophila melanogaster and some other dipterans. Cell Tissue Res. 1989;258:277–287. doi: 10.1007/BF00239448. [DOI] [PubMed] [Google Scholar]
- 22.Sachs F, Morris CE. Rev Physiol Biochem Pharmacol. Vol. 132. Springer; 1998. Mechanosensitive Ion Channels in Non-Specialized Cells; pp. 1–77. [DOI] [PubMed] [Google Scholar]
- 23.Fischer H, Tichy H. Cold-receptor cells supply both cold- and warm-responsive projection neurons in the antennal lobe of the cockroach. J Comp Physiol A Neuroethol Sens Neural Behav Physiol. 2002;188:643–648. doi: 10.1007/s00359-002-0339-1. [DOI] [PubMed] [Google Scholar]
- 24.Ruchty M, Helmchen F, Wehner R, Kleineidam CJ. Representation of thermal information in the antennal lobe of leaf-cutting ants. Front Behav Neurosci. 2010;4:174. doi: 10.3389/fnbeh.2010.00174. [DOI] [PMC free article] [PubMed] [Google Scholar]
- 25.Wilson RI, Laurent G. Role of GABAergic inhibition in shaping odor-evoked spatiotemporal patterns in the Drosophila antennal lobe. J Neurosci. 2005;25:9069–9079. doi: 10.1523/JNEUROSCI.2070-05.2005. [DOI] [PMC free article] [PubMed] [Google Scholar]
- 26.Mehren JE, Griffith LC. Cholinergic neurons mediate CaMKII-dependent enhancement of courtship suppression. Learn Mem. 2006;13:686–689. doi: 10.1101/lm.317806. [DOI] [PubMed] [Google Scholar]
- 27.Xiang Y, et al. Light-avoidance-mediating photoreceptors tile the Drosophila larval body wall. Nature. 2010;468:921–926. doi: 10.1038/nature09576. [DOI] [PMC free article] [PubMed] [Google Scholar]
- 28.Pfeiffer B, et al. Refinement of tools for targeted gene expression in Drosophila. Genetics. 2010;186:735–755. doi: 10.1534/genetics.110.119917. [DOI] [PMC free article] [PubMed] [Google Scholar]
- 29.Tian L, et al. Imaging neural activity in worms, flies and mice with improved GCaMP calcium indicators. Nat Methods. 2009;6:875–881. doi: 10.1038/nmeth.1398. [DOI] [PMC free article] [PubMed] [Google Scholar]
- 30.Fisek M, Wilson RI. Stereotyped connectivity and computations in higher-order olfactory neurons. Nat Neurosci. 2014;17:280–288. doi: 10.1038/nn.3613. [DOI] [PMC free article] [PubMed] [Google Scholar]
- 31.Takemura SY, et al. Cholinergic circuits integrate neighboring visual signals in a Drosophila motion detection pathway. Curr Biol. 2011;21:2077–2084. doi: 10.1016/j.cub.2011.10.053. [DOI] [PMC free article] [PubMed] [Google Scholar]
- 32.Lai SL, Lee T. Genetic mosaic with dual binary transcriptional systems in Drosophila. Nat Neurosci. 2006;9:703–709. doi: 10.1038/nn1681. [DOI] [PubMed] [Google Scholar]
- 33.Gouwens NW, Wilson RI. Signal propagation in Drosophila central neurons. J Neurosci. 2009;29:6239–6249. doi: 10.1523/JNEUROSCI.0764-09.2009. [DOI] [PMC free article] [PubMed] [Google Scholar]
- 34.Wilson RI, Turner GC, Laurent G. Transformation of olfactory representations in the Drosophila antennal lobe. Science. 2004;303:366–370. doi: 10.1126/science.1090782. [DOI] [PubMed] [Google Scholar]
- 35.Laissue PP, et al. Three-dimensional reconstruction of the antennal lobe in Drosophila melanogaster. J Comp Neurol. 1999;405:543–552. [PubMed] [Google Scholar]
- 36.Jenett A, et al. A GAL4-driver line resource for Drosophila neurobiology. Cell Rep. 2012;2:991–1001. doi: 10.1016/j.celrep.2012.09.011. [DOI] [PMC free article] [PubMed] [Google Scholar]
Associated Data
This section collects any data citations, data availability statements, or supplementary materials included in this article.