Significance
Innovative fundamental basic science research is traditionally done by young people. This makes the steady fall in the number of younger US basic scientists a serious concern. Our analysis suggests that this happened mainly due to a bias against younger applicants, with more money going to older principal investigators (PIs). We also find a large number of postdoctoral scholars and research associates, a rapid rise in number of PIs over 71, and a steady shift of NIH funds away from R01 grants. NIH is attempting to deal with some of these issues.
Keywords: age-related bias, early-stage investigators, mentoring, independence
Abstract
Young researchers are crucially important for basic science as they make unexpected, fundamental discoveries. Since 1982, we find a steady drop in the number of grant-eligible basic-science faculty [principal investigators (PIs)] younger than 46. This fall occurred over a 32-y period when inflation-corrected congressional funds for NIH almost tripled. During this time, the PI success ratio (fraction of basic-science PIs who are R01 grantees) dropped for younger PIs (below 46) and increased for older PIs (above 55). This age-related bias seems to have caused the steady drop in the number of young basic-science PIs and could reduce future US discoveries in fundamental biomedical science. The NIH recognized this bias in its 2008 early-stage investigator (ESI) policy to fund young PIs at higher rates. We show this policy is working and recommend that it be enhanced by using better data. Together with the National Institute of General Medical Sciences (NIGMS) Maximizing Investigators’ Research Award (MIRA) program to reward senior PIs with research time in exchange for less funding, this may reverse a decades-long trend of more money going to older PIs. To prepare young scientists for increased demand, additional resources should be devoted to transitional postdoctoral fellowships already offered by NIH.
It is a well-known observation that the age of the youngest NIH R01 grantees has been rising steadily since 1980 when data first became available (1–9). The R01 grant, which is NIH’s oldest grant mechanism, is dominant both in numbers and funding level. Does the increasing age of R01 grant holders affect the number of young independent scientists? Not having an R01 grant at a young age does not matter, provided that young scientists are given the funding needed to work independently and make their new discoveries in fundamental, curiosity-driven, basic-science research (more simply, basic science). For one sector of the US biomedical workforce, there are excellent records going back to the 1960s. The Association of American Medical Colleges (AAMC) collects data on the age profiles of all staff and faculty at US medical schools (10). These data are comprehensive, classifying faculty by academic rank and basic-science or clinical-science department.
Of particular concern is the number of young basic-science principal investigators (PIs): disruptive discoveries in basic science and information technology often originate with young people. Most Nobel laureates made their discoveries when younger than 40 (3, 11, 12). The founders of Apple, Microsoft, Yahoo, Google, and Facebook all made their breakthroughs by dropping out of college to build innovative companies.
Basic-science PIs in US medical schools are most dependent on external funding: on average, tenured basic scientists need to raise funds to cover one-half of their salary, whereas clinical scientists and university faculty need to raise funds to cover a quarter of their salary (13). Although basic scientists may be funded by the National Science Foundation (NSF), nonfederal or private sources, the NIH is their major funding source, making it the focus of this study.
We find (i) all PIs are aging, with basic-science PIs aging more quickly than R01 grantees, and clinical-science PIs aging more slowly than R01 grantees; (ii) the number of clinical-science PIs of all ages has increased, whereas the number of young basic-science PIs has decreased; (iii) rapid doubling of NIH appropriation from 2000 to 2004 led to a rise in the number of younger basic-science PIs, but the increase in number of younger R01 grantees lagged by 8 y because it is difficult to add young PIs when funding is not steady; (iv) the age profile of the PI success ratio (fraction of basic-science PIs having R01 funding at a particular age) does not change for age relative to median R01 grantee age. Since 1980, basic-science PIs below 46 are less and less likely to be funded, and those above 55 are more and more likely (5); basic sciences led to US domination of Nobel Prizes.
Based on this, we believe that increasing the number of young basic-science PIs is essential to keeping US biomedical science truly innovative. We make three recommendations. (i) The NIH needs to reduce funding of older PIs so as to release funds for younger PIs. (ii) The NIH needs to eliminate the age bias shown by the PI success ratio. When a smaller and smaller fraction of PIs under 46 are getting R01 grants, departments will hire fewer young PIs. When more and more PIs between 50 and 70 are getting R01 grants, departments will keep them on. Ideally, this correction should depend on the age bias and be adjusted as the number of younger PIs increases. (iii) The NIH needs to increase the number of K99 fellowships awarded. Postdoctoral scholars must be given the independence enjoyed by the baby-boomer generation. Current postdoctoral scholars are often part of a large research group, one of many authors on papers, and not owners of a research project that they can take away with them.
The NIH has proactively dealt with the first two of our three recommendations. Since 2016, the National Institute of General Medical Sciences (NIGMS), which funds more basic science than other parts of NIH, began making grant awards in the Maximizing Investigators’ Research Award (MIRA) pilot program. This program rewards well-funded senior investigators with a more stable funding in return for a drop of total funds to be used to fund younger PIs. Since 2008, priority scores of young PIs have been increased by the NIH early-stage investigator (ESI) policy. Our third recommendation is for additional K99 fellows, those postdoctoral scholars who do better at getting positions and R01 grants (14). As postdoctoral fellows on R01 grants (15) outnumber K99 fellows (16) by 30 to 1, there would be ample funds to boost the number of K99 fellows if fewer postdoctoral scholars are funded on R01 grants.
Results
Aging of R01 PIs and Medical School Investigators.
The aging of young R01 grantees is well known from the published average age of those investigators who receive their first independent research (FIR) R01 grant (17). Problems facing young R01 applicants was noted decades ago in a 1994 National Research Council Report (18). In it, Bruce Alberts wrote, “The number of applications for NIH grants submitted by younger biomedical investigators had plummeted by more than 50% from 1985 to 1993.” White et al. (4) noted that the “average age at which investigators receive their first independent research project grant, has increased from 34.3 to 42.4 over the period from 1970 to 2006.”
These early observations were highlighted in Holden’s January 2008 “Random Samples” note in Science, “The Incredible Aging Investigator,” showing NIH age profile data for 1980, 2008, and 2020 (19). In November 2008, NIH Director Zerhouni’s parting message was to “make room for young scientists” (20). Also in 2008, Gingras et al. (21) wrote, “first grant [age] from NIH has increased from 34.3 in 1970, to 41.7 in 2004”; this was reiterated in refs. 4, 21, and 22. In 2011, Matthews et al. (3) published a comprehensive study showing that both the age of first-time R01 grantees and the average age of all R01 grantees is steadily increasing, whereas Nobel Prizes are generally awarded for early career work. Adams (23) noted prizes for early work, a 1946 “bibliometric” study (24).
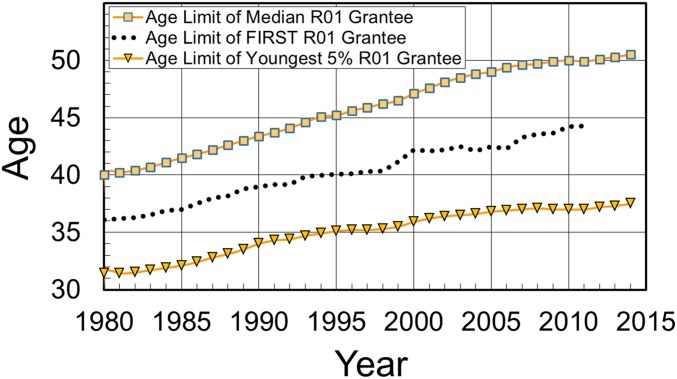
Fig. 1 shows the most recent data for FIR R01 grants (16) (black dotted line). FIR grantees are 6 y older than the youngest 5%, making their age close to that of the youngest 25% grantees. Thus, FIR grantees are not the youngest grantees but rather representative of the youngest quarter.
Fig. 1.
This figure shows age variation of R01 grantees. The median age grows from 40 to 50, whereas that of the 5% youngest grows from 32 to 37. The average age of first-(FIR) R01 grantees (ref. 15, black dotted line) is 6 y more than that of the 5% youngest, and halfway to the median age. Age changes for youngest, oldest, and median basic clinical-science PIs are shown in Fig. S1. Since 1980, US life expectancy has increased by 5 y (64).
Fig. S1.
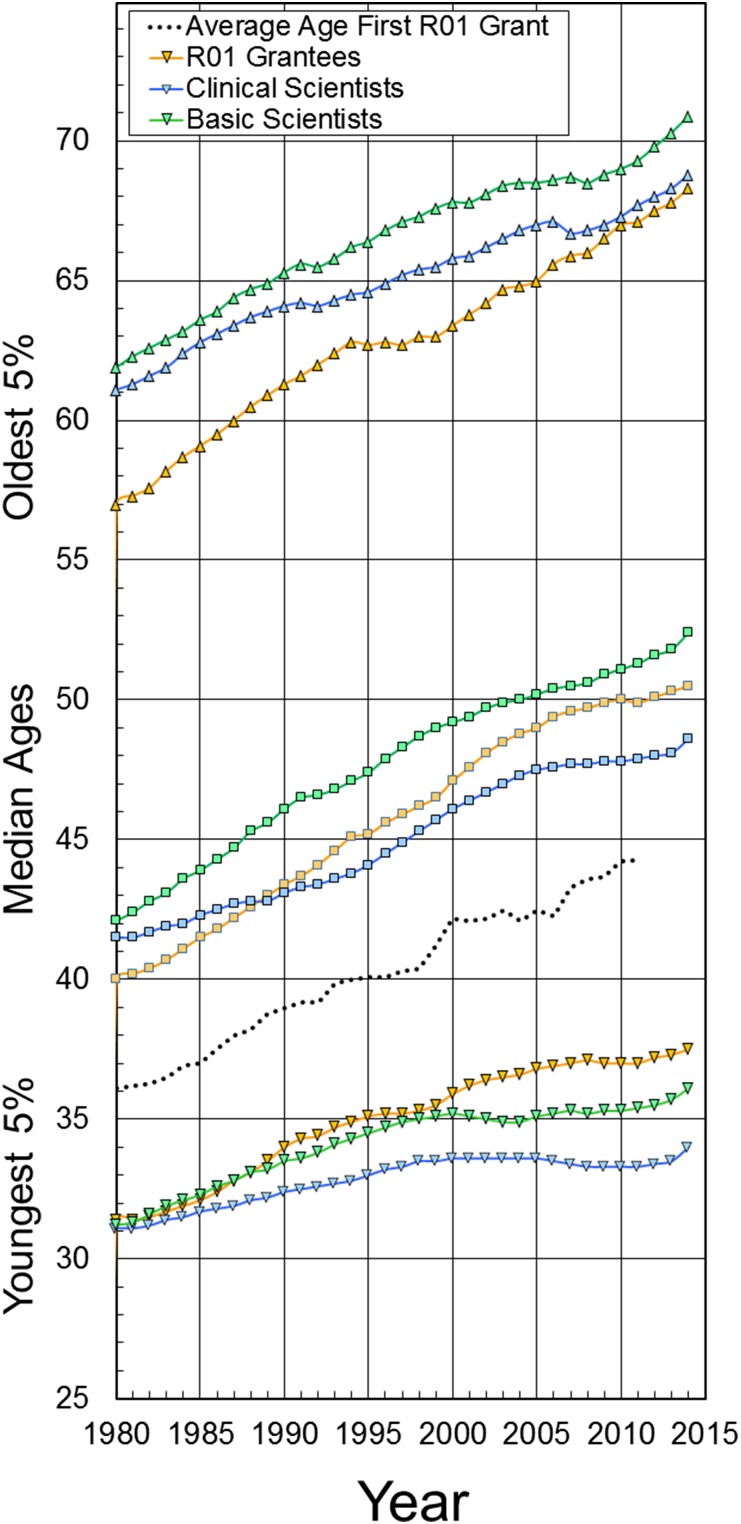
This figure shows the age variation of R01 grantees, basic-science PIs, and clinical-science PIs. The average age of first-time (FIR) R01 grantees (15) is shown as a black dotted line. As discussed in Fig. 1, the FIR age is about 6 y older than the threshold age of the 5% youngest. We consider three threshold ages: the 5% oldest (the threshold age of the older 5%); the median age; and the 5% youngest (the threshold age of the younger 5%). In the 34 y from 1980 to 2014, the ages of the oldest 5% of R01 grantees, clinical-science PIs, and basic-science PIs showed changes of 11.3, 7.7, and 9.0 y, respectively. Corresponding changes for the median age are 10.5, 7.1, and 10.3 y, and for the ages of the youngest 5%, they are 6.1, 2.9, and 4.9 y. For the oldest 5% and the median age, basic scientists are always older than clinical scientists, who themselves are older than R01 grantees. For the youngest 5%, since 1989 R01 grantees have been older than either basic- or clinical-science PIs.
Aging of a workforce that initially has few older members is expected: even if many young members are added, the median age will increase as the entire population ages. Aging of R01 grantees does not matter so long as there are other ways that young PIs can be funded, which could include startup institutional funds, grants from other federal agencies, private charities, etc. It is crucially important that the number of young faculty is not affected by the aging of R01 grantees.
Changing Numbers of PIs and Medical School Investigators.
We first learned of this issue from Dr. Sally Rockey’s blog of February 13, 2012 (25), and the accompanying presentation by Walter Schaffer (26). Here, we adopt their data-centric approach analyzing data provided in Dataset S1 with Perl (pseudocode in Dataset S2).
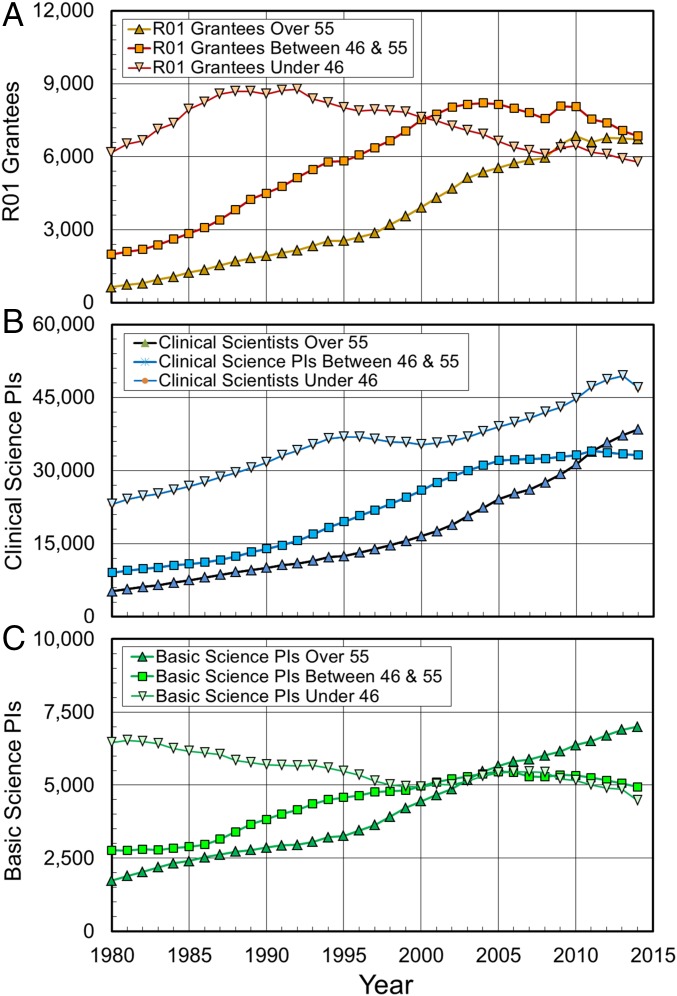
Fig. 2 shows changes from 1980 to 2014 in the numbers of three groups (grantees, clinical-science PIs, and basic-science PIs) for three chosen age ranges: older, middle aged, and younger. For the older PIs, the curves show steady growth for R01 grantees, clinical-science PIs, and basic-science PIs. All grow more quickly after 1997 (growth rates increase by 3-, 2.4-, and 1.6-fold, respectively). For the middle-aged PIs, the curves all show initial growth followed by saturation (for clinical-science PIs) or a drop (for basic-science PIs and R01 grantees) starting from about 2005.
Fig. 2.
This figure shows numbers of R01 grantees, clinical-science PIs, and basic-science PIs. Our three age ranges are as follows: older (over 55, or >55), middle aged (46–55), and younger (under 46, or <46). A shows that the number of younger R01 grantees has dropped since 1990, the number of middle-aged R01 grantees has dropped from 2004, whereas the number of older R01 grantees grew until 2010 when it remained steady. B shows that numbers of clinical science (CS) PIs have increased, although the growth rate for those over 55 has been most rapid. C shows that basic science (BS) PIs behave more like R01 grantees. The number of younger BS PIs has fallen since 1981, the number of middle-aged BS PIs has fallen since 2005, whereas the number of older BS PIs grows rapidly.
For the younger PIs, the curves are very different from one another. The number of younger R01 grantees peaked in 1992 at 8,782 before falling to 5,780 in 2014, a drop of 3,002 or 34.2% to the lowest number since 1980. The number of younger clinical-science PIs increased steadily, apart from a pause between 1995 and 2000 and a dip in 2014. In stark contrast, the number of younger basic-science PIs fell steadily from 1981 to 2000, increased until 2008, and then fell again even more quickly (loss rates of 76/y from 1980 to 2000 and 161/y from 2008 to 2014). In 2014, there were 4,477 younger basic-science PIs, or 2,045 less than the peak of 6,522 in 1981 (−25.6%). In summary, numbers increase for older PIs, increase and saturate for middle-aged PIs, and fall for younger PIs. Fig. S2 shows complete age distributions.
Fig. S2.
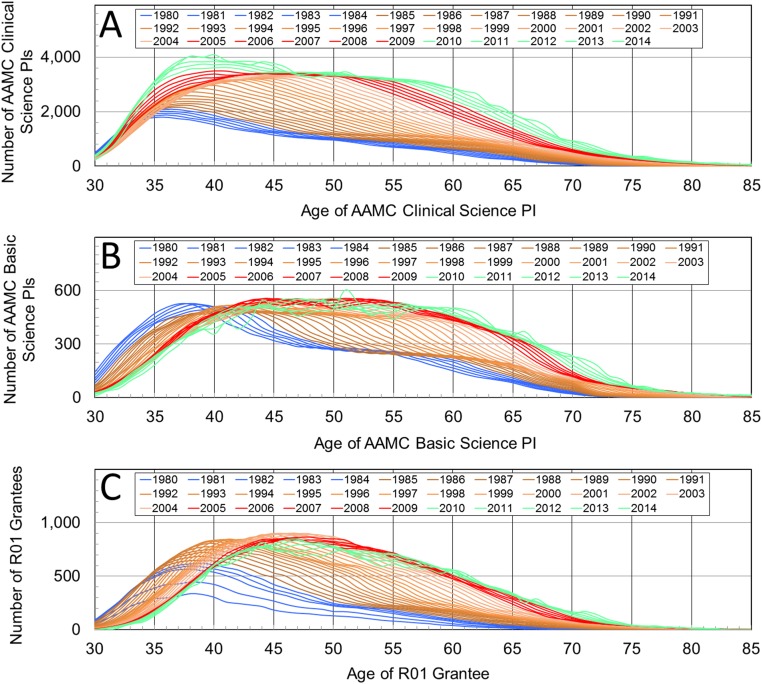
This figure shows how the age distributions of (A) the number of AAMC clinical-science PIs, (B) the number of AAMC basic-science PIs, and (C) the number of NIH R01 grantees have changed for years of analysis between 1980 and 2014. The raw data are averaged over a running window 5 y wide. The blue lines are the 5 earliest years (1980–1984), whereas the green lines are the 5 most recent years (2010–2014). These are the raw data that are used for much of our analysis.
Changing Grant-Funding Allocations.
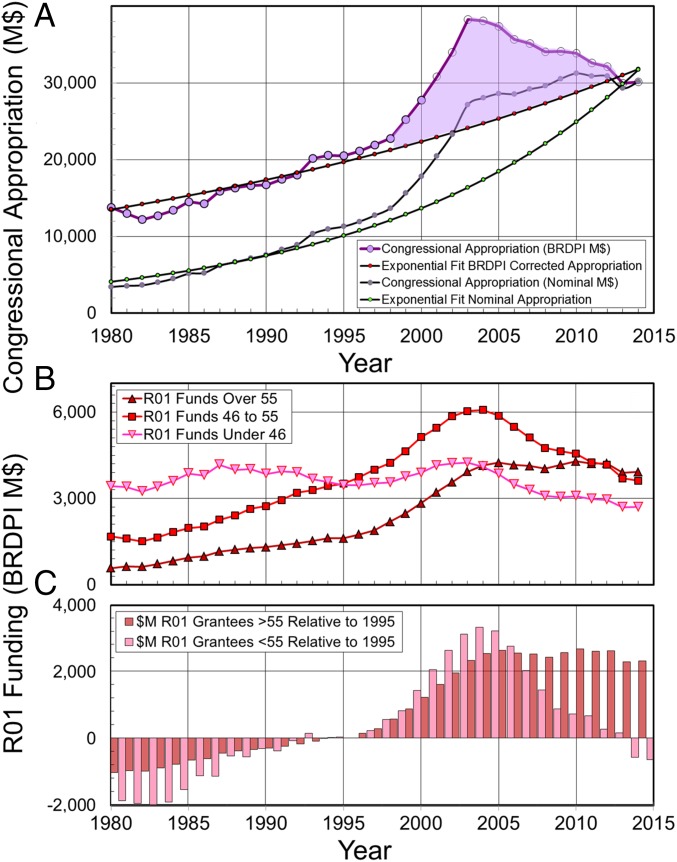
The period from 1980 to 2014 witnessed great changes in the congressional appropriation for NIH. Fig. 3A shows the appropriation in nominal millions of dollars (M$) grew 8.2 times from 3,634 M$ in 1980–29,779 M$ in 2014. After correcting for inflation to 2014 dollars using the biomedical research and development price index (BRDPI), growth is a more modest 2.73 times increase from 10,925 M$ in 1980–29,779 M$ in 2014 (we use BRDPI dollars throughout).
Fig. 3.
NIH congressional appropriation and R01 funding allocations. (A) The appropriation increased exponentially both in inflation-corrected (BRDPI) dollars and nominal dollars, with doubling in 28 and 12 y, respectively. From 2001 to 2012, the appropriation rises above this exponential growth before falling back for excess funding of 104,000 M$. (B) Funding for older R01 grantees increased steadily; for middle-aged grantees, it dropped after 2004; and for younger grantees, it has hardly changed. (C) Since 1995, funds for R01 grantees over 55 increased by 2,313 M$, whereas they decreased by 651 M$ for R01 grantees below 56.
Most remarkable is the departure from the steady growth that occurred between 1999 and 2004 when the corrected appropriation increased from 22,489 M$ to 37,895 M$, a change of 15,407 M$ over 5 y. After 2005, the nominal appropriation continued to increase but not fast enough to keep up with inflation. Thus, the inflation-corrected appropriation fell from its peak value of 38,187 M$ in 2005–29,780 M$ in 2014, a drop of 22%. The fall returned the appropriation to its traditional exponential growth baseline in 2013. This allows calculation of the total excess inflation-corrected appropriation as the cumulative difference between the actual appropriation and its long-term trend. Between 2000 and 2012, the excess is over 104,000 M$.
Fig. 3B shows changes in allocations for older, middle-aged, and younger R01 grantees before, during, and after the rapid increase in appropriation. For older R01 grantees, there is slow growth of 19 M$ per year from 1980 to 2000 followed by rapid growth of 179 M$ from 2001 to 2005. Growth saturates at 4,630 M$ (2001–2014), a threefold higher level than before (1,480 M$, 1980–2000). Allocation for middle-aged R01 grantees behaves very differently, rising rapidly to a peak of 6,020 M$ in 2004, after which it falls. Allocation for young R01 grantees remains more or less constant until 2003, but then falls steadily until 2014. Fig. 3C shows that there is a large net transfer of funds to R01 grantees over 55.
Numbers of Grantees and Basic-Science PIs.
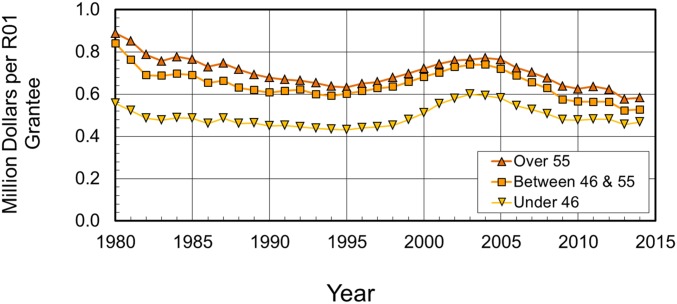
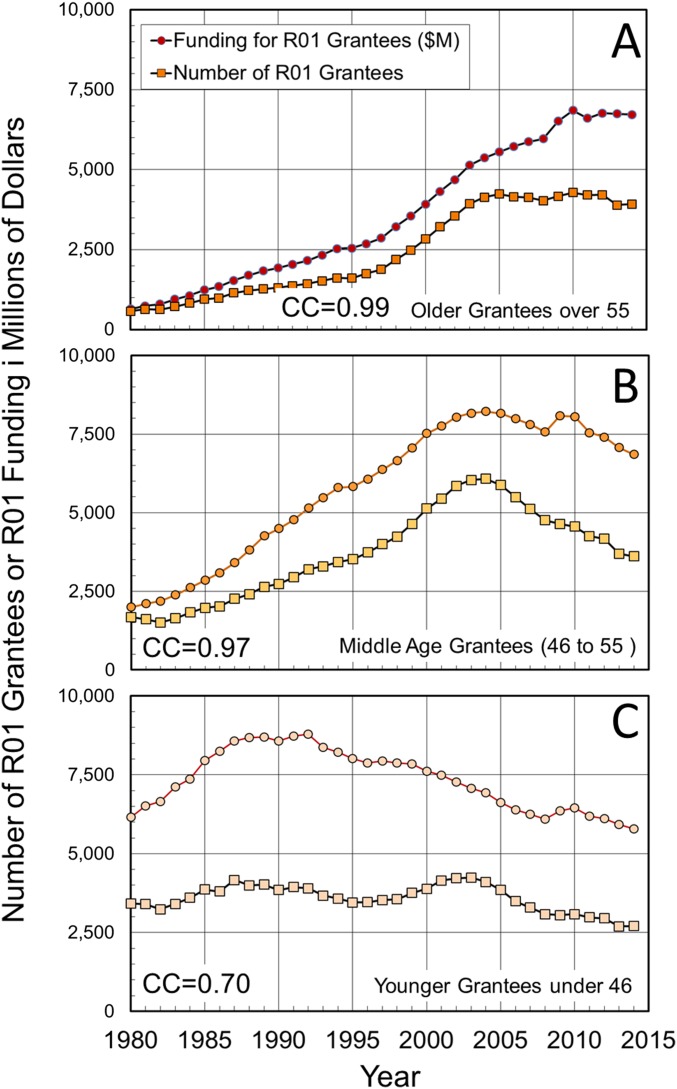
The number of R01 grantees is expected to correlate with funding allocation (Figs. S3 and S4). The average total annual funding per grantee (in M$) is 0.70 ± 0.07, 0.65 ± 0.07, and 0.49 ± 0.05 for older, middle-aged, and younger grantees, respectively. Fig. S3 shows funding per grantee increased for all ages from 2000 to 2005. Correlation coefficients of number of R01 grantees and their total funding are 0.98, 0.96, and 0.67 for older, middle-aged, and younger grantees, respectively (Fig. S4). The low correlation of 0.67 shows that more funding does not directly lead to additional younger R01 grantees.
Fig. S3.
This figure shows the variation with year of the annual funding per R01 grantees in each of the three age ranges. This funding in inflation-corrected (BRDPI) dollars has been surprisingly constant for each range at 0.49 ± 0.05, 0.65 ± 0.07, and 0.70 ± 0.07 M$ for under 46, between 46 and 55, and over 55, respectively, with a SD that is almost exactly 10% in each case. When the congressional appropriation doubled between 1999 and 2005, funds for each age range increased by 20%, 13%, and 10% for under 46, between 46 and 55, and over 55, respectively. Despite the greater allocation of funds to under 46, the decrease in their numbers continued unabatedly (Fig. 4).
Fig. S4.
This figure shows the relationship between the funds allocated to R01 grantees and the number of R01 grantees. These two datasets would be perfectly correlated if all grantees in a particular age group received the same allocation in BRDPI inflation-corrected dollars for each of the years from 1980 to 2014. The Inset correlation coefficient (CC) is that between R01 funding (squares) and number of R01 grantees (circles) in each of the three age ranges. Because grantees get grants that are close to 1 M$, the same x axis can be used for both numbers of R01 grantees and funding in million dollars. A shows the data of older grantees. B shows the data of middle-aged grantees. C shows the data of younger grantees.
Time Lag for Basic-Science PIs.
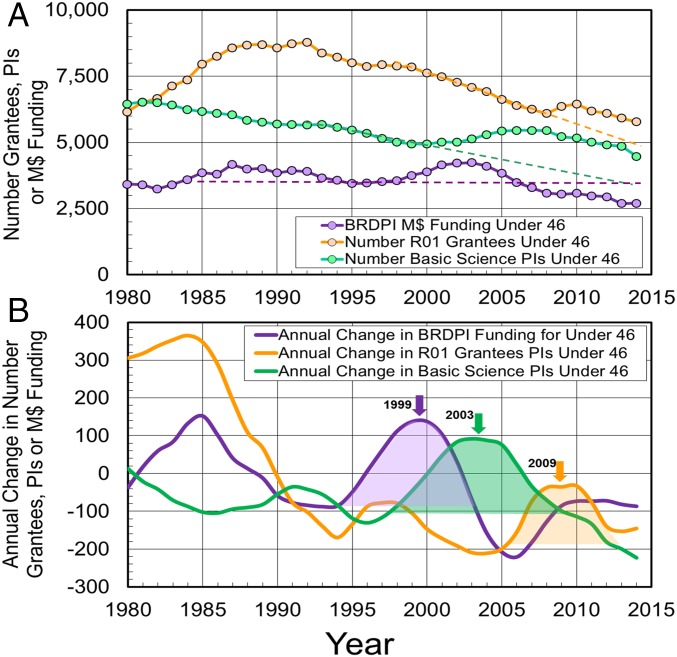
We focus on basic-science PIs as they need to find almost twice as much salary from grants (ref. 13; 50% rather than 25%). Fig. 4A shows that, although R01 funds allocated to PIs below 46 was relatively constant, the number of younger R01 grantees fell dramatically from 8,782 in 1992 to 5,780 in 2014 (drop of 3,002 grantees or 34%). Closer analysis shows that the fall in R01 grantees from 1992 was halted by an increase of 750 grantees from 2008 to 2010, whereas the fall in number of basic-science PIs was halted by a large increase of 1,063 PIs from 2002 to 2004, 6 y earlier than the increase in R01 grantees (Fig. 4B). What is surprising is that the new PIs were hired 6 y before most of them got R01 grants (750/1,063 or 71%). Hiring of almost 1,200 young PIs was likely encouraged by the increase in funds that peaked in 1999 (Fig. 3A). When these PIs needed R01 funding from 2008 to 2010, the allocation increased for them, although the NIH appropriation was already falling. The 10-y lag time between jump in appropriation and funding of younger PIs is due to the careful screening of tenure-track academic appointees. Thus, it is very difficult to increase the numbers of young basic-science PIs by a burst of added funding.
Fig. 4.
Focus on younger grantees and basic-science PIs. (A) Funding from Congress for under 46 y olds (<46), the numbers of R01 grantees under 46 and the numbers of basic-science PIs under 46 between 1980 and 2014 (dashed lines emphasize trends). (B) Annual change of each of the quantities shown in A, smoothed over 5 y. There is a large jump in funding (purple-shaded peak centered at 1999). This lead to a jump of 1,063 in the number of new basic-science PIs (green-shaded peak centered at 2003). These new basic-science PIs applied for R01 grants, leading to a jump of 750 in the number of grantees (orange-shaded peak centered at 2009).
Success Rates.
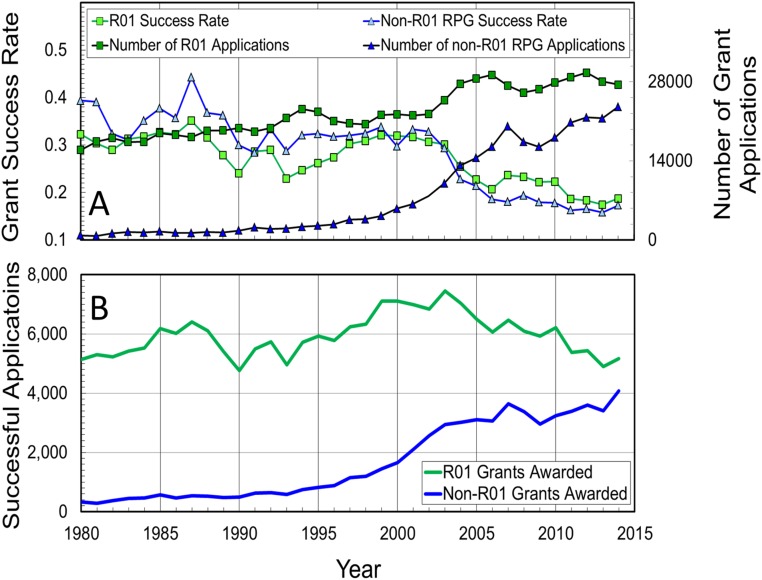
Conventional success rates for NIH grants, published by the NIH, measure the fraction of applications that are funded. This value depends on the number of applications, the scores assigned by study sections, and the total fund allocations. Since 1980, the published success rates for both R01 and non-R01 research program grants (RPGs) dropped from close to 40% to below 20% (Fig. S5A). In this period, the number of R01 grant applications increased by 73% from 15,919 to 27,502, whereas the number for non-R01 grant applications increased by 2,760% from 825 to 23,571. For R01 grantees, the number of successful applications hardly changed between 1980 and 2014 (5,143–5,163), whereas for non-R01 grantees in the same period the number of successful applications increased 12.5-fold, from 325 to 4,078 (Fig. S5B). From 1980 to 2014, total non-R01 NIH RPG funds increased fourfold, from 1,321 M$ to 5,381 M$ (Table S1).
Fig. S5.
(A) Shown is the conventional NIH success rate for R01 and non-R01 RPG grants from 1980 to 2014. The number of applications for both types of grants is shown on the right-hand axis. (B) Shown is the number of grants awarded for both types of grants. For R01 awards, the 40% rise in number of applications between 1990 and 2014 did not lead to an increase in the number of successful applications, which was steady at 5,952 ± 697. For non-R01 RPG awards, number of successful applications did increase sharply from 645 in 1990 to 4,078 in 2014, a 530% increase. The values for R01 success rates are from https://www.report.nih.gov/success_rates/index.aspx. Data for RPG grants were kindly provided through a Freedom of Information Act request.
Table S1.
Change of total NIH budget
| Budget item | Amount in BRDPI million $ | Percent of total NIH budget | ||||
| Ave, 1996 | Ave, 2013 | Ratio, % | Ave, 1996 | Ave, 2013 | Ratio, % | |
| Total training | 737 | 763 | 103.5 | 3.5 | 2.5 | 71.3 |
| Administration | 1,341 | 2,311 | 172.3 | 6.3 | 7.5 | 118.8 |
| Intramural research | 2,387 | 3,422 | 143.4 | 11.3 | 11.1 | 98.9 |
| R and D contracts | 1,450 | 3,015 | 207.9 | 6.8 | 9.8 | 143.4 |
| Centers and other research | 2,950 | 4,760 | 161.4 | 13.9 | 15.5 | 111.2 |
| Total non-R01 RPG | 3,347 | 5,843 | 174.6 | 15.8 | 19 | 120.4 |
| Total R01 grants | 8,978 | 10,622 | 118.3 | 42.4 | 34.6 | 81.6 |
| All items | 21,190 | 30,737 | 145.1 | 100 | 100 | 100 |
The 3-y average of NIH budget items change from 1996 (average 1995–1997) to 2013 (average 2012–2014). Values and percentage ratios are given for the amount in BRDPI-corrected million dollars and as a percentage of the total NIH budget. As a percentage of total, four items, R and D contracts, centers and other research, administration, and non-R01 RPG grants, increased by 43%, 11%, 19%, and 20%, respectively. Two other items, R01 grants and training, decreased by 18% and 29%, respectively.
The PI Success Ratio.
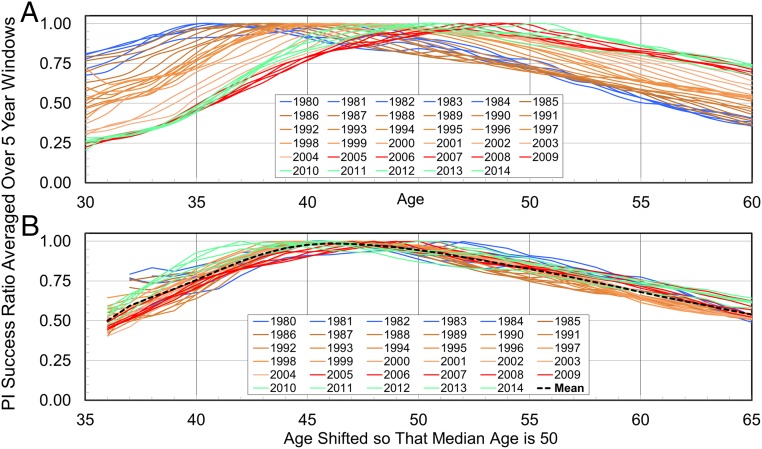
Success rates do not indicate the relative success of PIs of different ages, so we introduce a measure based on the fraction of PIs being funded. Our “PI success ratio” is defined for a particular 5-y range as the number of R01 grantees of that age divided by the number of basic-science PIs of that same age. To smooth the data, we average both sets of numbers over a centered window of 5 y. The age variation of the PI success ratio shows the chance of PIs of different ages becoming R01 grantees. We know that the basic-science PIs are just a small part of the potential applicants for R01 funding, but they are particularly dependent on such funding for their salary support (13). Their overall numbers follow the fluctuations in number of R01 grantees more closely than do the generally increasing numbers of clinical-science PIs (Fig. 2B).
Fig. 5A shows how the PI success ratio is highest for PIs who are neither younger nor older. What is surprising is that, since 1982, the age range of these more successful PIs has shifted to higher ages. This means that the PI success ratio below age 40 has decreased with time, whereas that above age 55 has increased. If we shift the curves using the median R01 grantee age (Fig. 1), they superimpose well (Fig. 5B). This similarity of the age variation of the ratio of number of R01 grantees to number of basic-science PIs persisted over 30 y, whereas the profiles of numbers of grantees and basic-science PIs change substantially (Fig. S2).
Fig. 5.
The PI success ratio. A shows that, since 1980, the PI success ratio, defined as the ratio of the number of R01 grantees to the number of basic-science PIs of the same age in the same 5-y range, has dropped for PIs younger than 40 and increased for PIs older than 50 (years are blue to green lines). Each curve is normalized to have a maximum value of 1.00. B shows these same curves shifted along the x axis so that the median age of a R01 grantee is 50 (average median age for 2008–2014) using median grantee ages from Fig. 1. Note how the green lines for years 2010–2014 have risen noticeably for PIs younger than 45, rising well above the mean level. This is likely due to boosting of early-stage investigators (ESIs) implemented by NIH after 2008 (27).
The PI success ratio will be known to any basic-science department as it can be estimated by the fraction of their colleagues of the age group having R01 funding in a particular year. As such, it will discourage hiring of young faculty whose PI success ratio is low and dropping. It will also encourage retaining older faculty whose PI success ratio is high and rising. Even if such a bias were to be small, over a 35-y period, it would change the age profiles of basic-science PIs from that of 1980 to what we see in 2014, causing a large drop in faculty under 40 y of age and a large increase in faculty over 60 y of age.
Fig. 5B shows that, since 2010, younger grantees have started doing better. The NIH implemented its ESI policy in 2008 (27). We are encouraged that ESI policy has increased the PI success ratio for younger grantees as it confirms the validity of our measure. The NIH ESI correction is effective but may need to be larger for those under 40 y. Specifically, the mean PI success ratio in Fig. 5B varies from 0.5 at age 36 to a maximum of 1.0 at age 39. The ESI correction needs to be large, doubling the effective success rate of 36 y olds, increasing it by 33% at age 40 and increasing it by 5% at age 44. Although older PIs also have lower success ratios, their ratios are increasing with time, whereas those of the younger PIs are decreasing.
Discussion
Value of Fundamental Research.
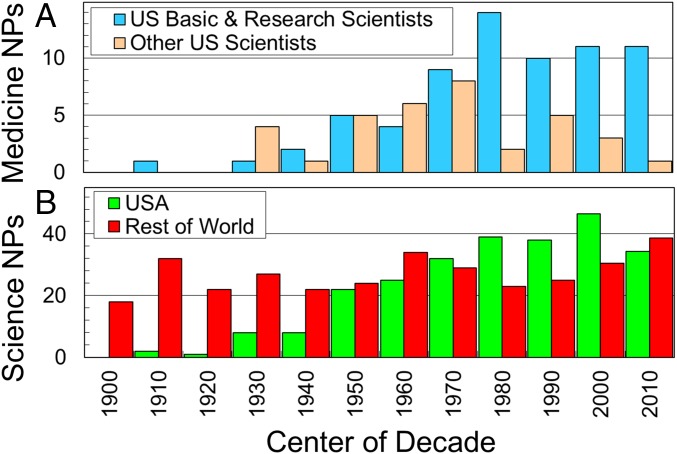
Measuring the economic value of fundamental, curiosity-driven, research is difficult (28–31), so we use Nobel Prizes as a proxy; they are generally given for fundamental discoveries with high value and impact. Fig. 6A shows how US basic scientists, who receive a higher proportion of R01 grants, dominate US medicine prizes. Fig. 6B shows that, in the decade 2006–2015, the United States lost its world lead that was held since 1976. Given that Nobel Prize-winning work is often done by scientists below the age of 46 (3, 10, 12), we worry about future consequences of the steady drop in younger US basic-science PIs seen since 1992.
Fig. 6.
Number of Nobel Prizes (NPs) per decade since 1896. (A) US scientists in basic sciences (medical school departments or research institutes) won more Nobel Prizes in Medicine than other US scientists between 1986 and 2015. (B) In each of the three decades from 1986 to 2005, the United States won more science Nobel Prizes (Physics, Medicine, Chemistry) than the rest of the world. This domination ended in the most recent decade, 2006–2015.
What Did Not Cause the Drop in Number of Young Basic-Science PIs?
Four factors that may seem obvious are not supported here: (i) Congress is giving the NIH enough money. From 1999 to 2014, the NIH received an extra 100,000 M$ in congressional appropriation (Fig. 3A), but since 2005, total funds dropped. (ii) The R01 appropriation has increased. From 1995 to 2014, the annual inflation-corrected allocation for R01 grants increased from 8,978 M$ to 10,622 M$, or by 17% (Table S1). (iii) Medical schools still want to hire young basic-science PIs. From 2002 to 2004, almost 1,100 younger basic scientists were hired when NIH funding rose rapidly (Fig. 4). (iv) Young PIs need R01 funding. Fig. 4 shows that 70% of the basic-science PIs added from 2002 to 2004, got R01 grants 6 y later, although congressional funding had fallen by then.
What Contributed to the Drop in Basic-Science PI Numbers?
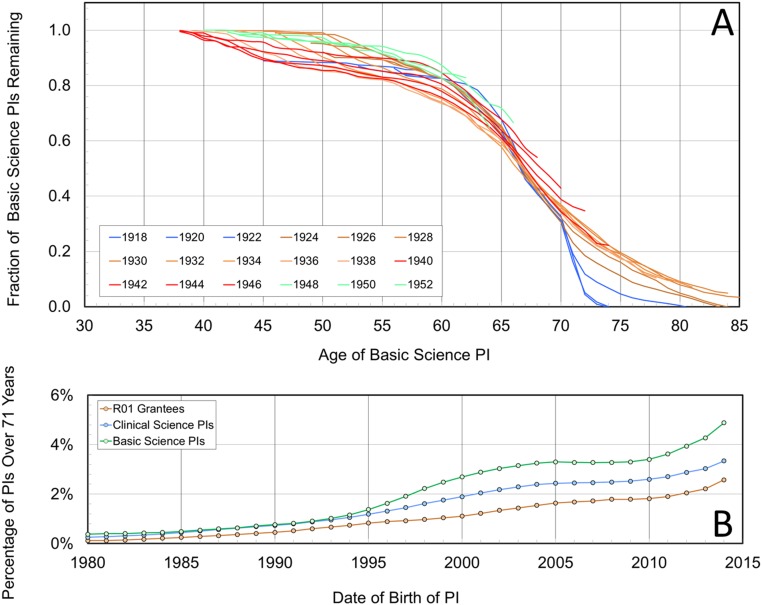
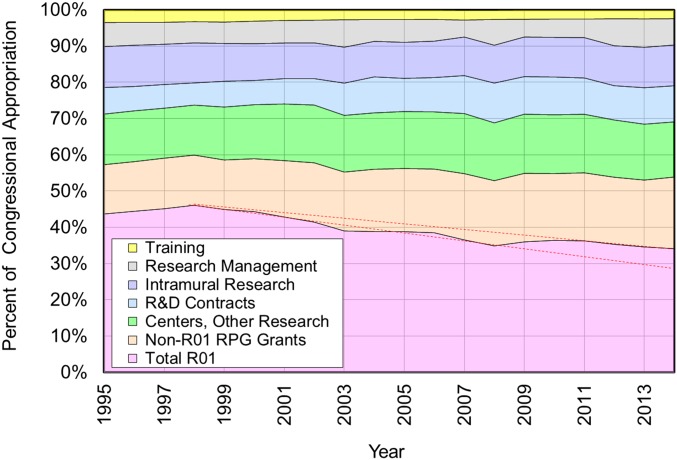
Three additional factors may be relevant but are not sufficient: (v) Too many potential PIs are postdoctoral scholars or research associates. In 2009, 32,672 postdoctoral scholars and 32,041 graduate researchers were on R01 grants (15). These days, postdoctoral scholars stay on longer than in the past (32). (vi) Older PIs are not retiring. Fig. S6B shows that the number of basic-science PIs older than 71 has grown rapidly from 1% in 1995 to 5% in 2014. The percentage of R01 grantees over 71 is about one-half of the percentage for basic-science PIs. (vii) NIH’s budget is going to non-R01 research. In 1996, R01 research funds were 16% larger than total non-R01 research funds (R and D contracts, centers, and other research, non-R01 grants). By 2014, they were 22% smaller (Table S1 and Fig. S7).
Fig. S6.
This figure shows the influence of age on the fraction of number of PIs born in a given year remaining on at a particular age. To tabulate data by PI Birth_Year rather than by PI age and year of analysis, we used the simple transformation: , with data smoothed by averaging over a 5-y window. Data are shown for basic-science PIs born between 1918 and 1952, a group of PIs who turned, or who will turn, 70 y of age between 1988 and 2022. A shows that there is a clear difference between the retirement of PIs at age 70 for PIs born before 1924 and for those born afterward. This is completely expected as compulsory retirement at 70 was discontinued in 1994 (65). Those PIs born in 1924 turn 70 in 1994. B shows that as a result of the change in retirement policy the percentage of basic-science PIs older than 71 is 4.9% in 2014 compared with an average percentage of just 0.6% for the years 1980–1993; pair is (4.9%,0.6%). The corresponding pairs of percentage values are (3.3%,0.6%) and (2.6%,0.3%) for clinical-science PIs and R01 grantees, respectively. The steep rise in the three curves for R01 grantees, clinical-science PIs, and basic-science PIs after 2010 suggests that this is caused by people younger than 71 in the pipeline. It leads us to believe that it would be relatively easy to predict demographic changes like these.
Fig. S7.
This figure shows how NIH budget line items expressed as a percentage of the total appropriation have changed between 1995 and 2014. Seven items are considered in the legend; they constitute the entire congressional appropriation, so their total is always 100%. The same data are used in Table S1. Here, we see that the percentage of the allocation for R01 grants dropped sharply from a high of 46% in 1998 to a low of 34% in 2014. This occurred as other non-R01 grant programs were ramped up to absorb the huge increase in congressional appropriation that occurred from 1999 to 2004. The red dashed lines show that, in 2008, the allocation percentage for R01 grants was increased as competition for dwindling R01 funds became intense. Had this not happened, the percentage allocation for R01 grants in 2014 would have been 5% lower at 29%.
What Really Caused the Drop in Number of Young Basic-Science PIs?
Our study points to two factors as possible culprits: (viii) Older R01 grantees are getting money at the expense of younger R01 grantees. From 1995 to 2014, allocation for grantees over 55 increased by 2,500 M$, whereas for grantees under 56 it increased by 350 M$ (Fig. 3C), possibly due to the fact that those over 55 are getting more R01 money (33, 34). (ix) NIH study sections are biased against those whose ages are very different from the median age of R01 grantees. The PI success ratio clearly shows that fewer and fewer basic-science PIs younger than 46 are awarded R01 grants (Fig. 5). It is unlikely that this occurs because younger PIs are less capable than they were years ago. The few younger PIs hired from a huge pool of candidates, suggests they are more capable.
What Is the Remedy?
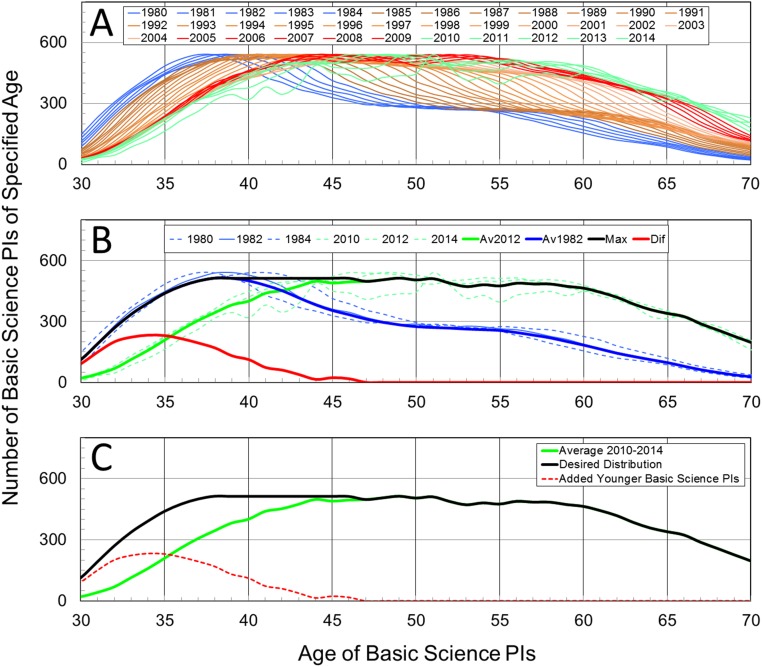
The two most probable factors (viii and ix) for the drop in numbers of basic-science PIs involve funding allocation and the peer review system. The aging of basic-science faculty did not have to lead to the observed depletion of PIs under 46 (Fig. 2C). Maintaining the age profile for younger PIs seen in 1980 would require an additional 2,255 basic-science PIs aged 45 or less (Fig. 7). Funding these 14% additional PIs would cost 1,067 M$. This could be provided as additional funds or by reducing the current R01 funding of all older PIs by 12%.
Fig. 7.
Correcting the age distribution. Adding 2,255 more young basic-science PIs to obtain as many young PIs as there were in 1980 (Fig. S8).
Fig. S8.
The change of the age distribution of basic-science PIs with year of analysis (Fig. S2) is used to derive an age distribution that does not bias against younger PIs. A shows the age distribution of the number of basic-science PIs for years of analysis between 1980 and 2014 normalized to have the same maximum value in any year of 541 (this is the actual maximum value for the Ave2012 distribution and close to 533, the maximum value for the Ave1982 distribution; see below). B shows in blue the distributions for the 5 earliest years of analysis (1980, 1981, 1982, 1983, and 1984), and in green, the distributions for 5 most recent years of analysis (2010, 2011, 2012, 2013, and 2014), together with the average distribution for each of these 5-y periods: Ave1982 (blue) and Ave2012 (green). The maximum of the two average distributions is calculated after normalizing their maximum values to 514, which is the actual value for Ave2012 and 3.52% less than the actual value of 533 for Ave1982. Having the same maximum value produces the flat-topped combined distribution shown in black. The total number of basic-science PIs in the Ave2013 distribution is 16,068, the average of the number of basic-science PIs for the most recent 5 y. The total number of desired basic-science PIs in the combined distribution is higher at 18,323. This increase of 14.0% comprises 2,255 basic science, all of whom are younger than 45 (red). Because R01 grantees younger than 46 receive less money per year than older R01 grantees, these additional PIs could be funded by a 1,000 $M or 12% transfer of R01 funding from PIs above 46 y to PIs below the age of 46. C shows the key features on B and is shown in the main text as Fig. 7.
Since 2016, NIGMS, which funds a lot of basic science, initiated the MIRA program. MIRA transfers funds from older PIs to younger PIs in exchange for more stable funding. It is interesting that the amount transferred is between 10% and 15%, in close accord with our detailed estimate. Although R01 grants to basic-science PIs do also come from other NIH institutes, this is a very encouraging initiative. An extra 1,000 M$ is less than 4% of the total NIH budget and a small fraction of the additional funds given to non-R01 grantees.
The peer review system has an unanticipated defect: as the median age of R01 grantees increases, so does the median age of study section members. Most groups seem best able to judge those of comparable age and experience. This cannot help but lead to an unconscious but persistent bias against the young. It can only be corrected by taking administrative action.
Since 2008, the NIH used its ESI policy to administratively raise the success rate of younger PIs. Our study confirms the ESI is essential if we are to save the R01 grant mechanism with its long history, prestige, and focus on individual investigators, and critical importance for fundamental, discovery-driven, basic science research. We believe that NIH program officers should use a formula calculated from the PI success ratio to change the percentile threshold in an age-dependent manner so as to correct the intrinsic age-related bias.
There may be concerns about the danger of funding young people who have scored poorly. A very detailed study shows that percentile scores cannot predict the productivity of almost 7,000 National Heart, Lung, and Blood Institute grants (35). In contrast to work Li and Agha (36, 37), Lauer et al. (38) showed that study section scores are not discriminating predictors for proposals (39).
Three other factors (v, vi, and vii) are also worth considering. Increasing opportunities for young basic-science PIs by remedying factors viii and ix will require better mentoring as discussed by many (40–45). Factor v suggests increasing the number of K99 postdocs (40) who are funded individually and not through the R01 grants of their supervisor. They would be mentored to have a project they take with them, to write sole-author papers, and to attend conferences as speakers. As so much of the R01 award is spent on postdoctoral scholars and research associates (15), human resource development may need to be a factor in competitive grant renewal.
The rapid rise in basic-science PIs over 71 (factor vi) may be limited by the NIGMS MIRA R35 program as well as by a greater awareness of the responsibility to nurture a younger generation.
Moving of funds away from R01 grants (factor vii) was a predictable result (46) of the sudden doubling of the NIH budget in 1999. Our data favor sustained future funding coupled with restored funding to basic science research that served US medical science so well for four decades (Fig. 6) (28–31).
In eight consensus recommendations for sustained biomedical research (47), five deal with postdoctoral scholars or research associates and three deal with sustained funding, increased funding, and less regulation. Our concerns are not mentioned. Fund transfer to younger PIs by MIRA grants has received little attention (33, 34, 48–50). Peer review age bias as corrected by the NIH ESI program has been noted (3, 9, 51–54). Group size has been considered; today, it need not be as large as when US science was expanding (55–57).
Conclusions
Although many schemes have been suggested (18, 46, 58–63), increasing the number of young basic-science PIs is not going to be easy. As basic sciences contributed so much to US Nobel Prizes in Medicine since 1950 (Fig. 6A), new fundamental discoveries made by young PIs in the United States are vital for future breakthroughs in biomedicine. We see no alternative but to increase the number of basic scientists younger than 46 y of age. Essential is the NIH ESI program, which should be strengthened using an age-related correction. Essential too is the NIGMS MIRA initiative to find funds for added young PIs: it should be adopted more broadly by NIH.
The problems highlighted here were first noticed in 1994 (18). They result from positive feedback in a self-regulating system like peer review and prove the need for administrative oversight. Proper statistical data are also essential: we hope that the NIH will conduct studies like this on a regular basis using accurate anonymized data. We also hope that existing PIs over the age of 55 will realize how fortunate they were in their youth and help younger PIs by mentoring them for independence and originality.
SI Materials and Methods
The data produced by the Perl program described below was imported into an Excel 2010 spreadsheet and used for all subsequent analysis. This spreadsheet, which is used to draw every graph and table presented here, is made available in Dataset S1. The pseudocode for the Perl program is available in Dataset S2. We also make the input files R01_PIs_v2.txt and AAMC_FiscalYear_All_tabbed.txt available in Datasets S3 and S4.
Data Sources
Age profiles of the number R01 grantees from 1980 to 2010 initially come from https://nexus.od.nih.gov/all/2012/02/13/age-distribution-of-nih-principal-investigators-and-medical-school-faculty/. Data were downloaded from age distribution (absolute numbers) of NIH R01 principal investigators (https://report.nih.gov/DisplayRePORT.aspx?rid=877). Additional R01 data (2010–2014) came from NIH under Freedom of Information Act (FOIA).
Age distributions (absolute numbers and percentages) of medical school faculty (AAMC) (https://report.nih.gov/DisplayRePORT.aspx?rid=878). Age profiles of AAMC faculty and augmented by detailed data obtained from the AAMC under a IRB agreement. These data includes faculty rank and basic- or clinical-science department.
The congressional appropriation for NIH was taken from the NIH website, https://www.nih.gov/about/almanac/appropriations/index.htm.
It was corrected for inflation to 2014 dollars using the biomedical research and development price index (BRDPI), https://officeofbudget.od.nih.gov/gbipriceindexes.html.
Total NIH spending on extramural research program grants (RPGs) came initially from https://report.nih.gov/FileLink.aspx?rid=888. Data from 1980 to 1997 came from NIH by FOIA.
US Nobel Prize winners are defined as basic science using their affiliations at time of award from www.nobelprize.org/nobel_prizes/lists/universities.html.
US and World counts of Nobel Prize winners are counted from www.nobelprize.org/nobel_prizes/medicine/laureates/.
Key to Excel Spreadsheet Tabs
Inflation Indices TAB.
CPI data from https://data.bls.gov:443/cgi-bin/surveymost
BRDPI data from https://officeofbudget.od.nih.gov/gbipriceindexes.html.
CongressionalAppropriation Tab.
Funds Tab.
FOIA 44721 Proportion R01 $ by age.xlsx.
NIHBudgetHistory Tab.
NIH budget mechanism detail, FY 1995–2000 https://report.nih.gov/nihdatabook/charts/Default.aspx?chartId=226&catId=1
NIH budget mechanism detail, FY 2001–2014 https://report.nih.gov/NIHDatabook/Charts/Default.aspx?chartId=153&catId=1.
FIR_R01 Tab.
Data was extracted from figure 1 of ref. 16 using the WebPlotDigitizer App, available at http://arohatgi.info/WebPlotDigitizer/app/.
BergPercent Tab.
Table218 Tab.
Tab218Fix Tab.
Fix some improperly formatted numbers with spaces.
d2 Tab.
File of averaged data ratios and attrition produced by Perl code.
Supplementary Material
Acknowledgments
M.L. is the Robert W. and Vivian K. Cahill Professor of Cancer Research.
Footnotes
The authors declare no conflict of interest.
This article contains supporting information online at www.pnas.org/lookup/suppl/doi:10.1073/pnas.1609996114/-/DCSupplemental.
References
- 1.Kaiser J. Biomedical research. The graying of NIH research. Science. 2008;322:848–849. doi: 10.1126/science.322.5903.848. [DOI] [PubMed] [Google Scholar]
- 2.Alexander H, Liu CQ. The aging of full-time U.S. medical school faculty: 1967–2007. AAMC Analysis in Brief. 2009;9:1–12. [Google Scholar]
- 3.Matthews KRW, Calhoun KM, Lo N, Ho V. The aging of biomedical research in the United States. PLoS One. 2011;6:e29738. doi: 10.1371/journal.pone.0029738. [DOI] [PMC free article] [PubMed] [Google Scholar]
- 4.White JC, Rush M, Schaffer WT. Biomedical Research Workforce Working Group Report. National Institutes of Health; Bethesda, MD: June 14, 2009. [Google Scholar]
- 5.Arbesman S, Wray K. Demographics and the fate of the young scientist. Soc Stud Sci. 2013;43:282–286. [Google Scholar]
- 6.LaBeaud AD, McKeating H. The largest drought in American history: Funding for science is drying up. PLoS Negl Trop Dis. 2013;7:e2351. doi: 10.1371/journal.pntd.0002351. [DOI] [PMC free article] [PubMed] [Google Scholar]
- 7.Harris A. October 3, 2014. Young, brilliant and underfunded. NY Times, Section A, p 27.
- 8.Kaiser J. Biomedical research. A call for NIH youth movement. Science. 2014;346:150–151. doi: 10.1126/science.346.6206.150. [DOI] [PubMed] [Google Scholar]
- 9.Daniels RJ. A generation at risk: Young investigators and the future of the biomedical workforce. Proc Natl Acad Sci USA. 2015;112:313–318. doi: 10.1073/pnas.1418761112. [DOI] [PMC free article] [PubMed] [Google Scholar]
- 10.Jones BF. Age and great invention. Rev Econ Stat. 2010;92:1–14. [Google Scholar]
- 11.Liu C, Alexander H. The changing demographics of full-time U.S. medical school faculty, 1966–2009. Analysis in Brief. 2011;11:1–2. [Google Scholar]
- 12.Jones BF, Weinberg BA. Age dynamics in scientific creativity. Proc Natl Acad Sci USA. 2011;108:18910–18914. doi: 10.1073/pnas.1102895108. [DOI] [PMC free article] [PubMed] [Google Scholar]
- 13.Levine AS, et al. Research in academic medical centers: Two threats to sustainable support. Sci Transl Med. 2015;7:289fs22. doi: 10.1126/scitranslmed.aac5200. [DOI] [PubMed] [Google Scholar]
- 14. DrugMonkey (March 25, 2014) The K99/R00 is not some sort of unfair distortion of the academic job market. Available at drugmonkey.scientopia.org/2014/03/25/the-k99r00-is-not-some-sort-of-unfair-distortion-of-the-academic-job-market/. Accessed May 14, 2017.
- 15.Pool LR, et al. Size and characteristics of the biomedical research workforce associated with U.S. National Institutes of Health extramural grants. FASEB J. 2016;30:1023–1036. doi: 10.1096/fj.14-264358. [DOI] [PMC free article] [PubMed] [Google Scholar]
- 16.Rockey SJ. February 3, 2012 Our commitment to supporting the next generation. Rock Talk. Available at https://nexus.od.nih.gov/all/2012/02/03/our-commitment-to-supporting-the-next-generation/. Accessed May 14, 2017.
- 17.Califf RM, et al. 2014 Physician-Scientist Workforce (PSW) Report. Available at https://report.nih.gov/workforce/psw/appendix_iv_a1_1.aspx. Accessed May 14, 2017.
- 18.Tilghman SM, et al. The Funding of Young Investigators in the Biological and Biomedical Sciences. National Research Council; Washington, DC: 1994. [PubMed] [Google Scholar]
- 19.Holden C. The incredible aging investigator. Science. 2008;319:391. [Google Scholar]
- 20.Kaiser J. National Institutes of Health. Zerhouni’s parting message: Make room for young scientists. Science. 2008;322:834–835. doi: 10.1126/science.322.5903.834. [DOI] [PubMed] [Google Scholar]
- 21.Gingras Y, Larivière V, Macaluso B, Robitaille JP. The effects of aging on researchers’ publication and citation patterns. PLoS One. 2008;3:e4048. doi: 10.1371/journal.pone.0004048. [DOI] [PMC free article] [PubMed] [Google Scholar]
- 22.Schafer AI. The vanishing physician-scientist? Transl Res. 2010;155:1–2. doi: 10.1016/j.trsl.2009.09.006. [DOI] [PMC free article] [PubMed] [Google Scholar]
- 23.Adams CW. The age at which scientists do their best work. Isis. 1946;36:166–169. [PubMed] [Google Scholar]
- 24.Godin B. On the origins of bibliometrics. Scientometrics. 2006;68:109–133. [Google Scholar]
- 25.Rockey SJ. February 13, 2012 Age distribution of NIH principal investigators and medical school faculty. Rock Talk. Available at https://nexus.od.nih.gov/all/2012/02/13/age-distribution-of-nih-principal-investigators-and-medical-school-faculty/. Accessed May 14, 2017.
- 26.Shaffer WA. (2012) Age Distribution – AAMC Medical School Faculty and NIH R01 Principal Investigators. Available at https://report.nih.gov/UploadDocs/age_distribution_aamc_faculty_and_nih_r01_1980_to_2010.ppt). Accessed May 14, 2017.
- 27. National Institutes of Health (2016) NIH New and Early Stage Investigator Policies. Available at https://grants.nih.gov/policy/new_investigators/index.htm. Accessed May 14, 2017.
- 28.Moses H, 3rd, Martin JB. Biomedical research and health advances. N Engl J Med. 2011;364:567–571. doi: 10.1056/NEJMsb1007634. [DOI] [PubMed] [Google Scholar]
- 29.Press WH. Presidential address. What’s so special about science (and how much should we spend on it?) Science. 2013;342:817–822. doi: 10.1126/science.342.6160.817. [DOI] [PubMed] [Google Scholar]
- 30.Tessier-Lavigne M, Vagelos PR, Zerhouni E. March 6, 2013 Legendary drug industry executives warn U.S. science cuts endanger the future. Forbes. Available at https://www.forbes.com/sites/matthewherper/2013/03/06/drug-industry-greats-say-the-u-s-must-reverse-the-cuts-to-our-investment-in-science/#4e8899d23d3e. Accessed May 14, 2017.
- 31.Williams RS, Lotia S, Holloway AK, Pico AR. From scientific discovery to cures: Bright stars within a galaxy. Cell. 2015;163:21–23. doi: 10.1016/j.cell.2015.09.007. [DOI] [PubMed] [Google Scholar]
- 32.Stephan P, Ma J. The increased frequency and duration of the postdoctorate career stage. Am Econ Rev. 2005;95:71–75. [Google Scholar]
- 33.Berg J. September 27, 2010 Measuring the scientific output and impact of NIGMS grants. Feedback Loop. Available at https://loop.nigms.nih.gov/2010/09/measuring-the-scientific-output-and-impact-of-nigms-grants/. Accessed May 14, 2017.
- 34.Lorsch JR. Maximizing the return on taxpayers’ investments in fundamental biomedical research. Mol Biol Cell. 2015;26:1578–1582. doi: 10.1091/mbc.E14-06-1163. [DOI] [PMC free article] [PubMed] [Google Scholar]
- 35.Doyle JM, et al. Association of percentile ranking with citation impact and productivity in a large cohort of de novo NIMH-funded R01 grants. Mol Psychiatry. 2015;20:1030–1036. doi: 10.1038/mp.2015.71. [DOI] [PMC free article] [PubMed] [Google Scholar]
- 36.Li D, Agha L. Research funding. Big names or big ideas: Do peer-review panels select the best science proposals? Science. 2015;348:434–438. doi: 10.1126/science.aaa0185. [DOI] [PubMed] [Google Scholar]
- 37.Mervis J. Scientific publishing. NIH’s peer review stands up to scrutiny. Science. 2015;348:384. doi: 10.1126/science.348.6233.384. [DOI] [PubMed] [Google Scholar]
- 38.Lauer MS, Danthi NS, Kaltman J, Wu C. Predicting productivity returns on investment: Thirty years of peer review, grant funding, and publication of highly cited papers at the National Heart, Lung, and Blood Institute. Circ Res. 2015;117:239–243. doi: 10.1161/CIRCRESAHA.115.306830. [DOI] [PMC free article] [PubMed] [Google Scholar]
- 39.Fang FC, Bowen A, Casadevall A. NIH peer review percentile scores are poorly predictive of grant productivity. eLife. 2016;5:e13323. doi: 10.7554/eLife.13323. [DOI] [PMC free article] [PubMed] [Google Scholar]
- 40.National Research Council; Committee on Bridges to Independence: Identifying Opportunities for and Challenges to Fostering the Independence of Young Investigators in the Life Sciences . Bridges to Independence: Fostering the Independence of New Investigators in Biomedical Research. National Academies Press; Washington, DC: 2005. [Google Scholar]
- 41.National Research Council . Research Training in the Biomedical, Behavioral, and Clinical Research Sciences. National Academies Press; Washington, DC: 2011. [PubMed] [Google Scholar]
- 42.Bourne HR. A fair deal for PhD students and postdocs. eLife. 2013;2:e01139. doi: 10.7554/eLife.01139. [DOI] [PMC free article] [PubMed] [Google Scholar]
- 43.Rockey SJ. Mentorship matters for the biomedical workforce. Nat Med. 2014;20:575. doi: 10.1038/nm0614-575. [DOI] [PMC free article] [PubMed] [Google Scholar]
- 44.Powell K. The future of the postdoc. Nature. 2015;520:144–147. doi: 10.1038/520144a. [DOI] [PubMed] [Google Scholar]
- 45.Tilghman SM, et al. 2012 Biomedical Research Workforce Working Group Report. Available at https://acd.od.nih.gov/biomedical_research_wgreport.pdf. Accessed May 14, 2017.
- 46.Korn D, et al. Science policy. The NIH budget in the “postdoubling” era. Science. 2002;296:1401–1402. doi: 10.1126/science.1072486. [DOI] [PubMed] [Google Scholar]
- 47.Pickett CL, Corb BW, Matthews CR, Sundquist WI, Berg JM. Toward a sustainable biomedical research enterprise: Finding consensus and implementing recommendations. Proc Natl Acad Sci USA. 2015;112:10832–10836. doi: 10.1073/pnas.1509901112. [DOI] [PMC free article] [PubMed] [Google Scholar]
- 48.Preusch PC. Three new grant programs offered by the National Institute of General Medical Sciences. J Biomol Struct Dyn. 2015;33:1–2. [Google Scholar]
- 49.Kaiser J. No-strings awards at NIH draw concern. Science. 2016;352:20. doi: 10.1126/science.352.6281.20. [DOI] [PubMed] [Google Scholar]
- 50.Deng B. NIH ponders “emeritus grants.”. Nature. 2015;518:146–147. doi: 10.1038/518146a. [DOI] [PubMed] [Google Scholar]
- 51.Kimble J, et al. Strategies from UW-Madison for rescuing biomedical research in the US. eLife. 2015;4:e09305. doi: 10.7554/eLife.09305. [DOI] [PMC free article] [PubMed] [Google Scholar]
- 52.Costello LC. Perspective: Is NIH funding the “best science by the best scientists”? A critique of the NIH R01 research grant review policies. Acad Med. 2010;85:775–779. doi: 10.1097/ACM.0b013e3181d74256. [DOI] [PubMed] [Google Scholar]
- 53.Azoulay P, Graff Zivin JS, Manso G. National Institutes of Health peer review: Challenges and avenues for reform. Innov Policy Econ. 2013;13:1–22. [Google Scholar]
- 54.Day TE. The big consequences of small biases: A simulation of peer review. Res Policy. 2015;44:1266–1270. [Google Scholar]
- 55.Alberts BM. Limits to growth: In biology, small science is good science. Cell. 1985;41:337–338. doi: 10.1016/s0092-8674(85)80001-5. [DOI] [PubMed] [Google Scholar]
- 56.Lauer MS. Personal reflections on big science, small science, or the right mix. Circ Res. 2014;114:1080–1082. doi: 10.1161/CIRCRESAHA.114.303627. [DOI] [PMC free article] [PubMed] [Google Scholar]
- 57.Cook I, Grange S, Eyre-Walker A. Research groups: How big should they be? PeerJ. 2015;3:e812v1. doi: 10.7717/peerj.989. [DOI] [PMC free article] [PubMed] [Google Scholar]
- 58.Zerhouni EA. Research funding. NIH in the post-doubling era: Realities and strategies. Science. 2006;314:1088–1090. doi: 10.1126/science.1136931. [DOI] [PubMed] [Google Scholar]
- 59.Kaiser J. Biomedical research. Rejecting “big science” tag, Collins sets five themes for NIH. Science. 2009;325:927. doi: 10.1126/science.325_927a. [DOI] [PubMed] [Google Scholar]
- 60.Collins FS. Research agenda. Opportunities for research and NIH. Science. 2010;327:36–37. doi: 10.1126/science.1185055. [DOI] [PubMed] [Google Scholar]
- 61.Collins FS, et al. Basic science: Bedrock of progress. Science. 2016;351:1405. doi: 10.1126/science.351.6280.1405-a. [DOI] [PMC free article] [PubMed] [Google Scholar]
- 62.Alberts B, Kirschner MW, Tilghman S, Varmus H. Rescuing US biomedical research from its systemic flaws. Proc Natl Acad Sci USA. 2014;111:5773–5777. doi: 10.1073/pnas.1404402111. [DOI] [PMC free article] [PubMed] [Google Scholar]
- 63.Alberts B, Kirschner MW, Tilghman S, Varmus H. Opinion: Addressing systemic problems in the biomedical research enterprise. Proc Natl Acad Sci USA. 2015;112:1912–1913. doi: 10.1073/pnas.1500969112. [DOI] [PMC free article] [PubMed] [Google Scholar]
- 64.Roser M. 2016 Life Expectancy. Available at https://ourworldindata.org/life-expectancy/. Accessed May 14, 2017.
- 65.Ashenfelter O, Card D. Did the elimination of mandatory retirement affect faculty retirement? Am Econ Rev. 2002;92:957–980. [Google Scholar]
Associated Data
This section collects any data citations, data availability statements, or supplementary materials included in this article.


