Significance
The transcription factor STAT3 is involved in multiple oncogenic signaling pathways and is an attractive therapeutic target. This study shows that a potent inhibitor of STAT3 interferes with mitochondrial activity and protein homeostasis, leading to a synthetic lethality effect in glucose-depleted cancer cells. These findings provide a rationale for novel strategies based on the use of STAT3 inhibitors for cancer treatment.
Keywords: STAT3, mitochondria, small-molecule inhibitor, synthetic lethality, OPB-51602
Abstract
In addition to its canonical role in nuclear transcription, signal transducer and activator of transcription 3 (STAT3) is emerging as an important regulator of mitochondrial function. Here, we demonstrate that a novel inhibitor that binds with high affinity to the STAT3 SH2 domain triggers a complex cascade of events initiated by interference with mitochondrial STAT3 (mSTAT3). The mSTAT3–drug interaction leads to mitochondrial dysfunction, accumulation of proteotoxic STAT3 aggregates, and cell death. The cytotoxic effects depend directly on the drug’s ability to interfere with mSTAT3 and mitochondrial function, as demonstrated by site-directed mutagenesis and use of STAT3 knockout and mitochondria-depleted cells. Importantly, the lethal consequences of mSTAT3 inhibition are enhanced by glucose starvation and by increased reliance of cancer cells and tumor-initiating cells on mitochondria, resulting in potent activity in cell cultures and tumor xenografts in mice. These findings can be exploited for eliciting synthetic lethality in metabolically stressed cancer cells using high-affinity STAT3 inhibitors. Thus, this study provides insights on the role of mSTAT3 in cancer cells and a conceptual framework for developing more effective cancer therapies.
Signal transducer and activator of transcription 3 (STAT3) is a key element in multiple signaling pathways and is aberrantly activated in many human cancers (1, 2). STAT3 promotes cell proliferation, survival, angiogenesis, and immune-evasion (1–3). Phosphorylation at Tyr705 (pTyr705), catalyzed by Janus kinases (JAK) and other tyrosine kinases, induces STAT3 dimerization through the interaction of the SH2 domain (SH2D), nuclear accumulation, and target gene transcription (1, 3, 4). Emerging evidence indicates that STAT3 also localizes to mitochondria and controls mitochondrial functions (2, 5–7). Mitochondrial localized STAT3 (mSTAT3) is critical for survival of RAS-transformed mouse embryo fibroblasts (MEF) under glucose-starvation, reflecting a specific dependency of cancer cells on mitochondria in certain conditions (6). Interestingly, mSTAT3 is prevalently phosphorylated at Ser727 (pSer727), which enhances its mitochondrial functions (5, 6). Furthermore, constitutive pSer727 is found in many human cancers and is apparently sufficient to drive tumorigenesis in various model systems (8–10).
STAT3 is an attractive cancer therapeutic target because of its central role in multiple oncogenic processes and great effort has been devoted in recent years to discover STAT3 inhibitors (STAT3i) (11, 12). To date, small-molecule STAT3i have shown relevant activity in preclinical models and few of them are currently investigated in clinical trials (11, 13–17). However, an important gap persists in our knowledge of the biological mechanisms of antitumor activity, the critical cellular processes affected, and the factors determining sensitivity of cancer cells to STAT3i, hindering further clinical development of these highly promising anticancer drugs. Indeed, great attention has been devoted to the effects of direct and indirect STAT3i on nuclear and transcriptional functions of STAT3, whereas much less is known about the consequences of STAT3 inhibition on mitochondrial activity (11, 12). The emerging role of mitochondria as central organelles in metabolic adaptation, drug resistance, and stemness in human cancers makes this issue timely and relevant (18–21).
In this study, we investigated how a novel small-molecule compound, OPB-51602, which is currently in clinical trials (16, 17), interferes with the STAT3 functions in cancer cells. We show that OPB-51602 binds with high affinity to the SH2D and inhibits very effectively STAT3 phosphorylation and cancer cell proliferation. Intriguingly, we found that, upon binding to STAT3, OPB-51602 triggers a complex cascade of events that includes disruption of mitochondrial function and protein homeostasis, culminating in cell death. These events were initiated by binding to the SH2D and interference with mSTAT3. Notably, the lethal consequences of OPB-51602 were greatly enhanced by glucose starvation and reliance on mitochondrial function. This created a condition of synthetic lethality, leading to high vulnerability of cancer cells and tumor-initiating stem-like cells to STAT3i and potent antitumor effect in tumor xenografts. Importantly, this concept of mitochondrial targeting by small-molecule STAT3i could be exploited to design novel therapeutic strategies and drug combinations for cancer treatment.
Results
OPB-51602 Inhibits STAT3 by Binding to the SH2D.
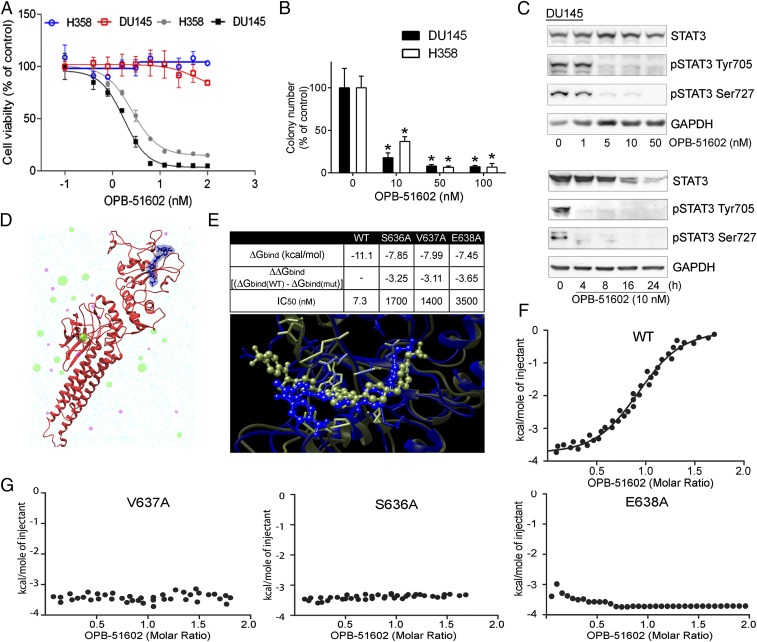
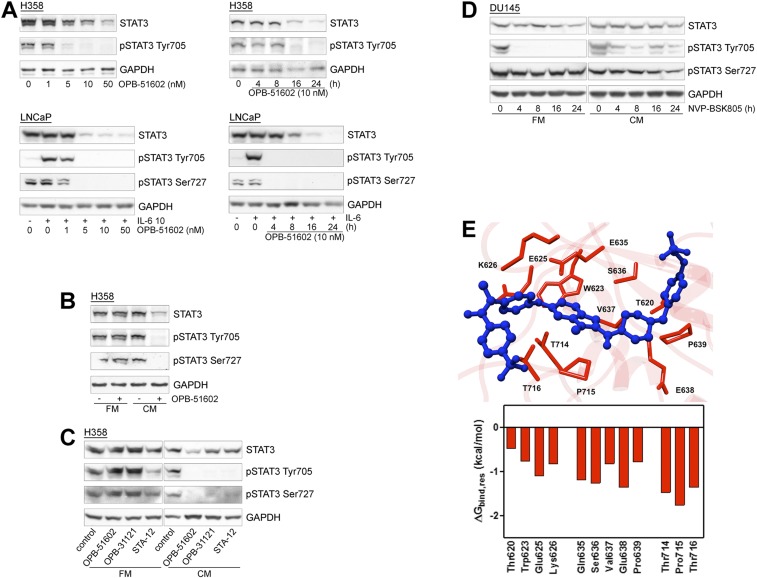
To gain insights in the biological activity of OPB-51602, we tested its effects on cell proliferation and STAT3 signaling in human cancer cells. OPB-51602 inhibited cell growth (Fig. 1A) and clonogenic capability (Fig. 1B) of DU145 and H358 cells. The response to OPB-51602 in cell growth assay was greatly affected by the culture conditions, with increased sensitivity when cells were plated at higher density (Fig. 1A). Under similar high-density culture conditions, inhibition of pTyr705 and pSer727 was seen at nanomolar concentrations and, within few hours of treatment (≥90% at 10 nM at 4 h), in DU145 and H358 cells with constitutive activation of pTyr705 and in LNCaP cells with inducible pTyr705 in the presence of IL-6 (Fig. 1C and Fig. S1A). We reasoned that the increased response at higher cell density could be because of rapid depletion of nutrients from the cell culture medium influencing the metabolic state of the cells. Consistently, when we replaced the high-density culture medium—defined as conditioned medium (CM)—with fresh medium (FM), the effects of the treatment on STAT3 phosphorylation was dramatically reduced (Fig. S1B). This phenomenon was not unique to OPB-51602 and the response to other STAT3i (OPB-31121 and STA-21) was equally decreased in the presence of FM (Fig. S1C). Conversely, we observed that the inhibition of pTyr705 by the JAK inhibitor NVP-BSK805 was higher in FM than CM (Fig. S1D).
Fig. 1.
Binding and inhibition of STAT3 signaling by OPB-51602. (A) Proliferation of DU145 and H358 cells incubated for 72 h with OPB-51602 at high (filled symbols) and low (open symbols) cell density. (B) Colony-forming ability of DU145 and H358 cells treated with OPB-51602. *P < 0.01. (C) pTyr705, pSer727, and tSTAT3 in DU145 cells treated with OPB-51602 for 16 h (Upper) or 10 nM for the indicated time (Lower) in CM. (D) Model of the full-length STAT3 (firebrick ribbon) in complex with OPB-51602 (blue). (E) Estimated binding free energy of WT, S636A, V637A, and E638A mutants of the STAT3 SH2D with OPB-51602. Lower section shows molecular simulation of OPB-51602 bound to WT (green) or E638A (blue) SH2D. (F) ITC analysis of OPB-51602 binding to WT STAT3 SH2D. (G) ITC analysis of OPB-51602 binding to STAT3 SH2D mutants (E638A, V637A, and S636A).
Fig. S1.
OPB-51602 interferes with STAT3 signaling in cancer cells. (A) Immunoblot analysis of STAT3 and pSTAT3 in H358 and LNCaP cells treated with OPB-51602. (B and C) STAT3 and pSTAT3 in H358 cells treated with OPB-51602 and the indicated compounds for 16 h in FM or CM. (D) STAT3 and pSTAT3 in DU145 cells treated with NVP-BSK805 for 16 h in FM or CM. (E) Amino acids (red) in the OPB-51602 (blue) binding site in the STAT3 SH2D (Upper) and per residue energy decomposition analysis (Lower) of the complex.
To prove that OPB-51602 binds to STAT3, we used computational modeling and binding assays by isothermal titration calorimetry (ITC). Computational docking and molecular dynamics simulation identified a potential binding site for OPB-51602 in the STAT3 SH2D (Fig. 1D) partially overlapping the binding site of OPB-31121 (22). Energy decomposition analysis was used to determine the contributions of individual amino acids in the binding pocket (Fig. S1E). In silico mutagenesis of S636, V637, and E638 reduced substantially binding with estimated IC50 values increasing from about 7 nM to >1,000 nM (Fig. 1E). The in silico predictions were confirmed by ITC with recombinant GST-tagged STAT3 SH2D, which showed that OPB-51602 binds with Kd of 5 nM (Fig. 1F). Furthermore, confirming the binding-site predictions, OPB-51602 did not bind the S636A, V637A, and E638A SH2D mutants (Fig. 1G).
OPB-51602 Interferes with mSTAT3 and Mitochondrial Function.
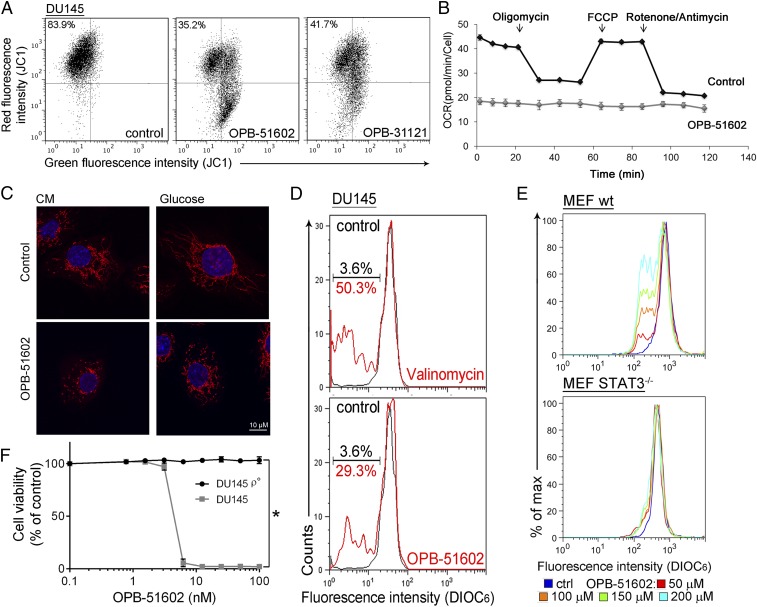
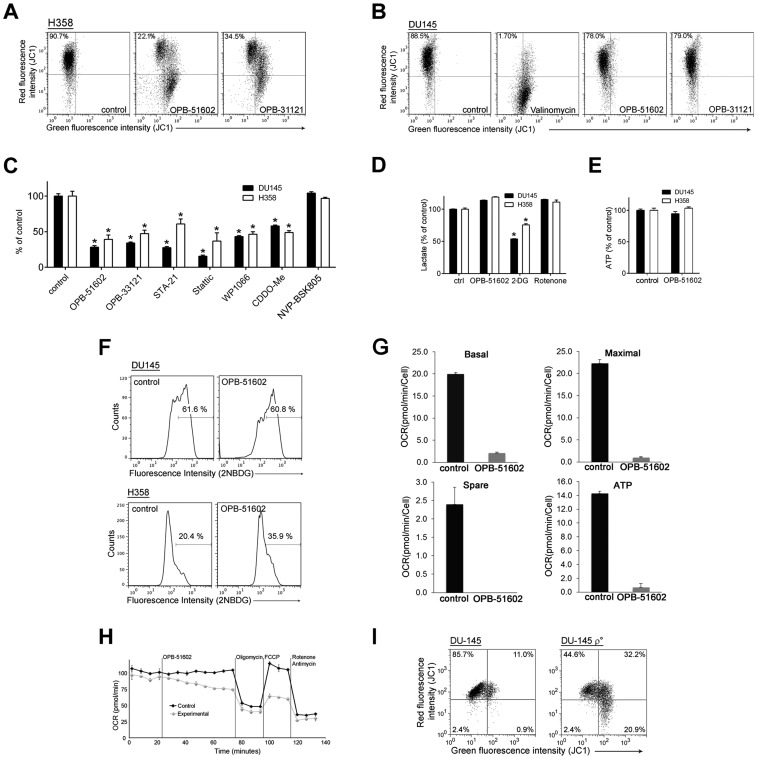
We took advantage of the high-affinity binding of OPB-51602 to examine the effects of STAT3 inhibition on mitochondrial function in cancer cells. Mitochondrial membrane potential (MMP) was drastically affected in cells treated with OPB-51602 in CM (Fig. 2A and Fig. S2A). Conversely, MMP decreased only slightly after treatment in FM (Fig. S2B). ATP production also decreased significantly after treatment in CM (Fig. S2C). Lactate level (Fig. S2D), ATP production (Fig. S2E), and glucose uptake (Fig. S2F) were not or minimally affected by the treatment in complete FM, excluding a direct influence of the drug on glucose metabolism. Furthermore, basal mitochondrial oxygen consumption rate (OCR), along with respiratory capacity and mitochondrial ATP production, were almost completely suppressed after a 2-h incubation with OPB-51602 (Fig. 2B and Fig. S2G). Interestingly, addition of OPB-51602 during the assay progressively inhibited mitochondrial activity compared with control cells, suggesting that the drug acted rapidly to block mitochondrial function (Fig. S2H). Using confocal microscopy, we monitored the morphology of mitochondria in control and OPB-51602–treated cells. Mitochondria were elongated and hyperfused in control cells placed in nutrient-depleted CM and glucose-free medium (Fig. 2C, Upper). This finding was consistent with dynamic adaptation to nutrient starvation, whereby elongated mitochondria ensure higher bio-energetic efficiency. Notably, in these conditions OPB-51602 induced drastic changes in mitochondria that appeared more fragmented, indicating an imbalance between fission and fusion events, consistent with impaired mitochondrial activity (Fig. 2C, Lower). These changes in mitochondrial function and dynamics occurred rapidly, suggesting a direct effect on a key mitochondrial target, and were favored by nutrient or glucose depletion, reminiscent of the effect of STAT3 ablation in glucose-starved cancer cells (6).
Fig. 2.
OPB-51602 impairs mitochondrial function. (A) MMP (JC1 staining) in DU145 cells treated with OPB-51602 and OPB-31121 for 2 h in CM. (B) Mitochondrial OCR in control and OPB-51602–treated (100 nM for 2 h) DU145 cells. (C) Mitochondrial shape in DU145 cells treated with OPB-51602 (100 nM) in CM (16 h) or glucose-depleted medium (4 h) and stained with MitoTracker Orange (red) and DAPI (blue). (D) MMP (DIOC6 staining) in isolated mitochondria from DU145 cells treated with OPB-51602 (50 μM) or Valinomycin (100 μM) for 3 h. (E) MMP (DIOC6 staining) in isolated mitochondria from WT and STAT3−/− MEF treated with OPB-51602 for 3 h. (F) Cell viability [sulforhodamine B (SRB) assay] in DU145 and DU145 ρ° cells treated with OPB-51602. *P < 0.01.
Fig. S2.
OPB-51602 affects mitochondrial function. (A) MMP (JC1 staining) in H358 cells treated with OPB-51602 and OPB-31121 for 2 h in CM. (B) MMP (JC1 staining) in DU145 cells treated with OPB-51602, OPB-31121 and Valinomycin in FM. (C) ATP level in cells treated with the indicated drugs for 2 h in CM. (D) Lactate production in DU145 and H358 cells treated with OPB-5602, 2-DG (5 mM), and rotenone (10 μM) in FM. (E) ATP production in DU145 and H358 cells treated with OPB-51602 in FM. (F) Glucose uptake in DU145 and H358 cells treated with OPB-51602 for 6 h in FM. (G) Mitochondrial respiratory capacity and ATP production determined in control and OPB-51602 treated (100 nM for 2 h) DU145 cells by OCR measurement with Seahorse analysis shown in Fig. 2B. (H) Seahorse analysis of OCR of DU145 cells untreated (control) or treated (experimental) with OPB-51602 (100 nM) at the indicated time. (I) MMP (JC1 staining) in DU145 and DU-145 ρ° cells. *P < 0.01.
OPB-51602 binds tightly to STAT3 and the effect on mitochondria could be because of direct interference with mSTAT3 independent of the drug’s effect on nuclear STAT3. To test this hypothesis, we treated with OPB-51602 mitochondria isolated from DU145 cells. OPB-51602 reduced the MMP in line with a direct impact on mSTAT3 (Fig. 2D). To further link this effect to mSTAT3, we treated mitochondria isolated from WT and STAT3−/− MEF. OPB-51602 affected mitochondria from WT cells but was completely ineffective on mitochondria from STAT3-depleted cells (Fig. 2E). Thus, mSTAT3 is a key target of OPB-51602 in mitochondria and is essential for inducing mitochondrial dysfunction. To establish whether interference with mSTAT3 was also relevant for the drug’s cytotoxicity, we generated DU145 ρ° cells depleted of functional mitochondria (Fig. S2I). The ρ° cells were maintained in medium supplemented with uridine and pyruvate, which are essential for survival in the absence of mitochondria (23). Notably, mitochondria-depleted DU145 ρ° cells were less affected by OPB-51602 (Fig. 2F). Thus, the drug’s cytotoxic effects depend on the ability to interfere with mSTAT3 and inhibit mitochondrial function.
STAT3 Forms Proteotoxic Aggregates in the Presence of OPB-51602.
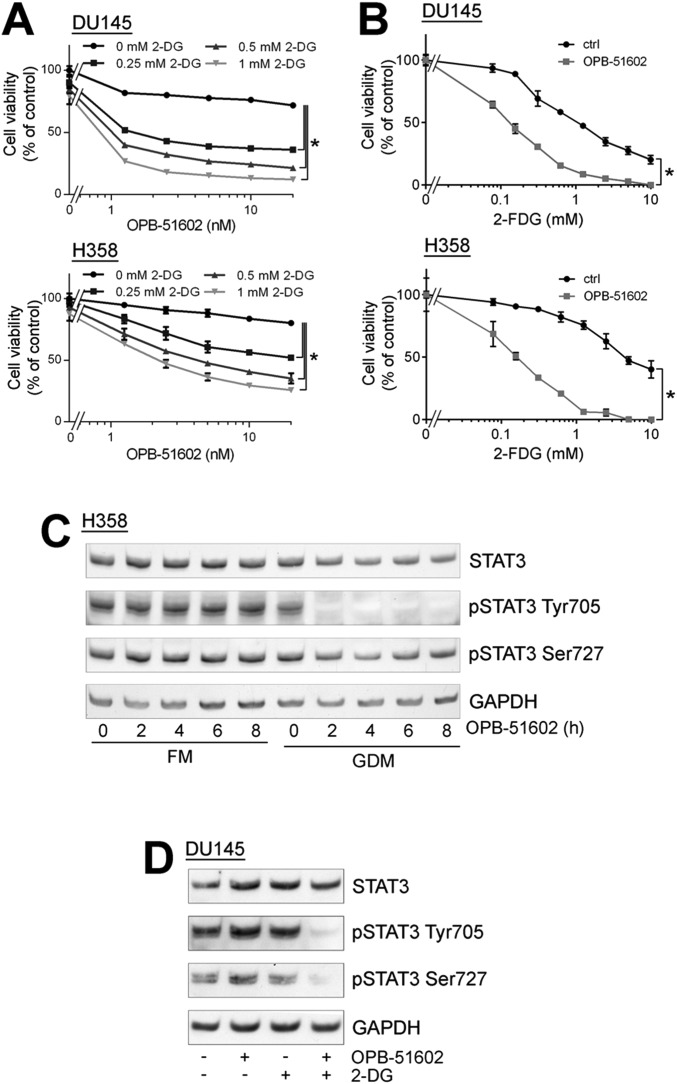
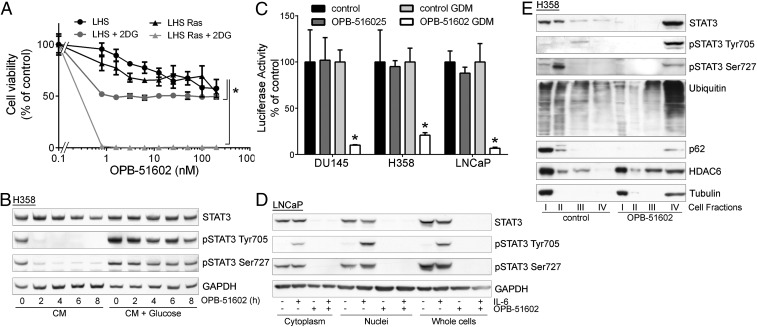
The induction of mitochondrial dysfunction and the dependency on the cell metabolic state suggested that cancer cells in conditions of increased reliance on mitochondria activity might be more sensitive to the cytotoxic effects of OPB-51602. Consistent with this hypothesis, cotreatment with inhibitors of glucose uptake and metabolism, 2-deoxy-d-glucose (2-DG) and 2-fluor-deoxy-d-glucose (2-FDG) increased the cytotoxic effect of OPB-51602 in cancer cells (Fig. S3 A and B). Notably, OPB-51602 in combination with 2-DG had a much greater effect in Ras-transformed (LHS-Ras) compared with nontransformed (LHS) prostate epithelial cells (Fig. 3A), in line with the increased dependency of tumorigenic cells on mSTAT3 under glucose starvation (6). Glucose depletion also influenced the effect of OPB-51602 on STAT3 phosphorylation and activity. The addition of glucose (10 mM) to CM counteracted the drug’s effect on pTyr705 and pSer727 (Fig. 3B). Conversely, removal of glucose from FM increased the efficacy of OPB-51602 (Fig. S3C). Blocking glucose metabolism with 2-DG had a similar effect on the cell response to OPB-51602 (Fig. S3D). Glucose starvation also enhanced the effect of OPB-51602 on STAT3 transcriptional activity (Fig. 3C), indicating that glucose level affected both nuclear and mitochondrial functions of STAT3. Together, these results indicate that OPB-51602 exhibited higher activity toward cancer cells in conditions of nutrient starvation or metabolic stress, which are typically found in the tumor microenvironment in vivo (24), and suggest the possibility of metabolic synthetic lethality because of the drug’s impact on mitochondrial function.
Fig. S3.
Glucose starvation enhances the cellular response to OPB-51602. (A and B) Proliferation of DU145 and H358 cells treated with OPB-51602 in the presence of 2-DG (A) or 2-FDG (B). (C) STAT3 and pSTAT3 in H358 cells treated with OPB-51602 in FM or glucose-depleted FM (GDM). (D) STAT3 and pSTAT3 in DU145 cells treated with OPB-51602 and/or 2-DG (5 mM) for 4 h in FM.
Fig. 3.
Altered distribution of STAT3 and proteostasis in response to OPB-51602. (A) Proliferation of immortalized normal (LHS) and Ras-transformed (LHS-Ras) prostate epithelial cells treated with OPB-51602 with or without 2-DG. *P < 0.01. (B) STAT3 and pSTAT3 in H358 cells treated with OPB-51602 in CM or glucose-supplemented CM. (C) STAT3 reporter activity in stably engineered cell lines treated with OPB-51602 for 16 h in complete or glucose-depleted FM (GDM). *P < 0.01. (D) STAT3 and pSTAT3 in cytoplasm, nuclei, and whole-cell lysates from LNCaP treated with OPB-51602 for 16 h. (E) Distribution of STAT3, p62, ubiquitinated proteins, and HDAC6 in cell fractions from H358 cells untreated or treated with OPB-51602 for 16 h.
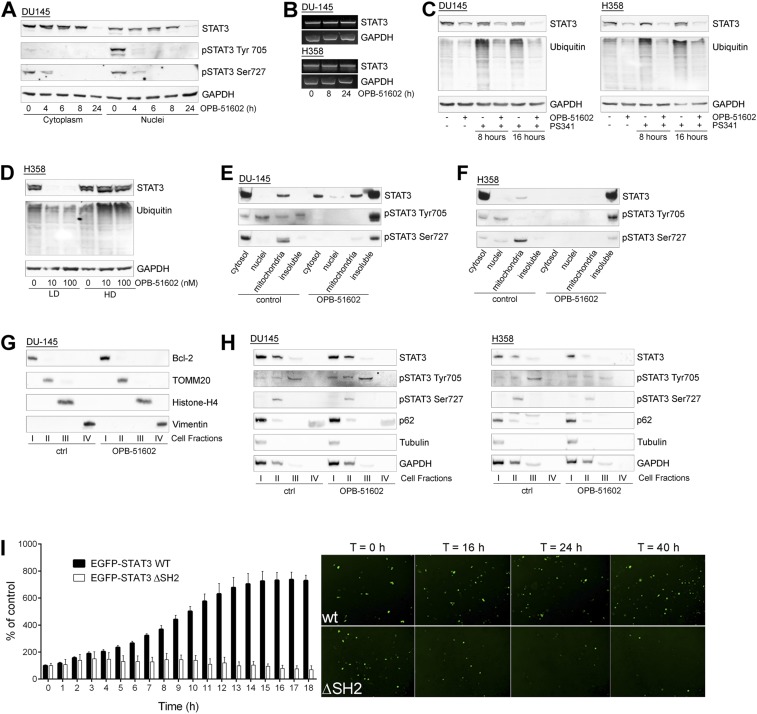
To understand the basis of the striking effects in nutrient-depleted cancer cells, we examined more closely the consequences on STAT3 distribution. In addition to reduced pSTAT3, treatment with OPB-51602 decreased the level of total STAT3 (tSTAT3). Depletion of tSTAT3, along with pSTAT3, occurred both in the cytoplasm and nuclei (Fig. S4A). In addition, the phenomenon was not affected by the state of pTyr705 phosphorylation and its induction by IL-6 in LNCaP cells (Fig. 3D). The depletion of tSTAT3 was highly reproducible and was particularly evident when the cells were treated in nutrient-depleted CM. Interestingly, the decline of tSTAT3 followed by few hours the reduction of pSTAT3, and was more evident after 24 h of treatment (Fig. S4A).
Fig. S4.
Intracellular distribution of STAT3 after treatment with OPB-51602. (A) STAT3 and pSTAT3 distribution in cytoplasm and nuclei of DU145 cells untreated or treated with OPB-51602 in CM for the indicated time. (B) STAT3 mRNA in DU145 and H358 cells treated with OPB-51602 in CM. (C) STAT3 and ubiquitinated proteins in DU145 and H358 cells treated with OPB-51602 and PS-341 (10 μM) for the indicated time. (D) STAT3 and ubiquitinated proteins in control and OPB-51602–treated H358 cells lysed in low (LD) or high (HD) detergent buffer. (E and F), Cell fractionation by sucrose gradient centrifugation and analysis of intracellular distribution of STAT3 and pSTAT3 in control and OPB-51602 treated DU145 (E) and H358 (F) cells in CM. (G) Distribution of specific cell compartment markers after cell fractionation of control and OPB-51602–treated DU145 cells. (H) Intracellular distribution of STAT3, pSTAT3, and p62 in DU145 and H358 cells untreated or treated with OPB-51602 for 16 h in FM. (I) Time-lapse fluorescence microscopy determination of the percentage of viable WT and ΔSH2 EGFP-STAT3+ H358 cells and representative images at the indicated time posttransfection. (Magnification: 5×.)
The effect on tSTAT3 could be a consequence of reduced transcription or enhanced protein degradation. However, STAT3 mRNA level did not change after drug treatment (Fig. S4B). Furthermore, proteasome inhibition by PS341 did not prevent the decline of tSTAT3 induced by OPB-51602 (Fig. S4C), ruling out reduced transcription and enhanced degradation. We considered the alternative possibility of entrapment of STAT3 into cellular substructures poorly solubilized under the relatively mild conditions used for cell lysis. Indeed, lysis of cells in high-detergent buffer increased the detectability of tSTAT3 compared with the standard low-detergent lysis buffer, likely by disrupting the poorly soluble complexes entrapping STAT3 (Fig. S4D). To further test this hypothesis, we performed cell fractionation and sucrose gradient centrifugation to monitor the subcellular distribution of STAT3. In control cells total, pTyr705, and pSer727 STAT3 were mainly present in the cytoplasm, nuclei, and mitochondria, respectively (Fig. S4 E and F). However, after drug treatment most of tSTAT3 and pSTAT3 were depleted from these cell compartments and recovered in the insoluble protein fraction.
To confirm this finding, we used an additional cell fractionation method that separated cytoplasm (fraction I), mitochondria and intracellular organelles (fraction II), nuclei (fraction III), and cytoskeleton/insoluble proteins (fraction IV) (Fig. S4G). Using this method, we detected depletion of tSTAT3 and pSTAT3 from cytoplasm, mitochondria, and nuclei, and a substantial shift in the insoluble protein fraction after treatment with OPB-51602 (Fig. 3E). Intriguingly, other proteins, such as p62, histone deacetylase 6 (HDAC6), and tubulin, which are recruited to protein aggregates and assist in their disposal (25), relocated in the insoluble fraction along with STAT3 in OPB-51602–treated cells (Fig. 3E). In addition, a substantial fraction of ubiquitinated proteins accumulated in the cellular insoluble fraction. The presence of components of the aggresome machinery and ubiquitinated proteins indicated that OPB-51602 entrapped STAT3 in aggresome-like structures and caused broad alterations in protein homeostasis. Again, this phenomenon was enhanced by glucose starvation and the presence of glucose-rich FM prevented the aggregation and protein shift in the insoluble fractions (Fig. S4H).
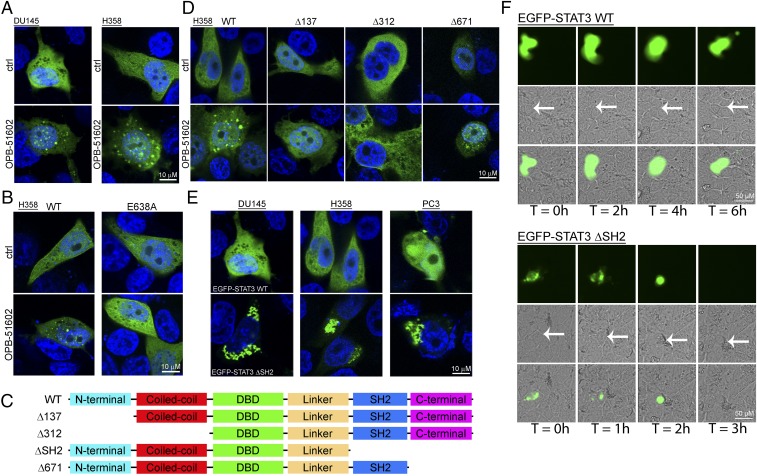
Using confocal microscopy and EGFP-tagged STAT3, we monitored directly the fate of STAT3 in intact cells. Control cells exhibited a diffuse and uniform distribution of EGFP-STAT3 (Fig. 4A, Upper). In contrast, EGFP-STAT3 localized in discrete foci resembling aggresome-like structures in cells treated with OPB-51602 in CM (Fig. 4A, Lower). To determine whether STAT3 aggregation was a direct consequence of the binding to the SH2D, we examined the behavior of the E638A-STAT3 mutant unable to bind OPB-51602 (Fig. 4B). The E638A-STAT3 mutant did not form aggregates and retained a diffuse distribution in drug-treated cells. Thus, the formation of the STAT3 aggregates was a direct consequent to the interaction of the drug with the SH2D and abrogating it prevented the aggregation.
Fig. 4.
Induction of STAT3 protein aggregates by OPB-51602. (A) Distribution of EGFP-STAT3 (green) in DU145 and H358 cells untreated or treated with OPB-51602 for 6 h in CM. Nuclei were stained with DAPI (blue). (B) Effect of OPB-51602 on WT and mutated (E638A) EGFP-STAT3. (C and D) WT and truncated variants of EGFP-STAT3 (C) and differential responses to treatment with OPB-51602 (D). (E) Spontaneous aggregation of ΔSH2 EGFP-STAT3 variant in CM cultures. (F) Live fluorescence, phase contrast, and composite images of H358 cells expressing WT or ΔSH2 EGFP-STAT3 at the indicated time points. Arrows indicate the position of EGFP+ cells in phase contrast images.
Next, we examined whether other STAT3 domains were involved in the formation of STAT3 aggregates using a series of EGFP-STAT3 deletion mutants (Fig. 4C). The C-terminal domain (ΔCTD, Δ671) mutant formed aggregates in presence of OPB-51602 (Fig. 4D). Surprisingly, the mutants lacking the N-terminal (ΔNTD, Δ137) or both the N-terminal and coiled-coil domain (ΔNTD-CCD, Δ312) did not aggregate in presence of the drug, implicating these regions in the aggregation phenomenon. We hypothesized that the drug binding to the SH2D could disrupt interactions between the NTD and SH2D that would prevent self-aggregation. Based on this assumption, we generated a mutant lacking the SH2D and CTD (ΔSH2-CTD) (Fig. 4C). We found that the ΔSH2-CTD mutant formed spontaneous aggregates that resembled the aggresome-like structures induced by OPB-51602 (Fig. 4E). This result was in line with the hypothesis that disruption of SH2D-NTD contacts could be the initial cause of the drug-induced STAT3 aggregation.
Massive accumulation of protein aggregates can lead to proteotoxicity and cell death (25, 26). Furthermore, protein aggregation is enhanced by metabolic stress and mitochondrial dysfunction (25, 26), which also occur in OPB-51602–treated cells. To examine whether STAT3 aggregates could per se affect cell viability, we took advantage of the aggregation-prone ΔSH2-CTD STAT3 mutant. Cells expressing WT-STAT3 were healthy and viable (Fig. 4F). In contrast, cells expressing the ΔSH2-CTD mutant rapidly showed signs of STAT3 aggregation and drastic changes in cell morphology, resulting in progressive cell shrinkage and death (Movies S1–S4). These effects were observed in cells incubated in CM, although a detectable amount of STAT3 self-aggregates formed also in FM. Although cells expressing WT-STAT3 divided and expanded within 16–24 h, the number of cells expressing the ΔSH2-CTD mutant did not increase because of impaired cell division and increased cell death (Fig. S4I). Thus, the accumulation of STAT3 aggregates is toxic to cells and is an important element contributing substantially to the OPB-51602 cytotoxicity.
Entrapment of p62 and Inhibition of Autophagy by Drug-Induced Proteotoxic STAT3 Aggregates.
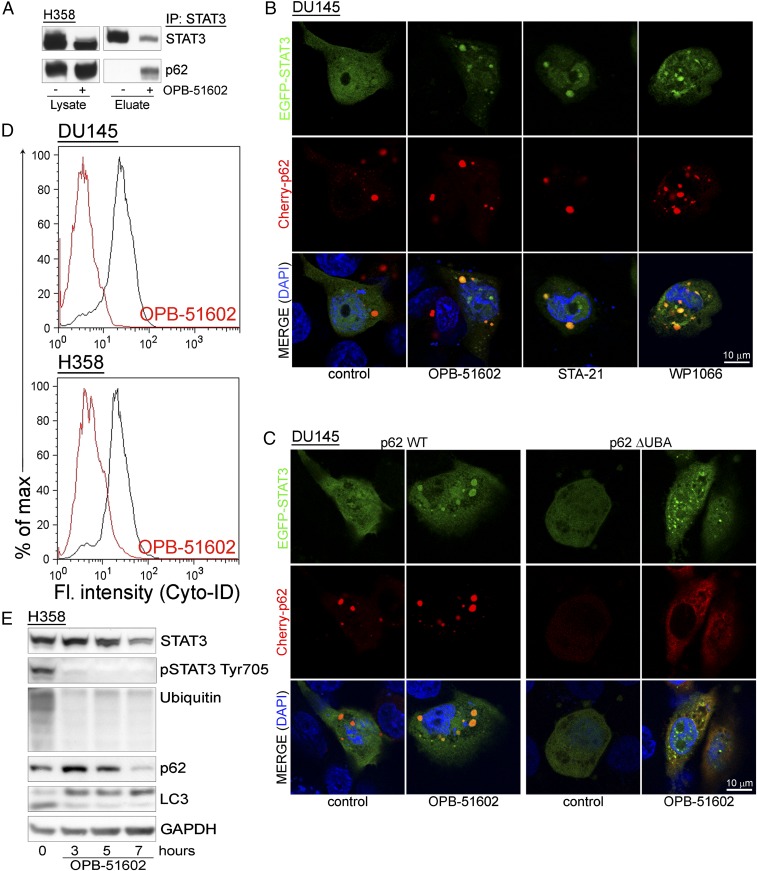
Our data indicate that drug-induced STAT3 aggregation is detrimental to cancer cells. Cells have well-defined mechanisms to deal with proteotoxic aggregates (25, 27). p62 is a critical player promoting the elimination of protein aggregates through autophagy (28). However, massive sequestration of p62 into aggresome-like structures could result in depletion and interference with p62-dependent processes. We found that a large portion of p62 coimmunoprecipitated with STAT3 in drug-treated cells, indicating that the interaction between the two proteins increased substantially with the formation of the STAT3 aggregates (Fig. 5A). Using confocal microscopy, we monitored the changes in distribution EGFP-STAT3 and Cherry-p62 in control and drug-treated cells (Fig. 5B). Individual Cherry-p62 punctae not overlapping with EGFP-STAT3 were detected in control cells. Conversely, Cherry-p62 and EGFP-STAT3 colocalized in large aggresome-like structures after treatment with OPB-51602. These results prompted us to further investigate the role of p62 in the formation of the aggregates. Notably, knockdown of p62 did not prevent STAT3 aggregation, indicating that p62 was not required for their formation (Fig. S5A). However, deletion of the ubiquitin binding domain (ΔUBA) in p62 reduced colocalization with EGFP-STAT3 and caused formation of smaller and more dispersed aggregates (Fig. 5C). Thus, the initial stages of aggregate formation did not depend on p62, whereas p62 that was recruited through the UBA domain contributed to their expansion.
Fig. 5.
Entrapment of p62 in STAT3-rich aggresomes. (A) Coimmunoprecipitation of STAT3 and p62 upon lysis in DISK buffer of control and OPB-51602–treated H358 cells. (B) Distribution of EGFP-STAT3 (green) and Cherry-p62 (red) in cells treated with the indicated drugs for 6 h in CM cultures. (C) Distribution of EGFP-STAT3 (green) and WT or ΔUBA Cherry-p62 (red) in cells treated with OPB-51602 for 6 h in CM. (D) Flow cytometry analysis of autophagy in H358 and DU145 cells treated with OPB-51602 for 6 h in CM. (E) Immunoblot analysis of LC-3 along with STAT3, p62, and ubiquitinated proteins in H358 cells treated with OPB-51602 for the indicated time in CM cultures.
Fig. S5.
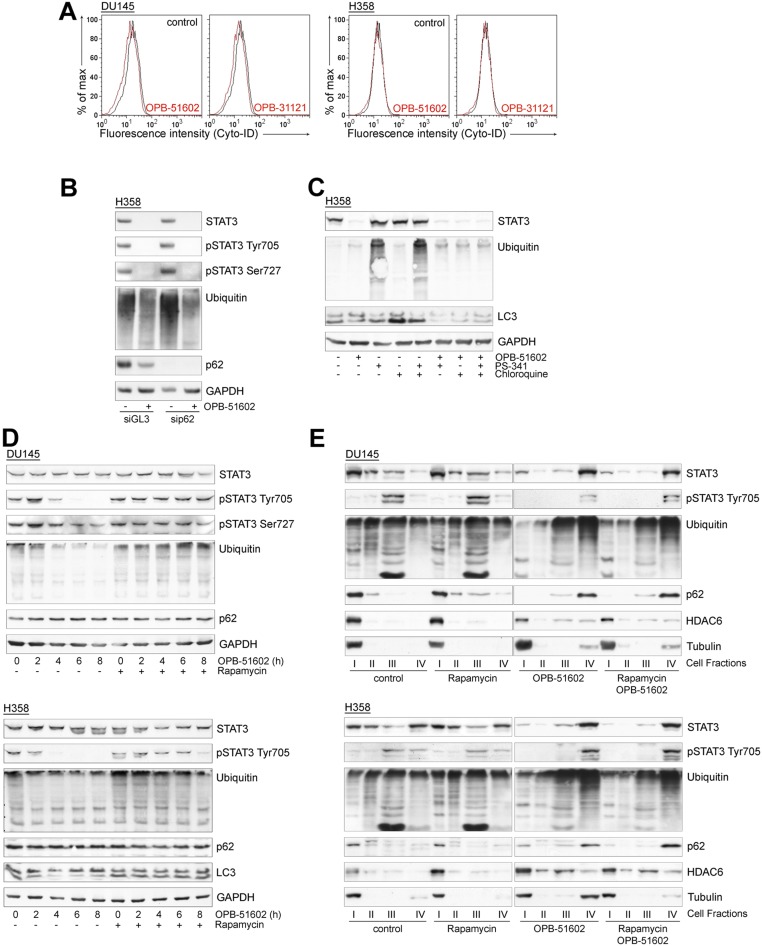
OPB-51602 affects autophagy in glucose-starved cancer cells. (A) Immunoblot analysis of STAT3, pSTAT3, p62, and ubiquitinated proteins in control (siGL3) and p62 knockdown (sip62) cells with and without treatment with OPB-51602 for 16 h in CM. (B) Flow-cytometry analysis of autophagy in DU145 and H358 cells treated with OPB-51602 and OPB-31121 for 6 h in glucose-rich FM. (C) LC3, STAT3, and ubiquitinated proteins in H358 cells treated with OPB-51602, PS-341 (10 μM), and chloroquine (100 μM) for 16 h in CM. (D) STAT3, p62, and ubiquitinated proteins in DU145 (Upper) H358 (Lower) cells treated with OPB-51602 with or without rapamycin (1 μM) for up to 8 h in CM. (E) Distribution of STAT3 and the indicated proteins in DU145 (Upper) and H358 (Lower) cells treated with OPB-51602 and/or rapamycin (1 μM) for 16 h in CM.
Entrapment of p62 in the presence of massive formation of STAT3 aggregates could impact on the ability of cells to activate autophagy, an important survival mechanism in nutrient-depleted cells (29). We found that there was no effect of OPB-51602 on autophagy in glucose-rich FM (Fig. S5B). However, OPB-51602 inhibited autophagy in cells treated in nutrient-depleted CM (Fig. 5D), consistent with the notion that the pathway was activated and susceptible to inhibition in metabolically stressed cells. OPB-51602 led to the accumulation of free cytoplasmic LC3-I and reduction of membrane-bound LC3 (LC3-II), indicating a block at the early phase of autophagosome assembly (29) (Fig. 5E). Furthermore, treatment with the autophagy inhibitor chloroquine and the proteasome inhibitor PS-341, both alone and in combination, did not prevent the drug’s effects on STAT3, ubiquitinated proteins, and LC3-I/II, consistent with an early block of autophagy (Fig. S5C). Conversely, we found that treatment with rapamycin, an autophagy inducer (29), delayed the effects of OPB-51602 on LC3-I/II and partially reduced loss of pSTAT3 at early times (≤8 h) (Fig. S5D). However, this protective effect was lost with prolonged exposure to the drug (≥16 h) and did not block the entrapment of STAT3 in the insoluble fraction (Fig. S5E). This finding indicated that, although autophagy initially assist in the disposal of STAT3 aggregates, prolonged exposure to OPB-51602 exhausts the cell capacity for processing them, leading to the accumulation of proteotoxic aggregates. In this context, the mitochondrial dysfunction induced by OPB-51602 could further exacerbate the formation of aggregates and prevent their elimination.
Mitochondrial Dysfunction and Proteotoxic Aggregate Formation Occur with Other STAT3i.
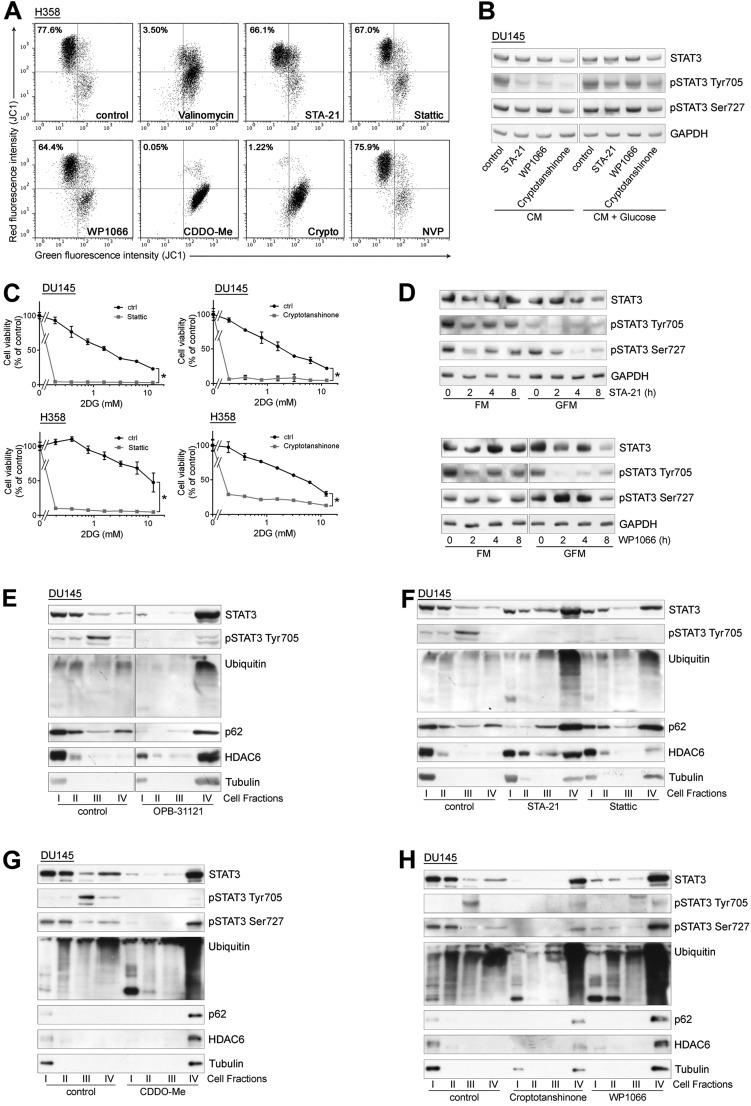
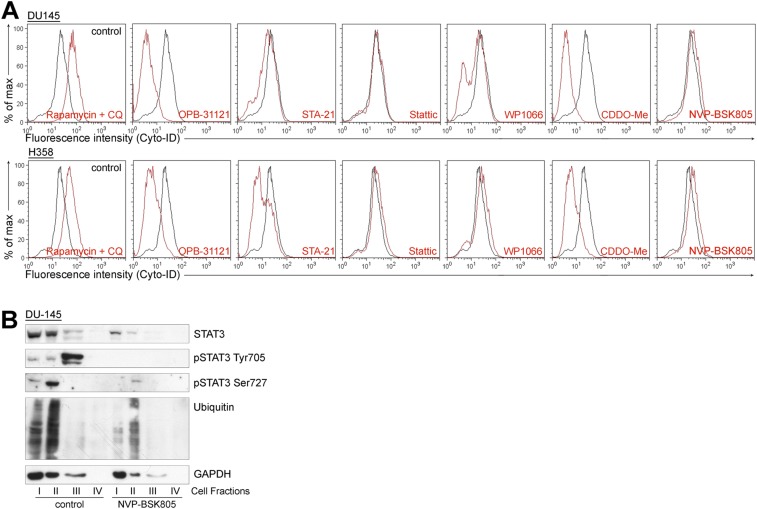
Treatment with OPB-51602 induced a complex cascade of events contributing to the drug’s cytotoxicity. These events depend primarily on the binding of OPB-51602 to the SH2D, leading to impaired STAT3 function and aggregation. We examined whether other STAT3i induced similar effects. We selected compounds reported to interact with the STAT3 SH2D (11), although they differ in their mode of interaction and binding affinity, as we recently reported for some of them (22). We also included WP1066, which was initially described as a JAK2 inhibitor (30) and later shown to block also SH2D–protein interactions independently of pTyr705 phosphorylation and nuclear STAT3 activity (31), suggesting an alternative mechanism of interference with STAT3 functions. Notably, we found that all of these compounds impaired MMP and ATP production (Fig. S6A), indicating that mitochondrial dysfunction was a common event. Sensitivity to these compounds was also affected by glucose starvation (Fig. S6B) and their cytotoxic activity was enhanced by 2-DG (Fig. S6C). STA21 and WP1066 progressively reduced pTyr705, pSer727, and tSTAT3 in cells treated in glucose-free medium, as seen with OPB-51602 (Fig. S6D). The STAT3i also induced the inclusion of STAT3 in insoluble complexes (Fig. S6 E–H) and formation of STAT3 aggregates (Fig. 5B), in line with an interference with SH2D functions. Similar to OPB-51602, many of these compounds inhibited autophagy in nutrient-starved cells (Fig. S7A). Conversely, the JAK2 inhibitor NVP-BSK805 (32) did not affect mitochondria (Fig. S6A), autophagy (Fig. S7A), and STAT3 intracellular distribution (Fig. S7B). Thus, the effects on mitochondrial activity, STAT3 aggregation, and protein homeostasis were phenomena shared by most, if not all of the compounds interfering with STAT3 function directly. Furthermore, the induction of proteotoxic cell death in metabolically stressed cancer cells was a common event underlying the anticancer activity of these STAT3i.
Fig. S6.
Mitochondrial dysfunction and STAT3 redistribution in cells treated with STAT3 inhibitors. (A) MMP (JC1 staining) in H358 cells treated with Valinomycin (positive control) and the indicated STAT3 inhibitors in CM. (B) STAT3 and pSTAT3 in DU145 cells treated with STA-21 (50 μM), WP1066 (50 μM), and cryptotanshinone (10 μM) in CM and glucose-supplemented CM. (C) Proliferation of DU145 and H358 cells treated with Stattic or cryptotanshinone alone or in the presence of 2-DG. *P < 0.01. (D) STAT3 and pSTAT3 in DU145 cells treated with STA-21 (Upper) and WP1066 (Lower) in FM or glucose-FM (GFM). (E–H), Intracellular distribution of the indicated proteins in DU145 cells treated with OPB-31121 (E), STA-21 and Stattic (F), CDDO-Me (G), cryptotanshinone and WP1066 (H) in CM.
Fig. S7.
Diverse impact on autophagy in response to STAT3 and JAK inhibitors. (A) Flow cytometry analysis of autophagy in DU145 and H358 cells treated with the indicated STAT3 inhibitors for 6 h in CM. (B) Distribution of STAT3 and pSTAT3 in DU145 cells treated with NVP-BSK805 for 16 h.
Proteotoxic STAT3 Aggregate Formation and in Vivo Antitumor Activity of OPB-51602.
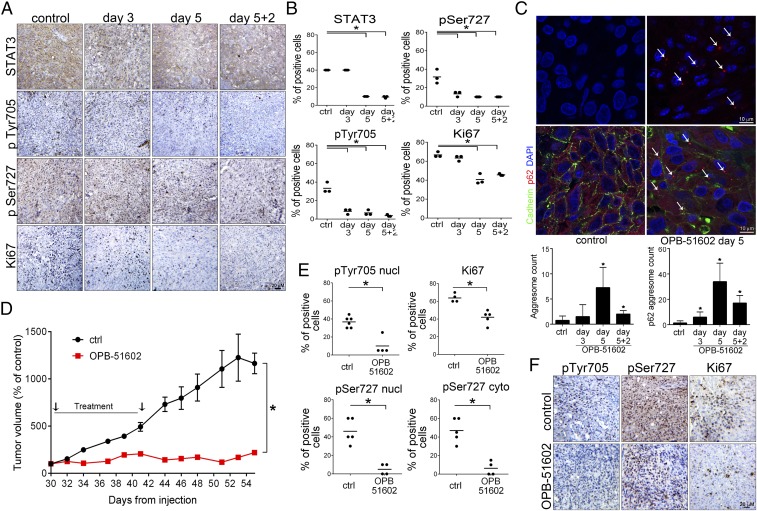
Tumor cells in the in vivo tumor microenvironment experience metabolic stress because of nutrient and glucose starvation (24). Our present data suggest that in this condition, tumor cells might be highly sensitive to STAT3i. A key event induced by OPB-51602 was the depletion of STAT3 and the formation of protein aggregates, which were direct consequences of the binding to STAT3 and were enhanced by nutrient depletion. We examined whether OPB-51602 induced similar effects in vivo. Mice with DU145 tumor xenografts were treated with vehicle or OPB-51602 daily for 3 or 5 d. The level of pTyr705, pSer727, and tSTAT3 declined in tumors from OPB-51602–treated mice (Fig. 6 A and B). Ki67 immunostaining was also reduced, confirming the concomitant inhibition of tumor cell proliferation. Moreover, aggresome-like structures, similar to those detected in vitro, were observed in tumor xenografts from OPB-51602–treated mice using ProteoStat, a specific stain for protein aggregates (Fig. 6C, Upper). Aggresome formation peaked at day 5, along with the reduction of tSTAT3. Immunofluorescence microscopy showed the concomitant formation of p62+ aggregates in OPB-51602–treated mice with a similar kinetics (Fig. 6C, Lower). These results confirmed the induction of STAT3 and p62-rich aggregates in tumor xenografts, suggesting that this phenomenon could be relevant for the drug’s activity in vivo.
Fig. 6.
Inhibition of tumor growth and impairment of tumor-initiating stem-like cells in vivo. (A and B) STAT3, pSTAT3, and Ki67 in DU145 tumor xenografts after treatment with OPB-51602 (40 mg/kg, daily by mouth) for 3 and 5 d and off treatment for 2 d (5+2). Representative images (A) and IHC quantification (B). (C) Aggresome formation in DU145 tumor xenografts from control and OPB-51602–treated mice (40 mg/kg, daily by mouth) detected by ProteoStat staining (Upper) or p62 immunostaining (Lower). Arrows, large aggregates in drug-treated xenografts. (D) Growth of tumor xenografts of DU145 cells in mice treated with 20 mg⋅kg⋅d–1 of OPB-51602 (n = 5 per group). (E and F), pTyr705 STAT3, pSer727 STAT3, and Ki67 IHC in tumor xenografts of DU145 cells in mice treated with vehicle or 20 mg⋅kg⋅d–1 OPB-51602 for 2 wk. Quantification of pTyr705, pSer727 STAT3 and Ki67 immuno-staining (E) and representative images (F). *P < 0.01.
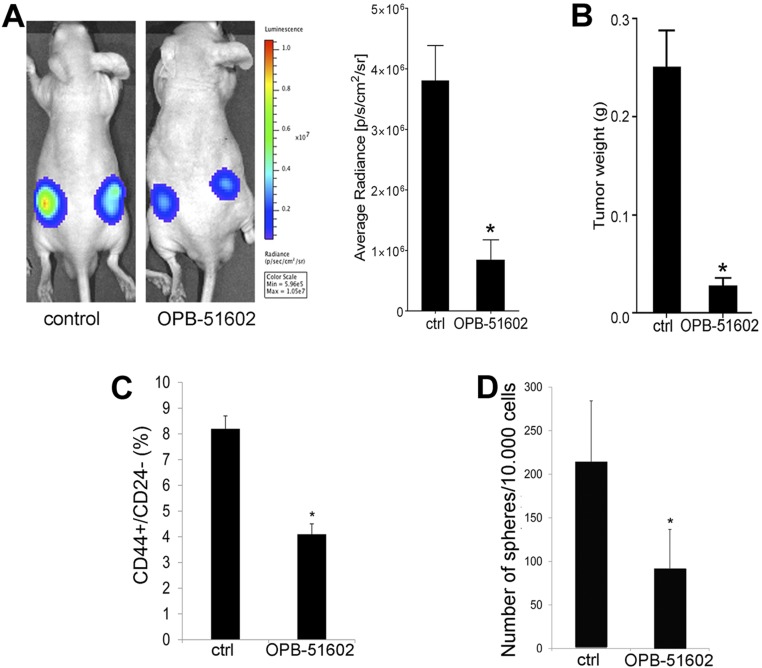
Next, we assessed the impact of OPB-51602 on the growth of DU145 tumor xenografts. Treatment with OPB-51602 daily for 2 wk strongly suppressed tumor growth as assessed by tumor volume (Fig. 6D), in vivo bioluminescence (Fig. S8A), and tumor weight (Fig. S8B) measurements. Immunohistochemistry (IHC) showed marked reduction of pTyr705, pSer727, and Ki67, confirming the ability of OPB-51602 to inhibit STAT3 signaling and tumor cell proliferation in vivo (Fig. 6 E and F). Notably, tumor growth did not resume in the 2-wk following treatment discontinuation, suggesting that OPB-51602 impaired the repopulating capacity of the surviving cancer cells in the residual tumors. We reasoned that this inhibition of tumor regrowth could be because of depletion of stem-like cancer cells, which would determine tumor cell repopulation. Prostate cancer stem-like cells are highly depended on STAT3 and sensitive to its inhibition (33–35). To test our hypothesis, we assessed the fraction of stem-like cancer cells in tumor xenografts after OPB-51602 treatment using ex vivo flow cytometry and tumor-sphere–forming assays (36, 37). These assays reliably monitor the stem-like cancer cell subpopulation in tumor xenografts, showing high correlation with the tumorigenic capability of stem-like cancer cells in vivo (36, 37). Notably, the fraction of CD44+/CD24− (Fig. S8C) and ex vivo tumor-sphere–forming cells (Fig. S8D), representing the surviving stem-like cancer cells in tumor xenografts, decreased significantly in the OPB-51602–treated group. Thus, OPB-51602 induced a substantial depletion of tumor-initiating stem-like cancer cells in line with the prolonged impairment of the tumor cell repopulating capability in vivo.
Fig. S8.
In vivo activity of OPB-51602 in mouse tumor xenografts. (A) Tumor growth assessed in control and OPB-51602 treated animals by in vivo bioluminescence imaging after 2 wk of treatment. (B) Tumor weight assessed in control and OPB-51602 treated animals after 2 wk of treatment. (C and D) Fraction of CD44+/CD24− cells (C) and ex vivo tumor-sphere forming ability (D) in cells isolated from control and OPB-51602 treated tumor xenografts after 2 wk of treatment (40 mg/kg, daily by mouth). *P < 0.01.
Discussion
STAT3 has a pivotal role in multiple oncogenic processes and is emerging as an important cancer therapeutic target (2, 12). In this study we examined the mechanism by which a small-molecule inhibitor that binds to the SH2D interferes with STAT3 functions in cancer cells. We found that the high-affinity STAT3i, OPB-51602, triggers a complex cascade of events leading to interference with multiple cellular functions and culminating in cell death. We dissected the contribution of each element of this cascade to the cytotoxic activity of this compound. Our data show that interference with mSTAT3, mitochondrial dysfunction, and formation of STAT3 proteotoxic aggregates were central events for the lethal effects in cancer cells exposed to nutrient starvation and metabolic stress. These findings challenge the current view that inhibition of nuclear STAT3 signaling and transcriptional activity are the main elements underlying the in vivo antitumor activity of STAT3i (2, 12). Moreover, these data open new perspectives for the clinical use of this class of anticancer drugs.
Our findings are consistent with a central role of mSTAT3 in sustaining survival of cancer cells in conditions of metabolic stress (5–7). Binding of OPB-51602 to the SH2D was the initial trigger for the disruption of intradomain interactions and the formation of STAT3 aggregates. This initial event, then, had broad consequences on many cellular processes starting with impairment of mSTAT3 functions. This was also associated with impaired STAT3 nuclear and transcriptional activity, although this occurred at later times and was not sufficient for the induction of cytotoxic effects in mitochondrial-depleted DU145 ρ° cells. Conversely, we observed rapid changes in mitochondrial activity after treatment with OPB-51602. Consistent with impaired mitochondrial function, the drug induced profound effects on mitochondria morphology, indicating an imbalance between fusion and fission events and accumulation of fragmented mitochondria (38, 39). Changes in mitochondrial dynamics and energy homeostasis are emerging as important elements in cancer (18, 19). These processes might be particularly relevant for tumor-initiating cancer stem-like cells, which exhibit greater metabolic plasticity (40, 41) and often increased reliance on mitochondrial functions (42–44). We show that the drug’s lethal effects were directly related to the interference with mSTAT3 and mitochondrial function using isolated mitochondria from STAT3−/− MEF and mitochondria-depleted cancer cells, which were insensitive to OPB-51602. Conversely, we found that conditions that increased the cell dependency on mitochondria, like glucose starvation, increased the response to STAT3i. This phenomenon was particularly evident in Ras-transformed cells compared with nontransformed prostate epithelial cells, indicating a potential selectivity of this approach toward cancer cells. Notably, limited nutrient and glucose availability are commonly faced by cancer cells in the tumor microenvironment in vivo (24, 45, 46).
Our study shows that the cell lethality induced by OPB-51602 derived from a combination of events, among which mitochondrial dysfunction and altered proteostasis had major roles. Mitochondria have an important function in preventing protein misfolding and aggregation (25). Mitochondrial dysfunction, particularly in glucose-depleted conditions, could contribute to the drug-induced accumulation of STAT3 aggregates. Furthermore, despite the ability of the autophagy and proteasomal machinery to remove protein aggregates (25–27), the progressive accumulation of aggresomes caused the sequestration of essential components of the autophagy and proteasomal system and saturated the capacity of the cells to dispose of protein aggregates. Impaired autophagy and proteostasis compromised the survival of cancer cells under nutrient starvation. This combination of events can lead to a total collapse of cell functions and proteotoxic cell death (25–27, 47). Mitochondrial dysfunction, impaired proteostasis, and proteotoxic cell death are commonly seen in many neurodegenerative diseases (25–27, 47, 48). Our data indicate that cancer cells under specific growth conditions are highly susceptible to the metabolic imbalance and proteotoxic stress induced by STAT3i.
Importantly, the relevance of mSTAT3 and its mitochondrial functions, which emerges from this study, raises the possibility that features linked to the tumor metabolic status, such as the degree of mitochondrial or glucose dependency, could identify tumors more likely to respond to STAT3i (24, 42, 49, 50). Furthermore, metabolic reprogramming with increased reliance on mitochondrial function has emerged as an important mechanism for survival of tumor-initiating cells and development of therapy-induced resistance (42, 50–52). Our data suggest the interesting hypothesis that these phenomena might be specifically associated with enhanced vulnerability of cancer cells to STAT3i. Thus, OPB-51602 and other STAT3i could take advantage of the Achilles’ heel represented by the specific metabolic dependencies of cancer cells and tumor-initiating cells and elicit a metabolic synthetic lethality effect (53, 54).
The strategies used by cancer cells to ensure survival in the in vivo tumor microenvironment may vary depending on the tumor type, primary and metastatic sites, and epigenetically distinct cancer cell subpopulations (49, 55). Metabolic adaptation is emerging as a major mechanism of cancer cell survival and treatment resistance (20, 54). Decoding the processes involved in metabolic reprogramming in cancer cells, and particularly tumor-initiating stem-like cancer cells, is key to identifying novel targets and envisioning new therapeutic strategies (19, 56, 57). Our data indicate that STAT3 is an important factor in this context because of its involvement in key metabolic and survival pathways through both its nuclear and nonnuclear functions. Moreover, drugs like OPB-51602 block STAT3 in multiple cell compartments and interfere effectively with the metabolic flexibility essential for survival of cancer cells in the challenging tumor microenvironment.
Methods
Detailed description of reagents and protocols is provided in SI Materials and Methods.
Cell Lines and Reagents.
All of the cell lines, including LHS and LHS-Ras cells, have been described previously (52). DU145 ρ° cells were produced by continuous culturing in the presence of ethidium bromide (50 ng/mL) and were maintained in RPMI supplemented with uridine (10 mg/mL) and sodium pyruvate (1 mM). OPB-51602 and OPB-31121 were obtained from Otsuka Pharmaceuticals. Sources of all other chemicals and antibodies are indicated in SI Materials and Methods. Treatments were performed in complete RPMI, glucose-free RPMI, or conditioned medium. Cell fractionation was performed using ProteoExtract Subcellular Proteome Extraction Kit (Merck) or sucrose gradient centrifugation. Tumor-sphere formation and assessment of stem-like subpopulation (CD44+/CD24− cells) by flow cytometry were performed as described previously (37). Mitochondria were isolated with Mitochondria Isolation Kit (Thermo Scientifics). Mitochondria membrane potential was assesses with JC-1 or DIOC6 (ENZO). OCR was measured on a Seahorse XFp Analyzer (Seahorse Bioscience). All assays were performed in triplicate and repeated in at least three independent experiments.
Animal Studies.
All protocols were approved by the Swiss Veterinary Authority. DU145-Luc cells were injected subcutaneously in athymic male nude mice. Mice were treated with OPB-51602 in 5% arabic gum or vehicle. Tumor growth was monitored with a caliper and in vivo bioluminescence imaging using an IVIS Spectrum (Caliper LifeSciences). Ex vivo assays to assess stem-like cancer cells in tumor tissues were performed as previously described (36, 37).
Statistical Analysis.
Differences between experimental groups were analyzed for statistical significance using unpaired two-tailed t test. P values ≤ 0.01 were considered statistically significant.
SI Materials and Methods
Cell Lines, Plasmids, Chemicals, and Antibodies.
Cell lines (H358, DU145, LNCaP) were purchased from American Type Culture Collection (LGC Promochem, Molsheim Cedex, F) and maintained in RPMI supplemented with 10% FBS. Immortalized prostate epithelial cells (LHS) and a Ras-transformed counterpart (LHS-Ras) were described previously (58). WT and STAT3-deficient immortalized MEFs were previously described (6) and maintained in DMEM supplemented with 10% FBS. Complete DMEM, RPMI, and glucose-free RPMI were purchased from PAA (Brunschwig) and Life Technology (LuBioScience), respectively. DU145 ρ° cells were produced by culturing cells in RPMI in presence of ethidium bromide (50 ng/mL), uridine (10 mg/mL), and sodium pyruvate (1 mM) (59). Full-length WT EGFP-STAT3 was provided by Nadya I. Tarasova, Georgetown University, Washington, DC, and full-length pDest-mCherry-p62 was provided by Terje Johansen, University of Tromsø, Tromsø, Norway. EGFP-STAT3 and Cherry-p62 mutants were generated by site-directed mutagenesis using GENEART Site-Directed mutagenesis (Life Technology).
The following chemicals were used: OPB-51602 and OPB-31121 (Otsuka Pharmaceuticals); STA-21 and 2-Deoxy-2-fluoro-d-glucose (Santa Cruz Biotechnology); cryptotanshinone (Merck); NVP-BSK805 (Novartis); Stattic, WP1066, Rotenone, CCCP, rapamycin, and sodium pyruvate (ENZO Life Sciences); MitoTracker Orange CMTMRos (Life Technologies); CDDO-Me, PS341, antimycin A, chloroquine, valinomycin, glucose, 2-DG, uridine, and ethidium bromide (Sigma-Aldrich Chemie). IL-6 was purchased from R&D Systems Europe. The following antibodies were used: STAT3, pTyr705, and pSer727 (Cell Signaling Technology); HDAC6 (Santa Cruz Biotechnology); Ubiquitin (ENZO); p62, LC3 (Sigma-Aldrich Chemie); tubulin (Merck KGaA); GAPDH (Millipore).
Immunoblotting.
Cells were treated with drugs or vehicle (0.1% DMSO) in complete fresh RPMI, glucose-free RPMI, or conditioned medium (i.e., medium from 4-d-old high-density cultures). Cells were lysed in a low-detergent (LD) buffer containing 25 mM Tris⋅HCl pH 7.4, 150 mM KCl, 5 mM EDTA, 1% Nonidet P-40, 0.5% sodium deoxycholate, 0.1% SDS supplemented with protease and phosphatase inhibitor mixture (Roche Diagnostics). High-detergent (HD) lysis buffer contained 30% glycerol, 4% SDS, 4% 2-mercapto-ethanol, 20 mM Tris⋅HCl pH 6.8, and 0.2% bromophenol blue. Subcellular fractionation into cytoplasm (I), membrane/organelle fraction (II), nuclei (III), and cytoskeletal fraction (IV) was performed using ProteoExtract Subcellular Proteome Extraction Kit (Merck). To isolate cell fractions by sucrose gradient centrifugation, cells were lysed in 10 mM Tris⋅HCl, pH 8.0, 7.5 mM ammonium sulfate, 1 mM EDTA, 0.025% Nonidet P-40, and 1 mM DTT. After incubation on ice for 5 min, sucrose (0.3 M final concentration) was added to the cell homogenate and the cellular fractions were separated by centrifugation at 4,000 × g for 10 min at 4 °C. Mitochondria were separated from the cytosolic fraction by centrifugation at 12,000 × g for 30 min at 4 °C. Protein concentration was determined using a BCA assay (Pierce, Perbio Science Switzerland SA). Proteins were loaded on 10–12% Sprint Next Gel (Amresco, Bioconcept) and analyzed by immunoblotting. Horseradish peroxidase-conjugated secondary antibodies and the WesternBright ECL detection system (Witec AG) were used for detection.
Cell Viability, Clonogenicity, and Stem-Like Properties.
For proliferation assays, DU145 and H358 cells were plated in 96-well plates in complete RPMI at 1,000–2,000 cells per well (low density) or 20,000–30,000 cells per well (high density). Cells were treated with indicated compounds or DMSO (0.1%) after 24 h and cell viability was assessed after 72 h with the MTT assay. Alternatively, cell number was determined using sulforhodamine B (Sigma) colorimetric assay. For clonal assay cells were plated in six-well plates and treated with the indicated compounds. Colonies were fixed, stained with 1% Crystal violet in 20% ethanol, and counted with an automated colony counter. Tumor-sphere formation and assessment of stem-like subpopulation (CD44+/CD24− cells) by flow cytometry were performed as described previously (37). All assays were performed in triplicate and repeated in at least three independent experiments. Results are represented as mean ± SD from three independent experiments.
Production and Purification of STAT3 SH2D.
pGEX-2T-GST-STAT3 SH2D was generated by cloning the STAT3 SH2D (amino acid residues 586–685) recovered from pET28a-STAT3-SH2D (GenScript) using BamHI and EcoRI into pGEX-2T vector (GE Healthcare Europe). Mutants of the GST-STAT3 SH2D were produced by site-directed mutagenesis. Escherichia coli strain BL21(DE3) (Life Technologies) transformed with the pGEX-2T-GST-STAT3 SH2D plasmid was grown at 37 °C in LB medium containing ampicillin (50 μg/mL) and induced with 1 mM isfopropyl-β-d-thiogalactopyranoside (IPTG) for 4 h at 37 °C. The bacterial pellet was suspended in cold PBS containing protease inhibitors and 1 mg/mL of lysozyme (Sigma-Aldrich) and sonicated. Triton X-100 (Sigma-Aldrich) was then added at a final concentration of 1% and the lysate was centrifuged for 20 min at 4 °C. Supernatant was filtered and purified by affinity chromatography using GSTrap HP column (GE Healthcare). Fusion protein was eluted with 10 mM glutathione reduced, desalted in PBS and concentrated to 1 mg/mL.
ITC.
ITC measurements of the SH2D and binding inhibitors were conducted with a Nano ITC (TA Instruments) at 25 °C (22). After temperature equilibration, OPB-51602 at 100 μM in 1% DMSO (vol/vol) was titrated (1-μL step) every 4 min in 10 μM of GST-SH2D solution in PBS containing 1% DMSO (vol/vol) and (GST-SH2 WT, GST-SH2S636A, or GST-SH2V637A mutants) containing cells under constant stirring. Heat of reaction was subtracted from blank [1% DMSO (vol/vol)] titrated in GST solution in PBS containing 1% DMSO (vol/vol). The ratio heat/Mole of injectant was plotted versus the Molar ratio. The enthalpy of reaction, ΔH0, the binding constant, K, and the stoichiometry value, n, were calculated from the measured heat changes, upon association of the inhibitor with the GST-SH2D target protein.
Molecular Modeling.
The crystal structures of STAT3 protein was obtained from the available PDB file in the Protein Data Bank repository, 1BG1 (60). All compound structures were designed and optimized using Discovery Studio (DS, v2.5, Accelrys Inc) (22). All docking experiments were performed with Autodock 4.4, with Autodock Tools 1.4.6 on a win64 platform following a consolidated procedure. The binding free energy, ΔGbind, between the drugs and STAT3 was estimated by using to an extensively validated procedure (22, 61) based on the MM/PBSA approach implemented in Amber 12 (62). According to this computational recipe, ΔGbind values are calculated for equilibrated structures extracted from the corresponding molecular dynamics (MD) trajectories. The ΔGbind was calculated for each molecular species (complex, receptor, and ligand), and the binding free energy was computed as the difference: ΔGbind = Gcomplex – (Greceptor + Gligand) = ΔEMM + ΔGsol − TΔS, in which ΔEMM represents the molecular mechanics energy, ΔGsol includes the solvation free energy, and TΔS is the conformational entropy upon ligand binding. The per residue binding free-energy decomposition was performed exploiting the MD trajectory of each inhibitor/STAT3 complex, with the aim of identifying the key residues involved in the ligand/receptor interaction. This analysis was carried out using the MM/GBSA approach (63), and was based on the same snapshots used in the binding free-energy calculation. All simulations were carried out using the Pmemd modules of Amber 12, running on own CPU/GPU calculation cluster.
Glucose Uptake, Mitochondrial Membrane Potential, and Autophagy.
Cells were seeded in six-well plates for 48 h and then treated with the indicated compounds in fresh RPMI or glucose-free RPMI for 2 or 6 h. Cells were harvested by adding 2 mM EDTA, stained according the specific protocols, and analyzed with FACS Fortessa (BD Biosciences) and FlowJo software. To measure glucose uptake, cells were stained with 2-deoxy-2-[87-nitro-2,1,3-benzoxadiazol-4-yl)amino]-d-glucose (2NBDG, Life Technology). Mitochondria membrane potential was assesses with JC-1 or DIOC6 (ENZO). Autophagy was monitored with Cyto-ID Autophagy DetectionKit (ENZO). Mitochondria were isolated with Mitochondria Isolation Kit according to the manufacturer’s instructions (Thermo Scientifics).
Lactate and ATP Level.
Lactate production was determined using the Lactate Assay Kit (Sigma-Aldrich Chemie) according to the manufacturer’s instructions. Cells were seeded in six-well plates, grown for 48 h, and then medium was changed as indicated. Cells were suspended in Lactate Assay Buffer and homogenized. Lactate was detected after adding the Master Reaction Mix and incubating for 30 min at room temperature using the AD340 multiplate reader (Beckman Coulter). To assess intracellular ATP level, cells were seeded in 96-well plates and grown for 48 h. For analysis in glucose-free RPMI, medium was changed 4 h before treatment with the indicated drugs. At the end, CellTiter-Glo Reagent (Promega) was added and luminescence was recorded using a Veritas Microplate Luminometer (Turner Biosystem, Promega).
OCR.
The OCR was measured using the Seahorse XFp Analyzer (Seahorse Bioscience) under standard conditions and after addition of 1 μM oligomycin, 0.5 μM FCCP, and 0.5 μM Rotenone/antimycin A (XFp Cell Mito Stress Test Kit) with or without pretreatment with OPB-51602 (100 nM), according to the manufacturer’s instructions. DU145 cells were seeded in the XFp miniplates and grown overnight. Test compounds were diluted in XF Base Medium containing 1 mM pyruvate, 2 mM glutamine, and 10 mM glucose at pH 7.4, and were sequentially injected. OCR (picomoles per minute) was measured in basal condition and after injection of OPB-51602 and each test compound.
Immunoprecipitation.
Cells were fractioned using ProteoExtract Subcellular Proteome Extraction Kit and lysates subject to immunoprecipitation (IP). Alternatively, IP was performed by lysing cells on ice in DISK IP lysis buffer (30 mM Tris, pH 7.5, 150 mM NaCl, 10% glycerol, 1% Triton X-100). Cell lysates were cleared twice by centrifugation at 4 °C at maximum speed. IP was performed using anti-STAT3 antibody at 4 °C. Immunocomplexes were then recovered by PureProteome Protein A+G Magnetic Beads (Millipore), washed with DISK buffer, and eluted using HD buffer.
RNA Interference.
Cells were seeded at 30–50% confluence and transfected with 20 nM siRNA (Ambion, Applied Biosystems) directed to p62 (sip62) and firefly luciferase (siGL3) using Interferin (Polyplus, Brunschwig). After 48 h, cells were treated with OPB-51602 for 16 h and then analyzed by Western blotting. Alternatively, cells transfected with EGFP-STAT3 were treated with OPB-51602 for 4 h and analyzed by confocal microscopy. For STAT3 knockdown, cells were transfected with 100 nM siRNA using Lipofectamine 2000 (Sigma). Cells were analyzed by immunoblotting and flow cytometry after 72 h.
Fluorescence Microscopy.
Cells were incubated with drugs in fresh, glucose-FM or CM as indicated for Western blot analysis. Cells were seeded in eight-well Millicell EZ SLIDE (Millipore) to reach 80% confluence on the next day. Cells were transfected with EGFP-STAT3 and pDest-mCherry-p62 or the mutants using jetPRIME (Polyplus, Brunschwig). After 48 h, cells were treated with the drugs for 6 h, then fixed with 4% paraformaldehyde, and mounted with VECTASHIELD Mounting Medium with DAPI (Reactolab). MitoTracker Orange was added to culture medium for 40 min. Cells were washed once with PBS, fixed with 4% paraformaldehyde, and mounted with VECTASHIELD Mounting Medium. Confocal sections were obtained with a Leica TCS SP2 AOBS confocal laser microscope by sequential scanning. p62 aggregates were detected in 3-μm sections from formalin-fixed paraffin-embedded xenografts mounted on positive-charged slides. Slides were de-paraffinized with xylene and rehydrated; endogenous peroxidase activity was blocked by 3% hydrogen peroxide solution. The antigen retrieval was induced by heating the slides in EDTA pH8, boiling, followed by 20 min at subboiling temperature. Nonspecific binding sites were blocked with 5% BSA in PBS. Histological sections were incubated overnight at 4 °C with primary antibodies p62 and E-cadherin followed by secondary antibodies Alexa Fluor-594 goat anti-rabbit IgG and Alexa Fluor-488 goat anti-mouse IgG, respectively. Cell nuclei were counterstained with DAPI. Five-micrometer sections were stained to detect aggresomes using the ProteoStat Aggresome detection kit (ENZO). Slides were de-paraffinized with xylene and rehydrated, subsequently washed with PBS 1×, and fixed in 10% paraformaldehyde in PBS for 30 min at room temperature. Antigen retrieval was performed as described above. Sections were washed with PBS 1× and stained with ProteoStat dye, according to the manufacturer’s instructions. p62 aggregates and aggresomes were counted using the Object-Counter3D plug-in of ImageJ software. From 200 to 800 cells per sample were analyzed. A threshold value was used to distinguish individual p62 aggregates (from 0.5-μm2 area size) or aggresomes (from 0.1-μm2 area size). Live imaging was done on a Cytation3 Imaging Reader (Biotek Instruments) and green cells were automatically counted by the Gen5 Image software. Additionally, live fluorescence imaging was performed on the BD Pathway 855 confocal microscope (BD Biosciences).
RT-PCR.
Cells were plated in T-25 flasks and treated with OPB-51602. Total RNA was purified with SV Total RNA Isolation System (Promega). RNA concentration was determined using a NanoDrop spectrophotometer (Witec AG). RT-PCR was performed using the SuperScript III One-Step RT-PCR System (Life Technology). PCR products were run on 2% agarose gels, stained with GelRed Nucleic Acid Stain (Brunschwig), and visualized using the AlphaImager 3400.
Reporter Assays.
Cells expressing stable luciferase STAT3 reporter vector were plated in 48-well plates and treated with the drug (33). A single luciferase reporter assay was performed according to the manufacturer’s instructions (Promega) using a Cytation3 Imaging Reader. Data were normalized for protein concentration.
Tumor Xenografts.
Athymic male nude mice were purchased from Harlan Laboratories. Protocols were approved by the Swiss Veterinary Authority and conducted in compliance to the national guidelines. Experimental groups consisted of animals with equal age and body weight. To generate tumor xenografts, DU145 cells constitutively expressing luciferase (DU145-Luc) were injected subcutaneously. DU145-Luc cells were generated by infecting the cells with the retroviral vector pMMP-LucNeo, which encodes a fusion of the firefly luciferase and neomycin gene, and selection with 2 mg/mL G418 (Brunschwig). Pools of neomycin-resistant cells were collected and used for the experiments. Mice bearing subcutaneous tumors >100-mm3 volume were treated with OPB-51602 (20–40 mg/kg in 5% arabic gum for 5 d/wk) or vehicle. Tumor size was measured with a caliper and by in vivo bioluminescence imaging after 2 wk of treatment using IVIS Spectrum Imaging System (Caliper LifeSciences, PerkinElmer). Data were analyzed using the Living Image software 4.2 (Caliper LifeSciences). Data represent mean ± SD of five mice per group. Animals were killed at the indicated time points. Tumor tissue was fixed and examined by IHC with the indicated antibodies using Histostain-Plus Invitrogen II Generation LAB-SA (Cat. no. 85–9043) Detection System Kit. Ex vivo assays to assess stem-like cancer cells in tumor tissues were performed as described previously (36, 37).
Statistical Analysis.
Differences between experimental groups were analyzed for statistical significance using an unpaired two-tailed t test. P values ≤ 0.01 were considered statistically significant.
Supplementary Material
Acknowledgments
We thank Sandra Jovic, Sandra Pinton, and Enrica Mira Cato (Institute of Oncology Research) for their assistance; Edwin Rock and Dusan Kostic (Otsuka Pharmaceuticals) for their support and helpful comments; and Terje Johansen and Nadya Tarasova for the pDest-mCherry-p62 and EGFP-STAT3 construct, respectively. This work was supported by the Ticino Foundation for Cancer Research (C.V.C.); the Virginia Boeger Foundation, Swiss Cancer League (C.V.C. and G.M.C.); NIH Grant AI28900 (to D.E.L.); and Otsuka Pharmaceuticals (Japan).
Footnotes
Conflict of interest statement: This work was partially funded by Otsuka Pharmaceuticals (Japan), which provided and owns patents on two compounds used in the study, OPB-51602 and OPB-31121.
This article is a PNAS Direct Submission.
This article contains supporting information online at www.pnas.org/lookup/suppl/doi:10.1073/pnas.1615730114/-/DCSupplemental.
References
- 1.Yu H, Pardoll D, Jove R. STATs in cancer inflammation and immunity: A leading role for STAT3. Nat Rev Cancer. 2009;9:798–809. doi: 10.1038/nrc2734. [DOI] [PMC free article] [PubMed] [Google Scholar]
- 2.Yu H, Lee H, Herrmann A, Buettner R, Jove R. Revisiting STAT3 signalling in cancer: New and unexpected biological functions. Nat Rev Cancer. 2014;14:736–746. doi: 10.1038/nrc3818. [DOI] [PubMed] [Google Scholar]
- 3.Levy DE, Lee CK. What does Stat3 do? J Clin Invest. 2002;109:1143–1148. doi: 10.1172/JCI15650. [DOI] [PMC free article] [PubMed] [Google Scholar]
- 4.Sansone P, Bromberg J. Targeting the interleukin-6/Jak/stat pathway in human malignancies. J Clin Oncol. 2012;30:1005–1014. doi: 10.1200/JCO.2010.31.8907. [DOI] [PMC free article] [PubMed] [Google Scholar]
- 5.Wegrzyn J, et al. Function of mitochondrial Stat3 in cellular respiration. Science. 2009;323:793–797. doi: 10.1126/science.1164551. [DOI] [PMC free article] [PubMed] [Google Scholar]
- 6.Gough DJ, et al. Mitochondrial STAT3 supports Ras-dependent oncogenic transformation. Science. 2009;324:1713–1716. doi: 10.1126/science.1171721. [DOI] [PMC free article] [PubMed] [Google Scholar]
- 7.Meier JA, Larner AC. Toward a new STATe: The role of STATs in mitochondrial function. Semin Immunol. 2014;26:20–28. doi: 10.1016/j.smim.2013.12.005. [DOI] [PMC free article] [PubMed] [Google Scholar]
- 8.Qin HR, et al. Activation of signal transducer and activator of transcription 3 through a phosphomimetic serine 727 promotes prostate tumorigenesis independent of tyrosine 705 phosphorylation. Cancer Res. 2008;68:7736–7741. doi: 10.1158/0008-5472.CAN-08-1125. [DOI] [PMC free article] [PubMed] [Google Scholar]
- 9.Zhang Q, et al. Mitochondrial localized Stat3 promotes breast cancer growth via phosphorylation of serine 727. J Biol Chem. 2013;288:31280–31288. doi: 10.1074/jbc.M113.505057. [DOI] [PMC free article] [PubMed] [Google Scholar]
- 10.Gough DJ, Koetz L, Levy DE. The MEK-ERK pathway is necessary for serine phosphorylation of mitochondrial STAT3 and Ras-mediated transformation. PLoS One. 2013;8:e83395. doi: 10.1371/journal.pone.0083395. [DOI] [PMC free article] [PubMed] [Google Scholar]
- 11.Debnath B, Xu S, Neamati N. Small molecule inhibitors of signal transducer and activator of transcription 3 (Stat3) protein. J Med Chem. 2012;55:6645–6668. doi: 10.1021/jm300207s. [DOI] [PubMed] [Google Scholar]
- 12.Miklossy G, Hilliard TS, Turkson J. Therapeutic modulators of STAT signalling for human diseases. Nat Rev Drug Discov. 2013;12:611–629. doi: 10.1038/nrd4088. [DOI] [PMC free article] [PubMed] [Google Scholar]
- 13.Bendell JC, et al. Phase 1, open-label, dose-escalation, and pharmacokinetic study of STAT3 inhibitor OPB-31121 in subjects with advanced solid tumors. Cancer Chemother Pharmacol. 2014;74:125–130. doi: 10.1007/s00280-014-2480-2. [DOI] [PubMed] [Google Scholar]
- 14.Oh DY, et al. Phase I study of OPB-31121, an Oral STAT3 inhibitor, in patients with advanced solid tumors. Cancer Res Treat. 2015;47:607–615. doi: 10.4143/crt.2014.249. [DOI] [PMC free article] [PubMed] [Google Scholar]
- 15.Okusaka T, et al. Phase 1 and pharmacological trial of OPB-31121, a signal transducer and activator of transcription-3 inhibitor, in patients with advanced hepatocellular carcinoma. Hepatol Res. 2015;45:1283–1291. doi: 10.1111/hepr.12504. [DOI] [PubMed] [Google Scholar]
- 16.Ogura M, et al. Phase I study of OPB-51602, an oral inhibitor of signal transducer and activator of transcription 3, in patients with relapsed/refractory hematological malignancies. Cancer Sci. 2015;106:896–901. doi: 10.1111/cas.12683. [DOI] [PMC free article] [PubMed] [Google Scholar]
- 17.Wong AL, et al. Phase I and biomarker study of OPB-51602, a novel signal transducer and activator of transcription (STAT) 3 inhibitor, in patients with refractory solid malignancies. Ann Oncol. 2015;26:998–1005. doi: 10.1093/annonc/mdv026. [DOI] [PubMed] [Google Scholar]
- 18.Pavlova NN, Thompson CB. The emerging hallmarks of cancer metabolism. Cell Metab. 2016;23:27–47. doi: 10.1016/j.cmet.2015.12.006. [DOI] [PMC free article] [PubMed] [Google Scholar]
- 19.Ward PS, Thompson CB. Metabolic reprogramming: A cancer hallmark even Warburg did not anticipate. Cancer Cell. 2012;21:297–308. doi: 10.1016/j.ccr.2012.02.014. [DOI] [PMC free article] [PubMed] [Google Scholar]
- 20.Wolf DA. Is reliance on mitochondrial respiration a “chink in the armor” of therapy-resistant cancer? Cancer Cell. 2014;26:788–795. doi: 10.1016/j.ccell.2014.10.001. [DOI] [PMC free article] [PubMed] [Google Scholar]
- 21.Ito K, Suda T. Metabolic requirements for the maintenance of self-renewing stem cells. Nat Rev Mol Cell Biol. 2014;15:243–256. doi: 10.1038/nrm3772. [DOI] [PMC free article] [PubMed] [Google Scholar]
- 22.Brambilla L, et al. Hitting the right spot: Mechanism of action of OPB-31121, a novel and potent inhibitor of the signal transducer and activator of transcription 3 (STAT3) Mol Oncol. 2015;9:1194–1206. doi: 10.1016/j.molonc.2015.02.012. [DOI] [PMC free article] [PubMed] [Google Scholar]
- 23.King MP, Attardi G. Human cells lacking mtDNA: Repopulation with exogenous mitochondria by complementation. Science. 1989;246:500–503. doi: 10.1126/science.2814477. [DOI] [PubMed] [Google Scholar]
- 24.Birsoy K, et al. Metabolic determinants of cancer cell sensitivity to glucose limitation and biguanides. Nature. 2014;508:108–112. doi: 10.1038/nature13110. [DOI] [PMC free article] [PubMed] [Google Scholar]
- 25.Tyedmers J, Mogk A, Bukau B. Cellular strategies for controlling protein aggregation. Nat Rev Mol Cell Biol. 2010;11:777–788. doi: 10.1038/nrm2993. [DOI] [PubMed] [Google Scholar]
- 26.Hipp MS, Park SH, Hartl FU. Proteostasis impairment in protein-misfolding and -aggregation diseases. Trends Cell Biol. 2014;24:506–514. doi: 10.1016/j.tcb.2014.05.003. [DOI] [PubMed] [Google Scholar]
- 27.Lim J, Yue Z. Neuronal aggregates: Formation, clearance, and spreading. Dev Cell. 2015;32:491–501. doi: 10.1016/j.devcel.2015.02.002. [DOI] [PMC free article] [PubMed] [Google Scholar]
- 28.Moscat J, Diaz-Meco MT. p62 at the crossroads of autophagy, apoptosis, and cancer. Cell. 2009;137:1001–1004. doi: 10.1016/j.cell.2009.05.023. [DOI] [PMC free article] [PubMed] [Google Scholar]
- 29.Levine B, Kroemer G. Autophagy in the pathogenesis of disease. Cell. 2008;132:27–42. doi: 10.1016/j.cell.2007.12.018. [DOI] [PMC free article] [PubMed] [Google Scholar]
- 30.Ferrajoli A, et al. WP1066 disrupts Janus kinase-2 and induces caspase-dependent apoptosis in acute myelogenous leukemia cells. Cancer Res. 2007;67:11291–11299. doi: 10.1158/0008-5472.CAN-07-0593. [DOI] [PubMed] [Google Scholar]
- 31.Shen S, et al. Cytoplasmic STAT3 represses autophagy by inhibiting PKR activity. Mol Cell. 2012;48:667–680. doi: 10.1016/j.molcel.2012.09.013. [DOI] [PubMed] [Google Scholar]
- 32.Baffert F, et al. Potent and selective inhibition of polycythemia by the quinoxaline JAK2 inhibitor NVP-BSK805. Mol Cancer Ther. 2010;9:1945–1955. doi: 10.1158/1535-7163.MCT-10-0053. [DOI] [PubMed] [Google Scholar]
- 33.Civenni G, et al. EC-70124, a novel glycosylated indolocarbazole multikinase inhibitor, reverts tumorigenic and stem cell properties in prostate cancer by inhibiting STAT3 and NF-κB. Mol Cancer Ther. 2016;15:806–818. doi: 10.1158/1535-7163.MCT-15-0791. [DOI] [PubMed] [Google Scholar]
- 34.Dallavalle C, et al. MicroRNA-424 impairs ubiquitination to activate STAT3 and promote prostate tumor progression. J Clin Invest. 2016;126:4585–4602. doi: 10.1172/JCI86505. [DOI] [PMC free article] [PubMed] [Google Scholar]
- 35.Albino D, et al. The ETS factor ESE3/EHF represses IL-6 preventing STAT3 activation and expansion of the prostate cancer stem-like compartment. Oncotarget. 2016;7:76756–76768. doi: 10.18632/oncotarget.12525. [DOI] [PMC free article] [PubMed] [Google Scholar]
- 36.Albino D, et al. Activation of the Lin28/let-7 axis by loss of ESE3/EHF promotes a tumorigenic and stem-like phenotype in prostate cancer. Cancer Res. 2016;76:3629–3643. doi: 10.1158/0008-5472.CAN-15-2665. [DOI] [PubMed] [Google Scholar]
- 37.Civenni G, et al. RNAi-mediated silencing of Myc transcription inhibits stem-like cell maintenance and tumorigenicity in prostate cancer. Cancer Res. 2013;73:6816–6827. doi: 10.1158/0008-5472.CAN-13-0615. [DOI] [PubMed] [Google Scholar]
- 38.Liesa M, Shirihai OS. Mitochondrial dynamics in the regulation of nutrient utilization and energy expenditure. Cell Metab. 2013;17:491–506. doi: 10.1016/j.cmet.2013.03.002. [DOI] [PMC free article] [PubMed] [Google Scholar]
- 39.Wai T, Langer T. Mitochondrial dynamics and metabolic regulation. Trends Endocrinol Metab. 2016;27:105–117. doi: 10.1016/j.tem.2015.12.001. [DOI] [PubMed] [Google Scholar]
- 40.Luo M, Wicha MS. Metabolic plasticity of cancer stem cells. Oncotarget. 2015;6:35141–35142. doi: 10.18632/oncotarget.6177. [DOI] [PMC free article] [PubMed] [Google Scholar]
- 41.Chen CL, et al. NANOG metabolically reprograms tumor-initiating stem-like cells through tumorigenic changes in oxidative phosphorylation and fatty acid metabolism. Cell Metab. 2016;23:206–219. doi: 10.1016/j.cmet.2015.12.004. [DOI] [PMC free article] [PubMed] [Google Scholar]
- 42.Vazquez F, et al. PGC1α expression defines a subset of human melanoma tumors with increased mitochondrial capacity and resistance to oxidative stress. Cancer Cell. 2013;23:287–301. doi: 10.1016/j.ccr.2012.11.020. [DOI] [PMC free article] [PubMed] [Google Scholar]
- 43.Sancho P, et al. MYC/PGC-1α balance determines the metabolic phenotype and plasticity of pancreatic cancer stem cells. Cell Metab. 2015;22:590–605. doi: 10.1016/j.cmet.2015.08.015. [DOI] [PubMed] [Google Scholar]
- 44.Xie Q, et al. Mitochondrial control by DRP1 in brain tumor initiating cells. Nat Neurosci. 2015;18:501–510. doi: 10.1038/nn.3960. [DOI] [PMC free article] [PubMed] [Google Scholar]
- 45.Junttila MR, de Sauvage FJ. Influence of tumour micro-environment heterogeneity on therapeutic response. Nature. 2013;501:346–354. doi: 10.1038/nature12626. [DOI] [PubMed] [Google Scholar]
- 46.McMillin DW, Negri JM, Mitsiades CS. The role of tumour-stromal interactions in modifying drug response: Challenges and opportunities. Nat Rev Drug Discov. 2013;12:217–228. doi: 10.1038/nrd3870. [DOI] [PubMed] [Google Scholar]
- 47.Narayan P, Ehsani S, Lindquist S. Combating neurodegenerative disease with chemical probes and model systems. Nat Chem Biol. 2014;10:911–920. doi: 10.1038/nchembio.1663. [DOI] [PubMed] [Google Scholar]
- 48.Tanaka M, Komi Y. Layers of structure and function in protein aggregation. Nat Chem Biol. 2015;11:373–377. doi: 10.1038/nchembio.1818. [DOI] [PubMed] [Google Scholar]
- 49.Vander Heiden MG. Targeting cancer metabolism: A therapeutic window opens. Nat Rev Drug Discov. 2011;10:671–684. doi: 10.1038/nrd3504. [DOI] [PubMed] [Google Scholar]
- 50.Zhang G, et al. Targeting mitochondrial biogenesis to overcome drug resistance to MAPK inhibitors. J Clin Invest. 2016;126:1834–1856. doi: 10.1172/JCI82661. [DOI] [PMC free article] [PubMed] [Google Scholar]
- 51.Haq R, et al. Oncogenic BRAF regulates oxidative metabolism via PGC1α and MITF. Cancer Cell. 2013;23:302–315. doi: 10.1016/j.ccr.2013.02.003. [DOI] [PMC free article] [PubMed] [Google Scholar]
- 52.Viale A, et al. Oncogene ablation-resistant pancreatic cancer cells depend on mitochondrial function. Nature. 2014;514:628–632. doi: 10.1038/nature13611. [DOI] [PMC free article] [PubMed] [Google Scholar]
- 53.Nijman SM, Friend SH. Cancer. Potential of the synthetic lethality principle. Science. 2013;342:809–811. doi: 10.1126/science.1244669. [DOI] [PubMed] [Google Scholar]
- 54.Holohan C, Van Schaeybroeck S, Longley DB, Johnston PG. Cancer drug resistance: An evolving paradigm. Nat Rev Cancer. 2013;13:714–726. doi: 10.1038/nrc3599. [DOI] [PubMed] [Google Scholar]
- 55.Levine AJ, Puzio-Kuter AM. The control of the metabolic switch in cancers by oncogenes and tumor suppressor genes. Science. 2010;330:1340–1344. doi: 10.1126/science.1193494. [DOI] [PubMed] [Google Scholar]
- 56.Cairns RA, Harris IS, Mak TW. Regulation of cancer cell metabolism. Nat Rev Cancer. 2011;11:85–95. doi: 10.1038/nrc2981. [DOI] [PubMed] [Google Scholar]
- 57.Schulze A, Harris AL. How cancer metabolism is tuned for proliferation and vulnerable to disruption. Nature. 2012;491:364–373. doi: 10.1038/nature11706. [DOI] [PubMed] [Google Scholar]
- 58.Albino D, et al. ESE3/EHF controls epithelial cell differentiation and its loss leads to prostate tumors with mesenchymal and stem-like features. Cancer Res. 2012;72:2889–2900. doi: 10.1158/0008-5472.CAN-12-0212. [DOI] [PubMed] [Google Scholar]
- 59.King MP, Attardi G. Isolation of human cell lines lacking mitochondrial DNA. Methods Enzymol. 1996;264:304–313. doi: 10.1016/s0076-6879(96)64029-4. [DOI] [PubMed] [Google Scholar]
- 60.Becker S, Groner B, Müller CW. Three-dimensional structure of the Stat3beta homodimer bound to DNA. Nature. 1998;394:145–151. doi: 10.1038/28101. [DOI] [PubMed] [Google Scholar]
- 61.Gibbons DL, et al. Molecular dynamics reveal BCR-ABL1 polymutants as a unique mechanism of resistance to PAN-BCR-ABL1 kinase inhibitor therapy. Proc Natl Acad Sci USA. 2014;111:3550–3555. doi: 10.1073/pnas.1321173111. [DOI] [PMC free article] [PubMed] [Google Scholar]
- 62.Case DA, et al. The Amber biomolecular simulation programs. J Comput Chem. 2005;26:1668–1688. doi: 10.1002/jcc.20290. [DOI] [PMC free article] [PubMed] [Google Scholar]
- 63.Feig M, et al. Performance comparison of generalized born and Poisson methods in the calculation of electrostatic solvation energies for protein structures. J Comput Chem. 2004;25:265–284. doi: 10.1002/jcc.10378. [DOI] [PubMed] [Google Scholar]
Associated Data
This section collects any data citations, data availability statements, or supplementary materials included in this article.


