Significance
Protein design from first principles is developing rapidly for structural elements, binding domains, and protein–protein interactions. Design of structural elements to generate predictable changes in the fundamental properties of enzymatic catalysis remains challenging, requiring input from protein dynamics and the quantum chemical effects of transition state formation and barrier crossing. Human purine nucleoside phosphorylase (PNP) has a well-understood mechanism of catalysis, which includes rapid protein dynamics. PNP was used in a design program to alter the catalytic-site response to heavy-atom substitution in the enzyme protein. Native PNP exhibits slowed chemistry when made heavy with 2H, 13C, and 15N. We succeeded in designing a second-sphere mutation with improved promoting vibrations to catalyze faster chemistry in response to heavy PNP.
Keywords: heavy enzyme, transition path sampling, purine nucleoside phosphorylase, enzyme design, femtosecond dynamics
Abstract
Heavy-enzyme isotope effects (15N-, 13C-, and 2H-labeled protein) explore mass-dependent vibrational modes linked to catalysis. Transition path-sampling (TPS) calculations have predicted femtosecond dynamic coupling at the catalytic site of human purine nucleoside phosphorylase (PNP). Coupling is observed in heavy PNPs, where slowed barrier crossing caused a normal heavy-enzyme isotope effect (kchem light/kchem heavy > 1.0). We used TPS to design mutant F159Y PNP, predicted to improve barrier crossing for heavy F159Y PNP, an attempt to generate a rare inverse heavy-enzyme isotope effect (kchem light/kchem heavy < 1.0). Steady-state kinetic comparison of light and heavy native PNPs to light and heavy F159Y PNPs revealed similar kinetic properties. Pre–steady-state chemistry was slowed 32-fold in F159Y PNP. Pre–steady-state chemistry compared heavy and light native and F159Y PNPs and found a normal heavy-enzyme isotope effect of 1.31 for native PNP and an inverse effect of 0.75 for F159Y PNP. Increased isotopic mass in F159Y PNP causes more efficient transition state formation. Independent validation of the inverse isotope effect for heavy F159Y PNP came from commitment to catalysis experiments. Most heavy enzymes demonstrate normal heavy-enzyme isotope effects, and F159Y PNP is a rare example of an inverse effect. Crystal structures and TPS dynamics of native and F159Y PNPs explore the catalytic-site geometry associated with these catalytic changes. Experimental validation of TPS predictions for barrier crossing establishes the connection of rapid protein dynamics and vibrational coupling to enzymatic transition state passage.
Dynamic motions essential for enzyme catalysis occur on timescales from milliseconds for conformational changes to femtosecond bond vibrations associated with chemistry at catalytic sites. The millisecond motions are linked to structural changes during substrate binding (1) and product release, whereas the femtosecond motions are involved in transition state (TS) formation. Alterations of the femtosecond dynamics by isotope substitution in enzymes influence the probability of TS barrier crossing when protein femtosecond motions are coupled to chemistry at catalytic sites (2, 3).
The femtosecond dynamical effects in heavy purine nucleoside phosphorylase (PNP) on catalysis have been observed experimentally and have been explained by computational transition path sampling (TPS) (4, 5). TPS can provide insight into the atomic details of chemical reactions without prior knowledge of the reaction coordinate (6–8).
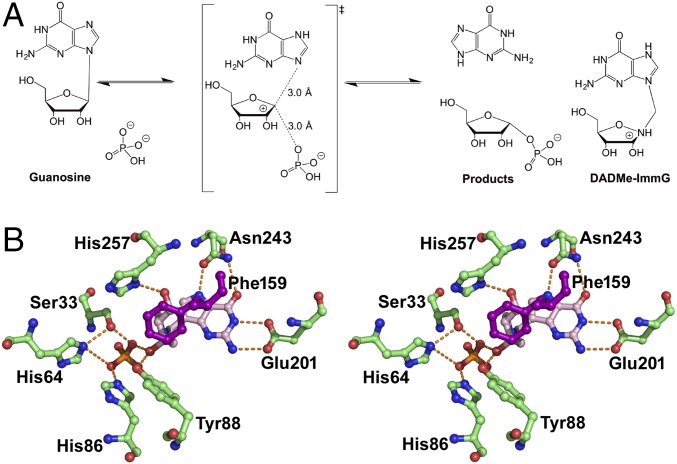
Human PNP is a homotrimer that catalyzes the reversible phosphorolysis of 6-oxypurine nucleosides and 6-oxypurine-2′-deoxynucleosides to generate the corresponding purine bases and α-d-ribose (or 2-deoxy-α-d-ribose) 1-phosphates (Fig. 1) (9). PNP provides the only metabolic pathway for the degradation of 2′-deoxyguanosine in human cells. Human genetic deficiency of PNP impairs expansion of activated T cells as a consequence of the accumulation of dGTP specifically in activated T cells. An unbalanced deoxynucleotide triphosphate pool leads to apoptotic cell death in the activated T-cell population, with no effect on quiescent T cells (10). The inhibition of PNP is reported to be therapeutic in T-cell lymphoma and gout disease in clinical trials (11, 12).
Fig. 1.
(A) Guanosine phosphorolysis and TS of the reaction catalyzed by human PNP. The reaction is catalyzed in an SN1-like mechanism via a ribocationic TS. α-d-Ribose 1-phosphate and guanine are the products. DADMe–ImmG is a TS analog with a picomolar dissociation constant for human PNP. (B) Stereoview of the catalytic site of PNP–DADMe–ImmG–PO4 crystal structure including residues Asn243, His257, and the position of Phe159, contributed from the neighboring monomer.
The TS structure of human PNP has been solved by kinetic isotope effect (KIE) analysis and found to be a near fully dissociated ribocation, characteristic of a classic SN1 mechanism (Fig. 1) (13). The purine leaving group and phosphate nucleophile are both activated by the enzyme, distorting the symmetry of the normal modes for phosphate and causing the bound purine to exhibit altered spectral properties (14, 15). In the femtosecond time period approaching the TS, His257 is hydrogen bonded to the ribosyl 5′-hydroxyl group and directs O5′ toward the O4′ of the purine ring, thus destabilizing the ribosidic bond to facilitate departure of the purine leaving group toward the TS (16). This motion of His257–O5′–O4′ is one of the enzyme-reactant promoting vibrations, facilitating TS formation (4, 5). The motion is symmetrically coupled to the reaction coordinate and is distinct from the antisymmetrically coupled environmental bath that forms a Marcus theory-like environment (17).
The promoting vibrations of PNP, including His257 and its role in reaction chemistry, have been computationally studied by TPS (1). Heavy PNP labeled with 15N, 13C, and nonexchangeable 2H has slowed pre–steady-state catalytic-site chemistry and has a lower probability of barrier crossing, but unchanged steady-state kinetic properties (2). Slowed chemistry in heavy PNP has been interpreted as a mass-dependent slowed femtosecond dynamical search for the catalytic-site geometry permitting TS formation and barrier crossing. It has also been noted that heavy isotope-labeled PNP alters the nuclear mass and bond vibrational frequencies without affecting the electrostatics of the enzyme according to the Born–Oppenheimer approximation (2). Speculation that heavy-enzyme effects in PNP are dominated by electronic properties of deuterium (18), rather than nuclear mass, has been disproven (3).
Here, we explored mutants of PNP by TPS analysis of amino acids adjacent to the residues directly involved in the catalytic site. The goal was to design a structural variant of heavy-enzyme PNP in which the heavy enzyme has an improved rate of catalytic-site chemistry by facilitating TS formation and barrier crossing. This design program was motivated by the combined TPS computational and experimental studies on native and heavy Escherichia coli dihydrofolate reductase. This enzyme differs from PNP by exhibiting no heavy-enzyme effect on barrier crossing (19, 20).
TPS calculations predicted that a F159Y mutation in PNP would facilitate barrier crossing in this altered heavy-atom PNP. Kinetic and structural characterization of light and heavy F159Y PNPs established that the TPS-predicted alterations in the femtosecond motions linked to chemical barrier crossing does indeed facilitate TS formation.
The O5′–O4′ atomic compression in native PNP is coordinated with TS barrier crossing, but in the native heavy enzyme, this motion is mistimed, leading to a less frequent formation of the TS (4). In addition, the value of this distance during the reaction event differs between the heavy and native PNP enzymes. In the heavy F159Y mutant, the heavy amino acids increase the probability of finding the TS, that is, the dynamical characteristics that lead to TS formation have been restored to overcome the heavy-atom effect. Specifically, both the timing of the compression and the extent of compression to its minimal value have been improved.
Results and Discussion
Enzyme Design Strategy.
Our goal was to alter the catalytic effects that heavy isotopic substitution caused in the chemistry of human PNP relative to the light protein. After examination of the geometries of the active sites of the native and heavy enzymes and of the reactive trajectories of the previous analysis (5), the goal was to identify a residue close to His257 with an orientation that would favor either compression of the His257–O5′–O4′ oxygen atoms identified as the mass-influenced motion of His257, or directly influence the motion of O5′. The catalytic site of the PNP enzyme includes a residue, Phe159, belonging to the adjacent monomer, in a hydrophobic loop, immediately conterminous to the ribosyl moiety (Fig. 1B). It is not a highly conserved amino acid among the PNPs. Its side chain is pointing toward the active site but is not in van der Waals contact with the reactants. The position of the aromatic ring is parallel to the His257 ring and is placed close to atoms ND1 of His257 and is therefore in a position to influence the motion of the His257–O5′–O4′ promoting vibration (Fig. 1B). The TPS analysis suggested that the orientation and location make Phe159 a candidate for mutation.
Mutation of Phe159 to tyrosine (hereafter F159Y) alters the character by adding a hydroxyl group. This mutation was selected with the expectation that the altered residue would help position His257 to interact favorably with O5′ in the heavy PNP and increase the probability of optimizing interactions toward the TS.
Effects of F159Y Mutation on Kinetics.
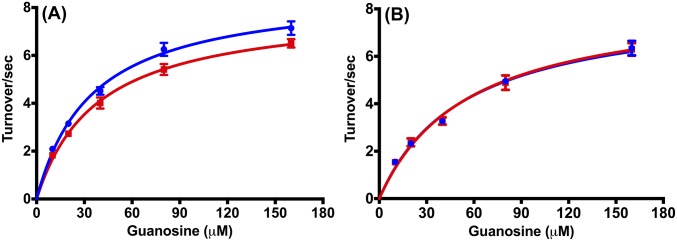
Steady-state Michaelis–Menten kinetics for the light- and heavy-isotope–labeled PNPs were measured for guanosine phosphorolysis (Fig. S1). The kcat and Km values for light and heavy native PNPs, and for light and heavy F159Y PNPs are largely unchanged by enzyme mass. Purine leaving-group product release is rate limiting in steady-state kinetic analysis for human PNP and is limited by large loop motions (21). The kinetic results indicate the loop conformational changes related to product release are not strongly affected by mutating native PNP to F159Y PNP or by the mass change between the light and heavy F159Y PNPs (Fig. S2 and S3).
Fig. S1.
Steady-state kinetics curves for guanosine phosphorolysis catalyzed by light (blue) and heavy (red) PNPs. A shows enzyme kinetics curves for wild-type PNPs, and B shows for F159Y PNPs. All PNPs showed kinetic parameters within experimental error for the phosphorolysis of guanosine in Michaelis–Menten kinetics analysis.
Fig. S2.
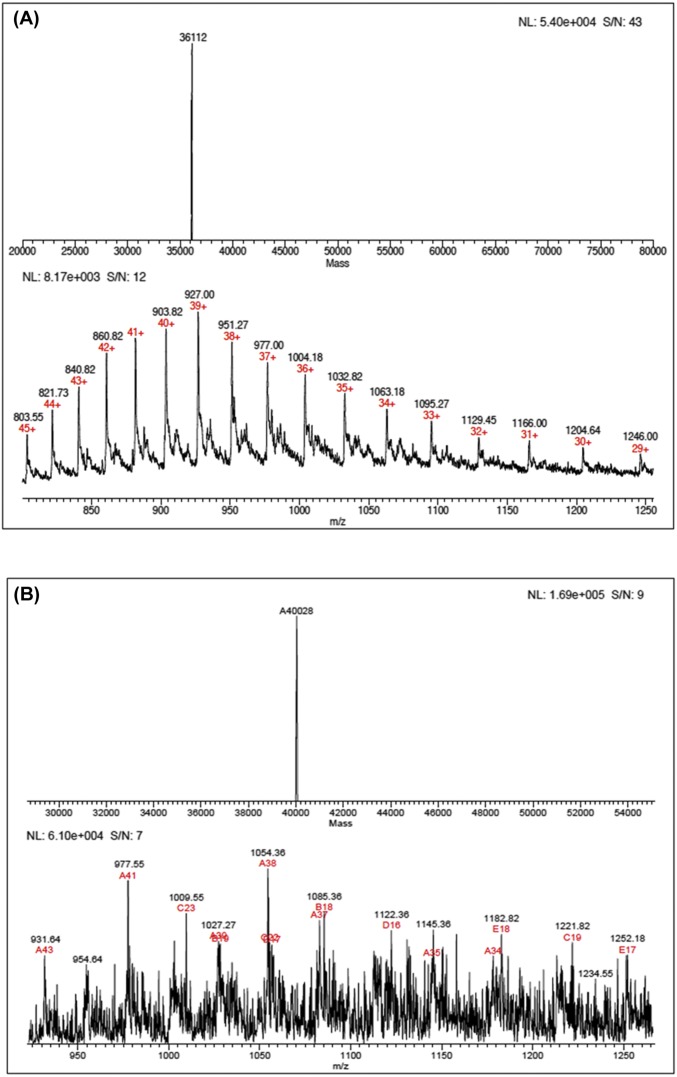
LC-ESI-MS analysis of light (A) and heavy (B) wild-type PNPs. The masses were 36,112 Da for native PNP and 40,028 Da for heavy PNP to give a 10.8% increase in mass for the labeled enzyme.
Fig. S3.
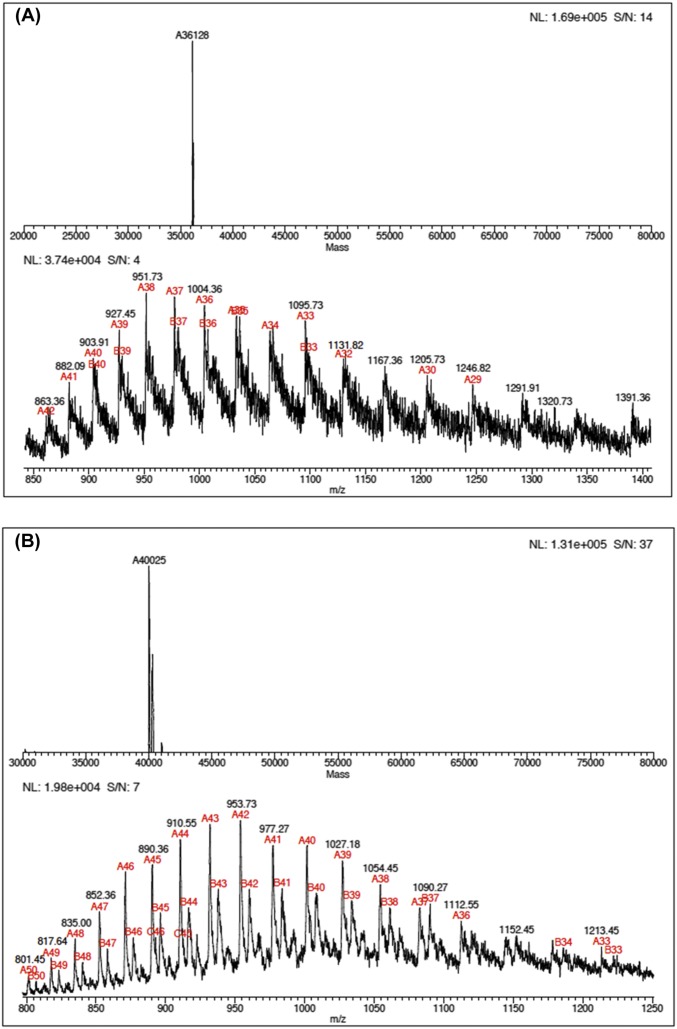
LC-ESI-MS analysis of light (A) and heavy (B) F159Y PNPs. The masses were 36,128 Da for light F159Y PNP and 40,025 Da for heavy F159Y PNP to give a 10.7% increase in mass for the labeled enzyme.
In contrast to the unchanged kcat values found for heavy and light F159Y PNPs, the Km value is modestly increased by the increased mass of F159Y PNP. Steady-state kinetic rates are governed by the slow conformational changes linked to substrate binding and product release. However, the enzymatic mass effects on the chemical step are also linked to the internal enzymatic step of barrier crossing, the probability of finding the TS for enzyme–substrate complexes. Guanosine bound to F159Y PNP shows a larger forward chemical commitment (see below), consistent with contributions from the chemical step in the Km value according to the Michaelis–Menten formulation.
Catalytic-Site Chemistry Predicted by TPS.
The dynamics of the His257–O5′–O4′ distance compression is altered by heavy-atom substitutions in native PNPs, and this His257–O5′–O4′ parameter is restored in the designed heavy F159Y PNP mutant (Table 1). Both light and heavy F159Y PNPs achieve full compression comparable to that of native light PNP. However, in the light F159Y, there is mistiming, as the O5′–O4′ distance compression is not coordinated with TS barrier crossing but happens well before the TS formation. Note in the heavy F159Y enzyme the compression is not mistimed. Note also that, in the native heavy enzyme, this compression was also mistimed, reaching its minimal value well after the TS has been formed.
Table 1.
PNP–guanosine–PO4 O5′–O4′ distances in the reaction coordinate
| PNPs | Minimum distance, Å | From TS | 10 fs before TS, Å | At the TS, Å |
| Light PNP | 2.53 ± 0.06 | −17 to +3 fs | 2.57 ± 0.04 | 2.56 ± 0.07 |
| Heavy PNP | 2.62 ± 0.10 | +36 to +68 fs | 2.93 ± 0.05 | 2.94 ± 0.06 |
| Light F159Y PNP | 2.56 ± 0.10 | −40 to −15 fs | 2.79 ± 0.08 | 3.02 ± 0.09 |
| Heavy F159Y PNP | 2.54 ± 0.06 | −16 to −4 fs | 2.59 ± 0.07 | 2.60 ± 0.06 |
The distances are the average of at least 120 barrier crossings from TPS analysis for each species of PNP.
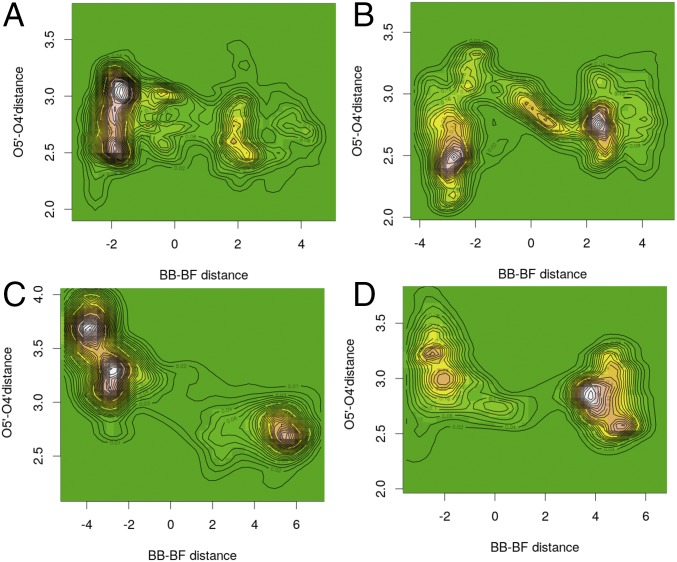
Contour maps of the O5′–O4′ distance were developed as a function of reaction coordinate progression, measured by the difference of bond breaking at C1′–N9 minus the bond forming at C1′–Op distances (Fig. 2). For the SN1 mechanism of PNP, the TS is near zero on the abscissa (Fig. 2). Plots for all four enzymes, spanning the 500-fs TPS analysis, depict the probability for these specific measures derived from the ensembles of the 210 or 120 reactive trajectories generated with TPS for native and F159Y PNPs, respectively. They represent the most probable paths of reaction, when these paths are parameterized by the O5′–O4′and bond-breaking and bond-forming distances.
Fig. 2.
Projections of histogrammed densities of the structures along all reaction trajectories on the plane of the O5′–O4′ oxygen distance vs. bond-breaking (BB)–bond-forming (BF) distance, for native light PNP (A), native heavy PNP (B), light F159Y PNP (C), and heavy F159Y PNP (D). The “terrain” color map (green for “plains,” i.e., zero density, up to white for “mountains,” i.e., maximum density of structures) represents the allocation of a pair of the above distances among structures along the reaction path. Contour maps that join points with equal density have also been drawn.
For native PNP, the O5′–O4′ distance is highly populated at ∼3 Å for the reactant state and becomes shorter as reactive trajectories approach the TS, where it reaches a minimum of 2.56 Å (Table 1 and Fig. 2A). Heavy F159Y reactive trajectories follow similar paths as the native enzyme, with the O5′–O4′ reactant distance highly populated at 3.25 Å and reaching a minimum of 2.60 Å at the TS (Fig. 2D). In contrast, native heavy PNP reactive trajectories have the O5′–O4′ distance highly populated at 2.5 Å for reactants (Fig. 2B). The distance increases along the reaction coordinate and has a distance of 2.94 Å at the TS. Finally, for the light F159Y PNP, the O5′–O4′ distance is highly populated at 3.3–3.6 Å for reactants, and its distance decreases to only 3.02 Å at the TS, consistent with this being the least catalytically active species of these PNPs (Fig. 2C).
The difference in the dynamical behavior of His257-linked compression of the ribosyl O5′–O4′ distance for heavy and light F159Y PNP is related to the probability of TS formation. This dynamic motion provides a partial explanation for the improved barrier crossing for heavy F159Y compared with the light F159Y. Formation of the TS for PNP also requires purine leaving-group interactions to be coordinated with ribocation formation and phosphate activation. An additional leaving-group interaction is the double-hydrogen bond interaction between Asn243 and the purine base, and is considered below.
The geometrical properties of the TS structures for native and F159Y PNPs were examined to explore differences that can further illuminate the central differences (Table S1). The bond-breaking and bond-forming distances of the mutated enzymes at the TSs are different. Heavy F159Y and native PNPs are closely related, whereas the bond-breaking distance in light F159Y is larger by 0.5 Å and the bond-forming distance by 0.20 Å, a loose TS. Earlier studies with the TS structure of human PNP also demonstrated that mutations remote from the catalytic sites are capable of altering TS structure (22).
Table S1.
Average bond-breaking and bond-forming distances at the TS
| PNPs | C1′–N9, Å | C1′–Op, Å |
| Light | 2.59 ± 0.20 | 2.20 ± 0.13 |
| Heavy | 2.46 ± 0.22 | 2.54 ± 0.18 |
| Light F159Y | 3.15 ± 0.25 | 2.42 ± 0.17 |
| Heavy F159Y | 2.58 ± 0.23 | 2.22 ± 0.20 |
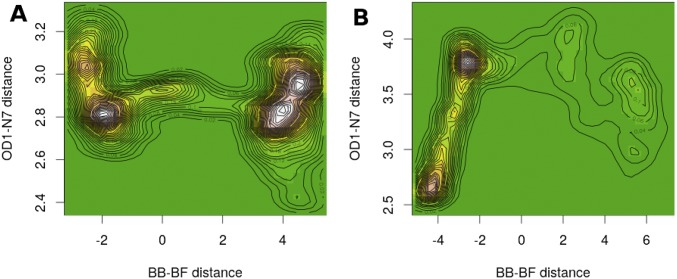
We also examined the differences of interaction between Asn243 and the purine leaving group for light and heavy F159Y PNPs (Fig. S4). The Asn243 interaction that corresponds to the TS (located near the zero of the abscissa) in the heavy F159Y is 2.82 Å. This close interaction does not occur in light F159Y PNP, where Asn243 is 3.8 Å away from the guanosine leaving group at the TS. Because this residue is important for stabilizing the leaving group, it plays a diminished role in light F159Y and is likely to contribute to the inverse heavy-atom isotope effect.
Fig. S4.
Projections of histogrammed densities of the structures along all reaction trajectories on the plane of the OD1(Asn243)–N7(guanosine) distance vs. the difference of bond-breaking (BB)–bond-forming (BF) distances for heavy F159Y (A) and light F159Y (B). The “terrain” color map (green for “plains”, i.e., zero density, up to white for “mountains”, i.e., maximum density of structures) represents the allocation of a pair of the above distances among structures along the reaction path. Contour maps that join points with equal density have also been drawn.
Experimental Analysis of Catalytic-Site Chemistry.
The rate of the chemical step at the catalytic sites of light and heavy PNPs was determined for guanosine phosphorolysis by stopped-flow experiments in single-turnover conditions. The molar concentration of enzyme was in excess of the guanosine concentration to limit chemistry to a single catalytic event and thereby approximate first-order rate constants of guanine formation. This constant is independent of enzyme concentration, an essential experimental condition when comparing enzymes from different purifications. Guanosine in solution or bound to PNP is weakly fluorescent. Conversion to enzyme-bound guanine causes a fluorescent increase, which is lost when guanine is released to solution (15). The fluorescent signal of enzyme-bound guanine is thus a convenient measure of catalytic-site chemistry in PNP. Earlier studies of heavy-PNP catalysis used arsenolysis (2). Here, phosphorolysis was examined in both the computational TPS and the experimental determinations.
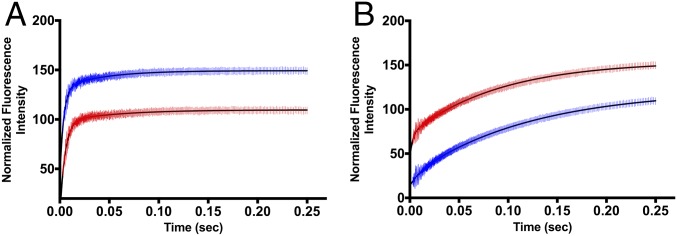
The F159Y mutation in PNP decreased the pre–steady-state chemistry (kchem) 32-fold, from 263 to 8.3 per second. This decreased catalytic efficiency is seen only in single-turnover kinetics as the kcat for steady-state kinetics is similar for native and F159Y PNPs. Similar steady-state kinetics is a consequence of slow product release as the rate-limiting step for PNPs (Table 2). The catalytic-site chemistry heavy-enzyme isotope effect (kchem light/kchem heavy) for native PNP was 1.31, with heavy enzyme slower compared with light enzyme, consistent with, and confirming earlier reports (2, 3). In contrast, the heavy-enzyme isotope effect (kchem light/kchem heavy) for heavy F159Y PNP was 0.75 with the chemical step increased in the heavy enzyme. The mutation has increased the probability of dynamic motions to find the TS configuration in heavy F159Y PNP relative to the light enzyme (Fig. 3 and Table 2). The absolute magnitude of the heavy-enzyme effect is similar, but opposite in sign, for the native and F159Y PNPs. This factor is the sum of timing and frequency influences of heavy-protein motions for the PNPs.
Table 2.
Enzyme kinetic parameters of light and heavy PNPs
| PNPs | kcat, s−1 | Km, μM | kcat/Km, M−1·s−1 | Forward commitment (Y) | Commitment factor (Cf) | kchem, s−1 | Heavy/light KIE |
| Light PNP | 8.7 ± 0.2 | 34.1 ± 2.1 | 2.5 × 10⁵ ± 0.2 | 0.96 ± 0.01 | 24 ± 0.01 | 263 ± 9 | 1.31 ± 0.06 |
| Heavy PNP | 7.8 ± 0.3 | 39.9 ± 4.3 | 2.0 × 10⁵ ± 0.2 | 0.91 ± 0.02 | 10.1 ± 0.02 | 200 ± 6 | |
| Light F159Y PNP | 8.5 ± 0.3 | 56.4 ± 5.3 | 1.5 × 10⁵ ± 0.2 | 0.39 ± 0.003 | 0.64 ± 0.003 | 8.3 ± 0.4 | 0.75 ± 0.04 |
| Heavy F159Y PNP | 8.3 ± 0.4 | 54.2 ± 5.7 | 1.5 × 10⁵ ± 0.2 | 0.72 ± 0.01 | 2.6 ± 0.01 | 11.1 ± 0.2 |
Fig. 3.
Representative averaged stopped-flow traces for single-turnover experiments of wild-type (A) and F159Y PNP mutant (B) for guanosine phosphorolysis with 15 μM PNP catalytic-site concentration and 5 μM guanosine in 50 mM phosphate (Materials and Methods). Single turnovers were obtained. In A, the blue trace is light native PNP, and the red trace is heavy PNP. In B, the blue trace is light F159Y PNP, and the red trace is heavy F159Y PNP. The traces of A were fitted to a double-exponential fit, where the fast phase reports the catalytic-site chemistry rate (kchem) followed by a slower conformational change affecting guanine fluorescence (15). The traces of B were fitted to a single exponential corresponding to the rate of guanine formation. The curves are offset for clarity. The catalytic-site enzyme chemistry rates of light and heavy PNPs are summarized in Table 2.
Dissociation Constant and Isotope Partition Analysis.
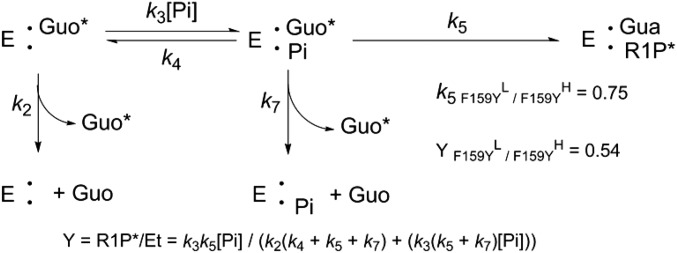
PNP KIEs by stopped-flow analysis gives k5 (k5 = kchem) from kinetic analysis (Fig. 3 and Mechanism 1). An independent analysis of the heavy-enzyme effects on catalysis can be obtained from the isotope partition experiments pioneered by Rose et al. (23). Isotope partition, also known as substrate-trapping or forward-commitment (Cf) experiments, follows the distribution of isotopically labeled guanosine (Fig. S5) from a PNP–guanosine complex after addition of excess unlabeled guanosine and phosphate to initiate the reaction or dissociation of bound, labeled guanosine (Mechanism 1). Pre–steady-state kinetic analysis indicates that the barrier for chemistry in native PNP is higher for heavy than light enzyme, but is lower for heavy than for light F169Y PNP (Fig. 3 and Table 2). For native PNP, guanosine isotope partition experiments demonstrated less bound guanosine converted to product in heavy than light enzyme (2). However, the inverse enzyme KIE for F159Y PNP predicts more bound guanosine should be converted to product in heavy than in light F159Y PNP complexes.
Mechanism 1.
Guanosine isotope partition experiment for F159Y PNP. [1'-14C]Guanosine (Guo*) bound to F159Y PNP partitions to product α-d-[1-14C] ribose 1-phosphate (R1P) by k5 or is released unchanged by steps k2 + k4 + k7 when mixed with excess unlabeled guanosine (Guo) and inorganic phosphate (Pi). The fraction of bound Guo* converted to product (Y) is given by the equation (25). The values for k5 are obtained independently from pre–steady-state kinetics (Fig. 3B). The value for Y is obtained from the isotope partition experiment.
Fig. S5.
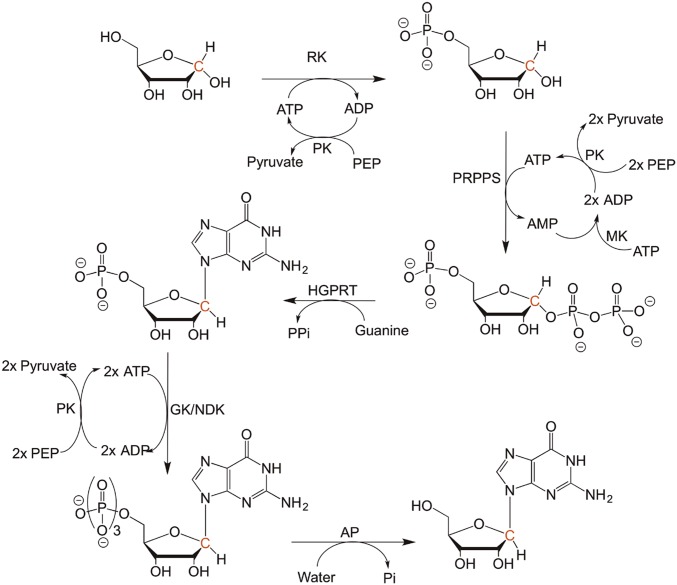
Chemoenzymatic synthesis scheme of [1′-14C]guanosine synthesis. The starting material of the reaction was [1-14C]ribose. The radiolabeled carbon is highlighted with red color. The yield of the synthesized [1′-14C]guanosine was 92% from labeled ribose. The abbreviations of the enzymes use in the synthesis are as follows: AP, alkaline phosphatase; GK, guanylate kinase; HGPRT, hypoxanthine-guanine phophoribosyltransferase; MK, myokinase; NDK, nucleoside diphosphate kinase; PK, pyruvate kinase; PRPPS, phosphoribosyl-α-1-pyrophosphate synthetase; RK, ribokinase.
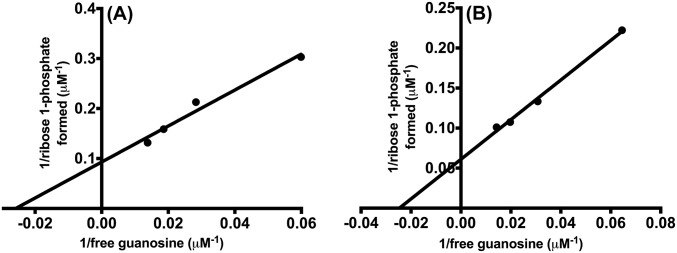
The fraction of bound guanosine converted to product (Y in Mechanism 1) is dependent on k5, the step forming ribose 1-phosphate (R1P) and on steps describing guanosine release without reaction. Quantitation of the E-Guo complex requires knowledge of Kd for heavy and light enzymes. We used the isotope partition method with varied guanosine concentrations to establish the Kd for guanosine under conditions of the isotope partition experiments (24, 25). The Kd values for light and heavy F159Y PNPs were 39 ± 8 and 42 ± 4 μM, respectively (Fig. S6). These values agree well with the reported dissociation constant (Kd) of 40 μM for the native PNP–guanosine complex (15).
Fig. S6.
The PNP-guanosine dissociation constant (Kd) calculation curve for light F159Y PNP (A) and heavy F159Y PNP (B). The isotope-trapping method was used to calculate Kd for PNPs–guanosine complex.
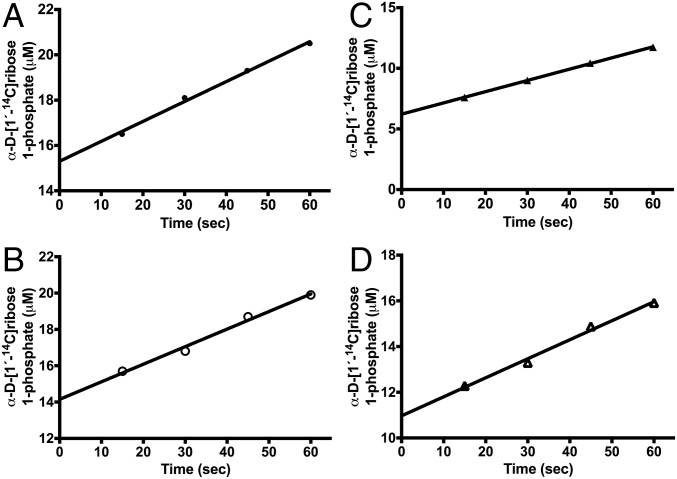
The forward-commitment factors (Cf) for light and heavy PNPs indicate the probability for reactants in the Michaelis complex to be converted to products relative to diffusive release to the solution reactant pool, expressed as the ratio of the rate constants for the chemical step to the rate constant of dissociation of the substrate from the enzyme–substrate complex (Cf = kchem/koff). The fractions of bound guanosine committed to guanosine phosphorolysis (Y in Mechanism 1) were 0.39 ± 0.003 and 0.72 ± 0.01 for light and heavy F159Y PNP, respectively (Fig. 4 and Table 2). The larger forward commitment of heavy F159Y PNP confirms the pre–steady-state analysis that the TS free-energy barrier for heavy F159Y PNP is lower than for light F159Y PNP, an independent analysis of the increased kchem for heavy F159Y PNP. Values for Y obtained by isotope partition analysis also depend on denominator steps k2, k4, and k7. A small increase in one (or more) of these constants for heavy Y159F PNP readily accounts for the slightly larger than expected heavy-isotope Y value (Mechanism 1, and Table 2).
Fig. 4.
Experimental data of [1′-14C]guanosine trapping in the Michaelis complex of PNPs. The ordinate shows the amount of bound reactant committed to product formation in the phosphorolysis of guanosine by PNPs. Equilibrated mixtures of 25 μM PNPs and 80 μM [1′-14C]guanosine (Fig. S5) were mixed with excess guanosine and phosphate at time = 0. The amount of [1′-14C]guanosine converted to [1-14C]α-d-ribose 1-phosphate was extrapolated to t = 0 and compared with the initial PNP-[1′-14C]guanosine concentration to calculate Y of Table 2. Guanosine commitment for light and heavy native PNP are shown in A and B, respectively. Guanosine commitment for light and heavy F159Y PNP are shown in C and D, respectively. The values of Y and Cf are summarized in Table 2.
Opposite to the heavy F159Y PNP effect, catalytic-site guanosine phosphorolysis for native light and heavy PNP gave 0.96 ± 0.01 and 0.91 ± 0.02 fractional trapping of bound guanosine, respectively, consistent with a lower TS barrier for the light form of native PNP (Fig. 4 and Table 2).
Structure of F159Y PNP in Complex with DADMe–ImmG.
The crystal structure of F159Y PNP in complex with DADMe–ImmG (a TS analog) and phosphate was determined at 2.2 Å using crystals obtained by cocrystallizations (detailed in Materials and Methods). The crystal structures of native unliganded [Protein Data Bank (PDB) ID code 1M73] and DADMe–ImmG-bound PNP (PDB ID code 3PHB) are known (26, 27). The structure of the F159Y PNP–DADMe–ImmG–PO4 complex was solved in the P212121 space group with two F159Y PNP trimers in the asymmetric unit (Table S2). The density of DADMe–ImmG is clearly defined in the structure (Fig. 5). Except for the N-terminal His6 tag, all backbone amino acids were readily fit into in the electron density map. A solvent-exposed loop (residues 59–63) with high B factors produced weak density for its side-chain residues.
Table S2.
Data collection and refinement statistics of F159Y PNP–DADMe–ImmG complex
| Homo sapiens F159Y purine nucleoside phosphorylase | |
| Dataset* | DADMe–ImmG complex |
| Unit cell data | |
| Space group | P212121 |
| Cell parameters, Å, ° | A = 104.96, b = 124.27, c = 136.73; α = β = γ = 90 |
| Vm, Å3/Da | 2.1 |
| No. of subunits in the asymmetric unit | 6 |
| Data collection | |
| Beamline | LRL-CAT |
| Wavelength, Å | 0.97931 |
| Temperature, K | 100 |
| Resolution range, Å | 69.17–2.20 (2.24–2.20) |
| Total no. of observed reflections | 606,112 (27,016) |
| No. of unique reflections | 91,303 (4,492) |
| Rmerge, %† | 17.4 (79.3) |
| Rpim, %‡ | 7.2 (35.0) |
| CC1/2, % | 99.3 (70.7) |
| <I/σ(I)>§ | 5.8 (1.8) |
| Completeness, % | 100 (100) |
| Multiplicity | 6.6 (6.0) |
| Wilson B factor, Å2 | 24.0 |
| Refinement | |
| Rwork, %¶ | 21.4 |
| Rfree, %# | 23.8 |
| No. of atoms | 14,370 |
| Protein atoms | 13,392 |
| Ligand atoms | 120 |
| Solvent atoms | 858 |
| Model quality | |
| RMS deviation from ideal value | |
| Bond length, Å | 0.009 |
| Bond angle, ° | 1.4 |
| Average B factor | |
| Protein atoms, Å2 | 36.3 |
| Ligand atoms, Å2 | 20.2 |
| Waters, Å2 | 29.5 |
| Ramachandran plot|| | |
| Most favored regions, % | 97.9 |
| Allowed regions, % | 1.9 |
| Outlier regions, %** | 0.2 |
| PDB entry | 5UGF |
Values in parentheses refer to the highest resolution shell.
Rmerge = (ΣhklΣi|Ii(hkl) − <I(hkl)>|)/ΣhklΣi <Ii(hkl)>, where Ii(hkl) is the intensity of the ith measurement of reflection (hkl) and <I(hkl)> is its mean intensity.
Rpim = (Σhkl[1/(Nhkl − 1)]1/2Σi|Ii(hkl) − <I(hkl)>|)/ΣhklΣi <Ii(hkl)>, where Ii(hkl) is the intensity of the ith measurement of reflection (hkl), <I(hkl)> is its mean intensity, and N is the number of measurements.
I is the integrated intensity, and σ(I) is its estimated SD.
Rwork = (Σhkl|Fo − Fc|)/ΣhklFo, where Fo and Fc are the observed and calculated structure factors.
Rfree is calculated as for Rwork but from a randomly selected subset of the data (5%), which were excluded from the refinement calculation.
Calculated by MOLPROBITY (37).
The residues in the outlier regions are part of high B-factor loops.
Fig. 5.
The crystal structure and subunit–subunit interaction of PNP in complex with DADMe–ImmG and inorganic phosphate. (A) The crystal structure of trimeric human PNP. (B) The omit (Fo − Fc) difference electron density map of the DADMe–ImmG structure at 3.0σ contour level. The (Fo − Fc) difference maps were calculated after 15 cycles of omit refinement by REFMAC5, leaving out the subunit B active-site DADMe–ImmG ligand. The DADMe–ImmG of subunit B (yellow color), bound at the active site, is also surrounded by subunit C (blue color). (C) Superposition of active site residues of wild type (cyan; PDB ID code 3PHB) and F159Y PNP (green; PDB ID code 5UGF) PNPs bound to the TS-analog DADMe–ImmG. New hydrogen bonds appearing as a consequence of the F159Y substitution are shown as dashed lines to Tyr159 and Tyr88. A stereoview version of C is shown in Fig. S7.
DADMe–ImmG is bound in the active site with low B factors, similar to the surrounding protein (Fig. 5). The O3′ of DADMe–ImmG is hydrogen bonded to the hydroxyl of (Tyr88), whereas the O5′ is hydrogen bonded to the side-chain N of His257 (ND1). The His257 in F159Y is offset slightly from its position in native PNP, moved slightly away from bound DADMe–ImmG (Fig. 5). However, the hydrogen bond distance to the O5′ is 2.7, compared with 2.8 Å in native PNP, within error of the experimental analysis, indicating that the bound DADMe–ImmG maintains a similar hydrogen bond interaction. Tyrosine in the F159Y variant was found to hydrogen bond with the hydroxyl group of the adjacent Tyr88. Tyr159 does not make direct contact with catalytic-site reactants. Its nearest approach is to the O3′ of DADMe–ImmG at 3.9 Å (Fig. 5). The F159Y substitution thus moves His257 and Y159 both slightly away from catalytic-site reactants relative to the native PNP–DADMe–ImmG–PO4 complex, consistent with its lower kchem. No other structural changes are apparent near the catalytic site of F159Y PNP (Fig. 5 and Fig. S7). The binding contacts of DADMe–ImmG are the same in native (PDB ID code 3PHB) and F159Y PNP (PDB ID code 5UGF; Fig. S7), within structural uncertainty.
Fig. S7.
The crystal structure of F159Y PNP (single subunit) in complex with TS-analog DADMe–ImmG. (A) Stereoview of the superposition of the overall fold of F159Y PNP complex with DADMe–ImmG (green) with wild-type PNP complex with DADMe–ImmG (yellow) and unliganded wild-type PNP (gray). There are no significant structural difference observed between wild-type and F159Y PNP complex with DADMe–ImmG structure. (B) Stereoview of active-site residues of wild-type (cyan; PDB ID code 3PHB) and F159Y mutant (green; PDB ID code 5UGF) PNPs bound to the TS-analog DADMeImmG. The new hydrogen bond appearing after mutation of F159Y PNP is shown between Tyr159 and Tyr88.
Comparison of TPS and Crystallographic PNP Structures.
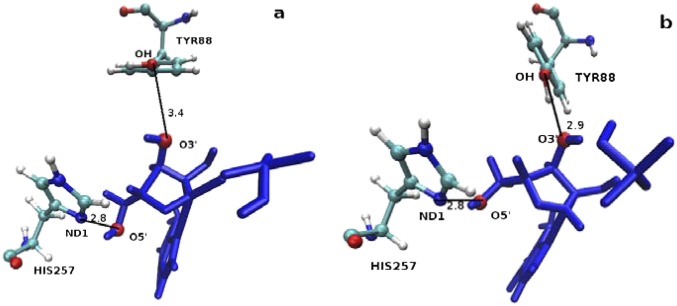
TPS analysis generated reactant-path structures at the TS for heavy and light native and F159Y mutant PNPs. These can be compared with the crystal structures of PNP with DADMe–ImmG and PO4, which is related to the TS by the TS analog interaction. From TPS analysis, no significant differences are evident in the orientation of His257 in the F159Y mutant at or near the TS with all His257ND1 – O5′ distances near 2.8 Å. There is a significant change in the interaction of Tyr88, found in a hydrogen bond to O3′ of DADMe–ImmG in crystal structures. At the TS for F159Y PNP, TPS indicates this distance to be 3.4 and 2.9 Å in the light and heavy F159Y PNPs, respectively. Here, the interaction in the heavy enzyme favors TS formation (Table S3 and Fig. S8). A significant difference appears in the weak interaction between guanosine and Asn243 (3.8 Å at the TPS TS; see above) in F159Y PNP, whereas this is a favorable interaction of 2.9 Å in the crystal structure and is unchanged from native and F159Y PNPs. This difference at the TS is accessible only through the TPS computational approach.
Table S3.
Computationally measured distances of interacting residues in the active site of F159Y PNPs averaged over all trajectories
| Residues | Distance at TS in F159Y PNP, Å | |
| Light | Heavy | |
| ND1(His257)–O5′ | 2.83 ± 0.12 | 2.88 ± 0.05 |
| OH(Tyr88)–O3′ | 3.49 ± 0.06 | 2.93 ± 0.04 |
Fig. S8.
Representative TS structures of interacting residues in the active site of Light F159Y (A) and Heavy F159Y (B).
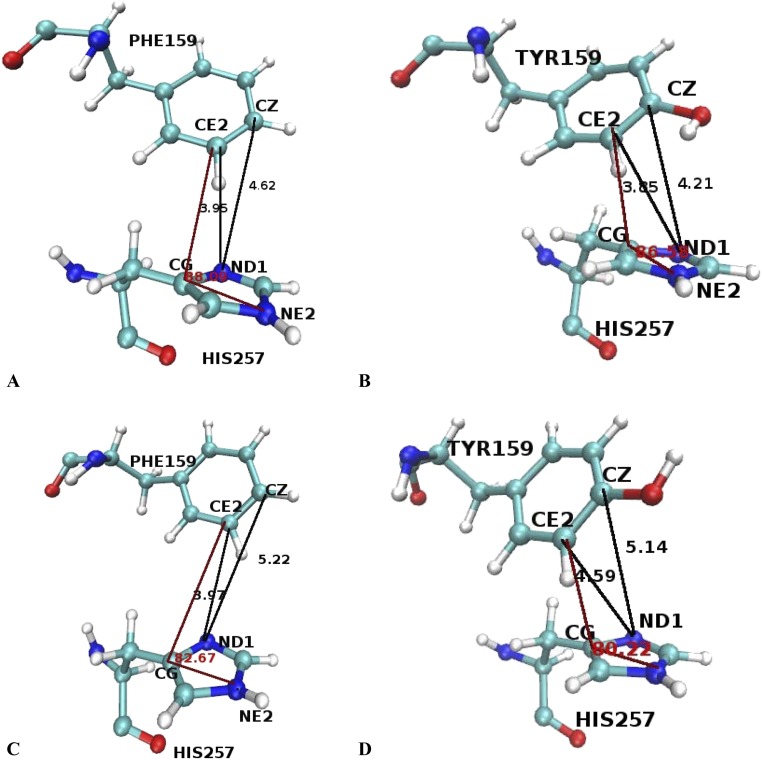
Further analysis of TPS trajectories at the atomistic level reveals differences for the orientations and relative positions of His257 and Phe159 (mutated to Tyr159) at the TS. As shown in Table S4 and Fig. S9, the distance between CE2 of the 159 residue and ND1 of residue His257 is 3.95 Å for the native light and 3.85 Å for the light mutant. The difference between native/mutant light for the distance between CZ of residue 159 and ND1 of His257 is 0.5 Å. The orientation of these two residues is almost identical, taking as reference the angle formed by atom CE2 of residue 159 and atoms CG and NE2 of His257. However, in the light mutant, the tyrosine ring has shifted, so that the oxygen atom of the tyrosine ring faces the nitrogen atom (ND1) of the histidine.
Table S4.
Average distances and angle between residues F159/Y159 and His257 at the TS
| PNPs | CE2 (159)–ND1 (257), Å | CZ(159)–ND1 (257), Å | CE2(159)–CG(257)–NE2(257), ° |
| Light PNP | 3.95 | 4.62 | 88.09 |
| Heavy PNP | 3.97 | 5.22 | 82.67 |
| Light F159Y PNP | 3.85 | 4.21 | 86.58 |
| Heavy F159Y PNP | 4.59 | 5.14 | 80.22 |
Fig. S9.
Geometrical properties comparison between residues F159/Y159 and H257 at the TS of representative trajectories of Native PNP (A)–Light F159Y (B), Native Heavy PNP (C)–Heavy F159Y (D).
For the native heavy and heavy mutant, the orientation of His257 and Phe159 (mutated to Tyr159) does not change significantly, but some important distances do change: the distance between CE2 of the residue 159 and ND1 of residue 257 for the native heavy is 3.97 Å, whereas for the heavy mutant it is 4.59 Å. Similarly to the light enzymes, we note that the tyrosine ring is slightly shifted and tilted, and in a direction perpendicular to the histidine ring the tyrosine oxygen lies directly above the ND1 atom of the histidine ring, which explains the difference in the distances mentioned above.
In summary, the dynamical characteristics that lead to the TS are different between heavy F159Y and light PNP. Specifically, in light F159Y, the O5′–O4’ compression is mistimed, the enzyme exhibits a loose TS, and the interaction of Asn243 that stabilizes the leaving group is weak and plays a diminished role. In addition, we observed a change in the interactions between Tyr88 and the ribose moiety, which are stronger for the heavy F159Y and favor TS formation, and saw differences in the relative position and orientation between Tyr159 and His257. All of the above contribute to the inverse heavy-enzyme isotope effect.
Concluding Remarks.
Complex motions of amino acids and reactants at the catalytic site of PNP vary on the femtosecond timescale to alter the electrostatic forces forming the TS. In heavy PNP, increased mass alters this dynamical search for the TS, leading to a decrease in the probability of barrier crossing. Our goal here was to use TPS to design a simply modified PNP with altered catalytic-site dynamics to increase the probability of finding the TS in an isotopically heavy enzyme. As no such enzymes have yet been reported, there are computational and experimental challenges to this goal. TPS analysis suggested the F159Y mutation would increase the probability of TS formation in a heavy enzyme by restoring important femtosecond motions linked to barrier crossing. The computational design was tested experimentally and fully supported this prediction.
Materials and Methods
Computational Methods.
We used transition path sampling (6–8) to generate and analyze reactive trajectories and the TS ensemble. TPS is a Monte Carlo search in reactive trajectory space where trajectories are generated according to a Boltzmann distribution; therefore, their ensemble represents the most dynamically probable reactive pathways. We used the CHARMM (28) molecular dynamics package for all simulations. We generated 210 and 120 reactive trajectories of 500 fs for the native and mutated PNPs, respectively. From the harvested reactive trajectories, we identified a TS ensemble of 25 uncorrelated TS structures for the native enzymes and 20 for the mutated enzyme. The contour maps in Fig. 2 were calculated with the R statistics package. Full computational details are available in Supporting Information.
Site-Directed Mutagenesis.
Site-directed mutagenesis to introduce the second-sphere mutation F159Y in PNP used the Q5 site-directed mutagenesis kit from New England Biolabs as outlined in Supporting Information.
Expression and Purification of Light and Heavy PNPs.
The natural abundance (light) and heavy PNPs (wild type and F159Y mutant) were expressed in E. coli(DE3)pLysS strain using a pCR-T7/NT-TOPO expression vector. The expressed PNPs contained 6-histidine affinity tag at the N terminus. The purification of light and heavy PNPs were done as described previously with some modifications, as described in Supporting Information (5).
Steady-State Kinetics.
The enzyme kinetics of light and heavy PNPs were performed using a Cary-100 spectrophotometer (Varian) at 25 °C. Reaction mixtures contained 50 mM Tris·HCl (pH 7.4), 50 mM inorganic phosphate (Pi), pH 7.4, and varying guanosine concentrations (10–160 μM). Absorbance was recorded at 258 nm after addition of 10 nM light- or heavy-PNP enzymes. The initial rates of absorbance change were calculated with the Varian software. The molar extinction coefficient of −5,500 M−1·cm−1 was used for the conversion of guanosine to guanine. The kinetic data fitting was done using Eq. 1, where ν is the initial velocity, V is the maximal velocity, S is the concentration of variable substrate, and Km is the Michaelis constant for the variable substrate:
| [1] |
Single-Turnover Rate Constant.
Single-turnover pre–steady-state constants were determined using stopped-flow spectrofluorometer (Applied Photophysics; dead time, ≤1.25 ms) at 25 °C. The increase in the fluorescence signal was measured upon the formation of enzyme-bound guanine. The reaction was excited at 280 nm with slit width of 1 mm, and the fluorescence signal above 305 nm was collected using WG305 Scott filter positioned between the photomultiplier and the sample cell. The fluorescence spectra were monitored for 250 ms, and 1,000 points were collected for individual rate curve analysis. Syringe-1 contained 50 mM Tris·HCl (pH 7.4), 50 mM Pi (pH 7.5), and 30 μM either light- or heavy-PNP enzymes. Syringe-2 contained 50 mM Tris·HCl (pH 7.5), 50 mM Pi (pH 7.4), and 10 μM guanosine.
Dissociation Constant and Commitments of F159Y PNP–Guanosine Complex.
The dissociation constants (Kd) and forward-commitment factors (Cf) of light and heavy F159Y PNP–guanosine complexes were determined using isotope-trapping methods of Rose et al. (23, 24), as detailed in Supporting Information.
Cocrystallization, Structure Determination, Refinement, and Analysis.
Light F159Y PNP and DADMe–Immucillin-G (DADMe–ImmG) were used for the crystallographic inhibitor binding studies as detailed in Supporting Information.
Computational Methods
The starting point for transition path sampling analysis was crystal structure 1RR6 from the Protein Data Bank (PDB). It is a homotrimeric human PNP structure in complex with Immucillin-H and phosphate. To build our model, we modified the TS inhibitor (Immucillin-H) to the guanosine substrate by replacing atoms N4 with O4 and C9 with N9. His257 was modeled in the neutral form with the proton at NE leaving ND1 to interact with 5′-hydroxyl of the ribose ring. The catalytic-site residue Glu201 was deprotonated at neutral pH to stabilize the purine base and atom N7 of the purine base was protonated. In the heavy-PNP enzymes, we manually modified the atomic masses of C, N, and nonexchangeable H of the amino acids with heavy isotopes. All crystallographic waters were retained for both native and mutated structures.
Simulations for native and heavy PNPs and their mutated versions were performed separately following the same protocol.
The system was partitioned into quantum-mechanics (QM) and molecular-mechanics (MM) regions, where the QM region consisted of 40 atoms including the protonated N-guanosine and HPO42− moieties and was modeled using the PM3 method. All remaining atoms of the protein, including ions, and solvent water molecules form the MM region. No covalent bonds between the atoms of the QM and the MM regions exist, so we did not use link atoms.
The protein was solvated in a sphere of waters of 60-Å radius, using explicit TIP3 water molecules, and then the system was neutralized by placing 18 chloride and 29 sodium ions in the simulation system. After the setup, the protein was minimized using 150 steps of steepest descent (SD) followed by 6,000 steps of adopted-basis Newton–Raphson minimization. The heating was conducted slowly from 0 to 300 K for 70 ps while any harmonic constraints applied to the system were gradually released. For the last 10 ps, we switched the QM/MM on. Following the heating process, the system was equilibrated at 300 K with the QM/MM on for 150 ps.
TPS was used to generate and analyze the structure of reactive trajectories, according to the following steps. First, one defines the order parameters by the C1′–N9 bond-breaking and C1′–Op bonding-forming distances, such that the reactant region contains all configurations with the C1′–N9 bond length <1.7 Å and the C1′–Op bond length >1.65 Å, whereas the product region contains all configurations with C1′–N9 bond length >1.7 Å and C1′–Op bond length <1.65 Å. Then we perturb the momenta of a randomly chosen slice of this reactive trajectory and propagate using the new momenta until we generate a new reactive trajectory. The initial reactive trajectory is generated by applying a harmonic force with constant 65 (kcal/mol)/Å2 on both the bond-breaking and bond-forming distances followed by propagation for 250 fs. Using this first biased trajectory as a seed, we iterate until a sufficient set of reactive trajectories is generated.
Next, we perform committor analysis to locate the TS defined as the time slice with the property that new trajectories starting from that slice have probability 0.5 to reach reactants or products. The set of these configurations known as isocommittor structures are the definition of a TS ensemble (TSE). An advantage of the TPS method is that one can generate the TSE without prior knowledge of the reaction coordinate.
The contour maps in Fig. 2 were calculated with the statistics package R, using the two-dimensional kernel density estimation package kde2d (MASS).
Experimental Methods
Materials.
Deuterium oxide (D2O, 99.8%), [U-13C6, 1, 2, 3, 4, 5, 6 6-2H7]glucose, and [15N]ammonium chloride were purchased from Cambridge Isotopes Laboratories. d-[1-14C]Ribose was purchased from Moravek Biochemicals. Pyruvate kinase (PK), myokinase (MK), guanylate kinase (GK), nucleoside diphosphate kinase (NDK), and alkaline phosphatase (AP) were from Sigma-Aldrich. Ribokinase (RK), hypoxanthine-guanine phophoribosyltransferase (HGPRT), and phosphoribosyl-α-1-pyrophosphate synthetase (PRPPS) were prepared as previously described by this laboratory (29–31). All other chemicals and reagents were obtained from commercially available sources and were used without further purification.
Synthesis of [1-14C]Guanosine.
[1′-14C]Guanosine was enzymatically synthesized from [1-14C]ribose and guanine in coupled reactions at room temperature (Fig. S5). A reaction (1 mL) containing 1 mM [1-14C]ribose, 20 mM phosphoenolpyruvate (PEP), 2 mM ATP, 2.2 mM guanine, 50 mM MgCl2, 100 mM phosphate buffer (pH 8.0), 50 mM KCl, 1 mM DTT, 0.2 units/mL PRPPS, 4 units/mL PK, 2 units/mL MK, 2 units/mL HGPRT, 2 units/mL RK, 2 units/mL GK, and 2 units/mL NDK was incubated overnight at room temperature for GTP synthesis. GTP was purified using C-18 reverse-phase HPLC column using 50 mM triethylamine, 50 mM acetic acid, and 5% methanol, pH 5.3. The purified GTP was incubated with alkaline phosphatase (AP) to remove the triphosphate group. A reaction (1 mL) containing purified GTP with 50 mM Tris⋅HCl (pH 7.8), 100 mM NaCl, 10 mM MgCl2, 1 mM DTT, and 2 units/mL AP was incubated at room temperature for 3 h. [1-14C]Guanosine was purified using C-18 reverse-phase HPLC using a gradient (buffer A: 0.1% formic acid; buffer B: 0.05% formic acid and 50% acetonitrile). After HPLC purification, [1-14C]guanosine was purified on a strong anion exchange column (Dowex-1; chloride) to remove phosphate contamination. The synthesis was based on the reported synthesis of inosine monophosphate and adenosine monophosphate, with some modifications (Fig. S5) (29–31). The yield of [1-14C]guanosine from [1-14C]ribose as limiting reagent was 92%. Purified [1′-14C]guanosine was used for pulse-chase experiments to determine the dissociation constants of F159Y PNP–guanosine complexes and forward commitment of PNPs for guanosine phosphorolysis.
Site-Directed Mutagenesis.
The sequences of the primers pair (mutated codon is underlined) were as follows: forward, 5′-TGGAGATCGTTATCCTGCCATGTC-3′; reverse, 5′-AACCTTTCATCATTGGGC-3′. Mutagenesis was performed in accordance with the manufacturer’s protocol. The PCR product, after template DNA digestion, was transformed into the Escherichia coli BL21(DE3)pLysS (Invitrogen) strain for selection and expression. The mutation was confirmed by sequencing (GENEWIZ).
Expression and Purification of Light Wild-Type and F159Y PNPs.
A colony from an overnight nutrient agar plate was used to inoculate 20 mL of LB medium containing carbenicillin (100 µg/mL), and cells were grown at 37 °C overnight with shaking (200 rpm; New Brunswick Scientific, I26). The culture was used to inoculate 1 L of LB medium containing carbenicillin (100 µg/mL). After growth at 37 °C for 3–4 h, the OD600 reached 0.7–1.0, and IPTG (1.0 mM) was added for the induction of PNP expression. After 8–12 h at 37 °C in a shaker at 180 rpm (New Brunswick Scientific, I26), the harvested cells were suspended in lysis buffer (50 mM Tris⋅HCl, pH 7.6) containing 200 µg/mL lysozyme and incubated for 30 min at 4 °C. Brief sonication assisted cell lysis, followed by centrifugation at 30,000 × g for 30 min at 4 °C. The supernatant was mixed with preequilibrated Ni-NTA resin and incubated at 4 °C for 2 h. The mixture was loaded into a Bio-Rad Econo column and was washed with 200 mL of wash buffer (50 mM Tris⋅HCl, 20 mM imidazole, pH 7.6). PNP was eluted in 50 mM Tris⋅HCl, pH 7.6, containing 500 mM imidazole. The PNP protein was concentrated to 4 mL and dialyzed against 50 mM phosphate buffer pH 7.6 (1 L) containing 0.5% activated charcoal at room temperature for 36 h to remove bound purines. After dialysis against 50 mM Tris⋅HCl, pH 7.6, the protein was resolved on a high-load Superdex 200 (16/60) preparation-grade size-exclusion chromatography column preequilibrated with the same buffer. The purity of the protein was determined by SDS/PAGE. The concentration of protein was determined by absorbance at 280 nm using the calculated molar extinction coefficient (Protparam; web.expasy.org/protparam/). After purification, the protein was used for enzyme assays, stopped-flow, mass spec experiments, or flash frozen for later use in the gel filtration buffer.
Expression and Purification of Heavy Wild-Type and F159Y PNPs.
Heavy wild-type and F159Y PNPs were expressed in E. coli(DE3)pLysS. Cells were grown in M63 minimum medium prepared in 99.8% D2O. The growth media was supplemented with [U-13C6, 1, 2, 3, 4, 5, 6 6-2H7]glucose (3 g/L), [15N]ammonium chloride (1 g/L), and 100 μg/mL carbenicillin at 37 °C. The expression and purification of heavy wild-type and F159Y PNPs were done by following the same procedure as described for light enzymes.
Characterization of PNP Masses.
Light and heavy wild-type PNP and F159Y mutants were expressed and purified to homogeneity as described above. Mass measurements of native and labeled F159Y PNP were made by liquid chromatography (LC)–electrospray ionization (ESI)–MS to quantitate the mass increase and efficiency of heavy-atom labels in isotopically labeled PNP (Figs. S2 and S3). The heavy PNPs were isotopically labeled by growth of E. coli expressing human PNP in medium fully labeled with 15N, 13C, and 2H precursors for protein synthesis. Purification from cell extracts was performed in H2O, to yield PNPs labeled in all H, C, and N atoms except for the exchangeable hydrogens replaced by solvent 1H during purification and storage.
Dissociation Constant of F159Y PNP–Guanosine Complex.
Equilibrium mixtures (20 μL) containing 25 μM light or heavy PNPs, varying concentrations of [1′-14C]guanosine (20, 40, 60, and 80 μM), and 50 mM Tris⋅HCl, pH 7.4, at 25 °C, were diluted with a solution (980 μL) consisting of 2 mM cold guanosine, 50 mM Tris⋅HCl, pH 7.4, and 50 mM inorganic phosphate, pH 7.4. Samples (100 μL) were quenched with 50 μL of 1 M HCl at 15, 30, 45, and 60 s, and neutralized with 50 μL of 1 M NaOH. Samples were purified using charcoal columns (200-mg Carbograph Extract-Clean columns; Vertical Chromatography). The product [1-14C]ribose 1-phosphate was eluted into scintillation vials with 6 mL of 20 mM ribose in 10% ethanol. Solvent was removed by vacuum centrifugation, and samples were dissolved in 500 μL of water, mixed with 10 mL of scintillation liquid (PerkinElmer), and counted for radioactivity in a Tricarb 2910 TR scintillation counter (PerkinElmer). The values obtained in the absence of phosphate in the reaction were used as controls.
Forward Commitment Factors.
Forward commitment factors (Cf) were determined for guanosine phosphorolysis with light and heavy wild-type and F159Y PNPs by isotope-trapping methods. A reaction mixture (20 μL) containing 25 μM light or heavy PNPs, 80 μM [1-14C]guanosine, and 50 mM Tris⋅HCl, pH 7.4, at 25 °C, was chased with a solution (980 μL) consisting of 2 mM guanosine, 50 mM Tris⋅HCl, pH 7.4, and 50 mM inorganic phosphate, pH 7.4. Samples (100 μL) were quenched with 50 μL of 1 M HCl at 15, 30, 45, and 60 s and neutralized with 50 μL of 1 M NaOH. Purification of [1-14C]ribose 1-phosphate (the product) and radioactivity counting was done as described above. Forward commitment factors were calculated according to Eq. S1, where Y is the molar ratio of trapped ribose 1-phospate to enzyme–substrate complex. The enzyme–substrate complex concentration [ES] was calculated using Eq. S2, in which [E] and [S] are the concentrations of enzyme and guanosine at equilibrium in the initial mixture, and Kd is the dissociation constant of enzyme–substrate complex:
| [S1] |
| [S2] |
Cocrystallization with DADMe–ImmG Inhibitor.
Light F159Y PNP (5.0 mg/mL) and DADMe–Immucillin-G (DADMe–ImmG) (2 equivalents) were incubated in Eppendorf tubes for 2 h on ice. The crystallization of the incubated protein–ligand mixture was then screened by the sitting drop vapor diffusion crystallization method at 22 °C using the Microlytic (MCSG1-4) crystallization conditions. The drops were formed over 96-well Corning plates using the CRYSTAL-GRYPHON crystallization robot (ART ROBBINS). Each crystallization drop contained 0.5 μL of F159Y PNP–DADMe–ImmG mixture and 0.5 μL of well solution. The volume of the well solution was 70 µL. Good-quality crystals of the F159Y PNP–DADMe–ImmG complex were obtained in 0.1 M Hepes, pH 7.5, 0.2 M lithium sulfate, and 25% (wt/vol) PEG 3350 in 4 wk.
Data Collection and Data Processing.
The diffraction data of the DADMe–ImmG complex crystal were collected to 2.20-Å resolution at Lilly Research Laboratories Collaborative Access Team (LRL-CAT) beamline (Argonne National Laboratory, Argonne, IL) at 0.97931-Å wavelength. The data were processed using the MOSFLM and scaled with the AIMLESS program of the CCP4 suite (32) in the space group P212121. The data analysis with the SFCHECK (32) and XTRIAGE (33) programs suggested that the crystal was not twinned. The Matthews coefficient (Vm) calculations reveal that the unit cell of the P212121 crystal forms is compatible with six protein subunits (two trimers) in the asymmetric unit with 40.5% solvent content. The CC1/2 value for the data in the highest resolution shell is ∼70.7% (Table S2).
Structure Determination and Refinement.
The structure of F159Y PNP with DADMe–ImmG complex was solved by molecular replacement using PHASER (34). The monomer of wild-type PNP structure complex with DADMe–ImmG (3PHB) was used as the initial phasing model. The model obtained from PHASER was manually adjusted and completed using the graphics program COOT (35). Refinement was performed with the REFMAC5 program (36) using standard protocols for the NCS refinement. The DADMe–ImmG molecule was left out from the models in the beginning of the refinement. After completion of the water structure, DADMe–ImmG molecules were fitted in the respective active-site densities. The final refinement statistics of the structure are summarized in Table S2.
Structure Analysis.
The crystal structures of unliganded wild-type PNP (PDB ID code 1M73; chain: E) and PNP–DADMe–ImmG complex (PDB ID code 3PHB; chain: Q) have been used for structure comparisons. All of the structural superpositions were done using the SSM protocol of COOT. The geometries of the final model were examined using MolProbit (37). Further structure analyses, including the calculation of the B-factor profiles by BAVERAGE, were done using the CCP4 suite (32). The figures were made with the molecular graphics program PyMOL. For F159Y PNP–DADMe–ImmG complex structure, subunit B was used for the structural analyses and comparisons.
Acknowledgments
We acknowledge Drs. Scott Cameron and Hilda Namanja-Magliano for insightful discussions and suggestions. The use of the facilities and expertise of the Albert Einstein College of Medicine crystallization, data collection, and proteomics core facility is gratefully acknowledged. The intensity datasets used for the refined structures were collected at Lilly Research Laboratories Collaborative Access Team Advanced Photon Source beamline, which is gratefully acknowledged. All computer simulations were performed at the University of Arizona High-Performance Computing Center on an SGI Altix ICE 8400 supercomputer. This research was supported through NIH Program Project Grant GM068036 (to V.L.S. and S.D.S.).
Footnotes
The authors declare no conflict of interest.
This article contains supporting information online at www.pnas.org/lookup/suppl/doi:10.1073/pnas.1704786114/-/DCSupplemental.
References
- 1.Núñez S, Wing C, Antoniou D, Schramm VL, Schwartz SD. Insight into catalytically relevant correlated motions in human purine nucleoside phosphorylase. J Phys Chem A. 2006;110:463–472. doi: 10.1021/jp051277u. [DOI] [PubMed] [Google Scholar]
- 2.Silva RG, Murkin AS, Schramm VL. Femtosecond dynamics coupled to chemical barrier crossing in a Born-Oppenheimer enzyme. Proc Natl Acad Sci USA. 2011;108:18661–18665. doi: 10.1073/pnas.1114900108. [DOI] [PMC free article] [PubMed] [Google Scholar]
- 3.Suarez J, Schramm VL. Isotope-specific and amino acid-specific heavy atom substitutions alter barrier crossing in human purine nucleoside phosphorylase. Proc Natl Acad Sci USA. 2015;112:11247–11251. doi: 10.1073/pnas.1513956112. [DOI] [PMC free article] [PubMed] [Google Scholar]
- 4.Antoniou D, Ge X, Schramm VL, Schwartz SD. Mass modulation of protein dynamics associated with barrier crossing in purine nucleoside phosphorylase. J Phys Chem Lett. 2012;3:3538–3544. doi: 10.1021/jz301670s. [DOI] [PMC free article] [PubMed] [Google Scholar]
- 5.Zoi I, et al. Modulating enzyme catalysis through mutations designed to alter rapid protein dynamics. J Am Chem Soc. 2016;138:3403–3409. doi: 10.1021/jacs.5b12551. [DOI] [PMC free article] [PubMed] [Google Scholar]
- 6.Antoniou D, Schwartz SD. Proton transfer in benzoic acid crystals: Another look using quantum operator theory. J Chem Phys. 1998;109:5487–5493. [Google Scholar]
- 7.Bolhuis P, Dellago C. Practical and conceptual path sampling issues. Eur Phys J Spec Top. 2015;224:2409–2427. [Google Scholar]
- 8.Dellago C, Bolhuis P. Transition path sampling simulations of biological systems. Top Curr Chem. 2007;268:291–317. [Google Scholar]
- 9.Giblett ER, Ammann AJ, Wara DW, Sandman R, Diamond LK. Nucleoside-phosphorylase deficiency in a child with severely defective T-cell immunity and normal B-cell immunity. Lancet. 1975;1:1010–1013. doi: 10.1016/s0140-6736(75)91950-9. [DOI] [PubMed] [Google Scholar]
- 10.Nyhan WL. Disorders of purine and pyrimidine metabolism. Mol Genet Metab. 2005;86:25–33. doi: 10.1016/j.ymgme.2005.07.027. [DOI] [PubMed] [Google Scholar]
- 11.Dummer R, et al. Final results of a multicenter phase II study of the purine nucleoside phosphorylase (PNP) inhibitor forodesine in patients with advanced cutaneous T-cell lymphomas (CTCL) (mycosis fungoides and Sézary syndrome) Ann Oncol. 2014;25:1807–1812. doi: 10.1093/annonc/mdu231. [DOI] [PubMed] [Google Scholar]
- 12.Sattui SE, Gaffo AL. Treatment of hyperuricemia in gout: Current therapeutic options, latest developments and clinical implications. Ther Adv Musculoskelet Dis. 2016;8:145–159. doi: 10.1177/1759720X16646703. [DOI] [PMC free article] [PubMed] [Google Scholar]
- 13.Lewandowicz A, Schramm VL. Transition state analysis for human and Plasmodium falciparum purine nucleoside phosphorylases. Biochemistry. 2004;43:1458–1468. doi: 10.1021/bi0359123. [DOI] [PubMed] [Google Scholar]
- 14.Deng H, Lewandowicz A, Schramm VL, Callender R. Activating the phosphate nucleophile at the catalytic site of purine nucleoside phosphorylase: A vibrational spectroscopic study. J Am Chem Soc. 2004;126:9516–9517. doi: 10.1021/ja049296p. [DOI] [PubMed] [Google Scholar]
- 15.Ghanem M, et al. Tryptophan-free human PNP reveals catalytic site interactions. Biochemistry. 2008;47:3202–3215. doi: 10.1021/bi702491d. [DOI] [PubMed] [Google Scholar]
- 16.Núñez S, Antoniou D, Schramm VL, Schwartz SD. Promoting vibrations in human purine nucleoside phosphorylase. A molecular dynamics and hybrid quantum mechanical/molecular mechanical study. J Am Chem Soc. 2004;126:15720–15729. doi: 10.1021/ja0457563. [DOI] [PubMed] [Google Scholar]
- 17.Schwartz SD. Quantum activated rates—an evolution operator approach. J Chem Phys. 1996;105:6871–6879. [Google Scholar]
- 18.Kohen A. Role of dynamics in enzyme catalysis: Substantial versus semantic controversies. Acc Chem Res. 2015;48:466–473. doi: 10.1021/ar500322s. [DOI] [PMC free article] [PubMed] [Google Scholar]
- 19.Dametto M, Antoniou D, Schwartz SD. Barrier crossing in dihydrofolate reductasedoes not involve a rate-promoting vibration. Mol Phys. 2012;110:531–536. doi: 10.1080/00268976.2012.655337. [DOI] [PMC free article] [PubMed] [Google Scholar]
- 20.Wang Z, Antoniou D, Schwartz SD, Schramm VL. Hydride transfer in DHFR by transition path sampling, kinetic isotope effects, and heavy enzyme studies. Biochemistry. 2016;55:157–166. doi: 10.1021/acs.biochem.5b01241. [DOI] [PMC free article] [PubMed] [Google Scholar]
- 21.Ghanem M, Zhadin N, Callender R, Schramm VL. Loop-tryptophan human purine nucleoside phosphorylase reveals submillisecond protein dynamics. Biochemistry. 2009;48:3658–3668. doi: 10.1021/bi802339c. [DOI] [PMC free article] [PubMed] [Google Scholar]
- 22.Luo M, Li L, Schramm VL. Remote mutations alter transition-state structure of human purine nucleoside phosphorylase. Biochemistry. 2008;47:2565–2576. doi: 10.1021/bi702133x. [DOI] [PubMed] [Google Scholar]
- 23.Rose IA, O’Connell EL, Litwin S. Determination of the rate of hexokinase-glucose dissociation by the isotope-trapping method. J Biol Chem. 1974;249:5163–5168. [PubMed] [Google Scholar]
- 24.Rose IA. The isotope trapping method: Desorption rates of productive E.S complexes. Methods Enzymol. 1980;64:47–59. doi: 10.1016/s0076-6879(80)64004-x. [DOI] [PubMed] [Google Scholar]
- 25.Cleland WW. Partition analysis and the concept of net rate constants as tools in enzyme kinetics. Biochemistry. 1975;14:3220–3224. doi: 10.1021/bi00685a029. [DOI] [PubMed] [Google Scholar]
- 26.Ealick SE, et al. Three-dimensional structure of human erythrocytic purine nucleoside phosphorylase at 3.2 Å resolution. J Biol Chem. 1990;265:1812–1820. doi: 10.2210/pdb2pnp/pdb. [DOI] [PubMed] [Google Scholar]
- 27.Ho MC, et al. Four generations of transition-state analogues for human purine nucleoside phosphorylase. Proc Natl Acad Sci USA. 2010;107:4805–4812. doi: 10.1073/pnas.0913439107. [DOI] [PMC free article] [PubMed] [Google Scholar]
- 28.Brooks BR, et al. CHARMM: The biomolecular simulation program. J Comput Chem. 2009;30:1545–1614. doi: 10.1002/jcc.21287. [DOI] [PMC free article] [PubMed] [Google Scholar]
- 29.Parkin DW, Leung HB, Schramm VL. Synthesis of nucleotides with specific radiolabels in ribose. Primary 14C and secondary 3H kinetic isotope effects on acid-catalyzed glycosidic bond hydrolysis of AMP, dAMP, and inosine. J Biol Chem. 1984;259:9411–9417. [PubMed] [Google Scholar]
- 30.Silva RG, Hirschi JS, Ghanem M, Murkin AS, Schramm VL. Arsenate and phosphate as nucleophiles at the transition states of human purine nucleoside phosphorylase. Biochemistry. 2011;50:2701–2709. doi: 10.1021/bi200279s. [DOI] [PMC free article] [PubMed] [Google Scholar]
- 31.Schramm VL. Enzymatic transition-state analysis and transition-state analogs. Methods Enzymol. 1999;308:301–355. doi: 10.1016/s0076-6879(99)08015-5. [DOI] [PubMed] [Google Scholar]
- 32.Winn MD, et al. Overview of the CCP4 suite and current developments. Acta Crystallogr D Biol Crystallogr. 2011;67:235–242. doi: 10.1107/S0907444910045749. [DOI] [PMC free article] [PubMed] [Google Scholar]
- 33.Adams PD, et al. PHENIX: A comprehensive Python-based system for macromolecular structure solution. Acta Crystallogr D Biol Crystallogr. 2010;66:213–221. doi: 10.1107/S0907444909052925. [DOI] [PMC free article] [PubMed] [Google Scholar]
- 34.McCoy AJ, et al. Phaser crystallographic software. J Appl Cryst. 2007;40:658–674. doi: 10.1107/S0021889807021206. [DOI] [PMC free article] [PubMed] [Google Scholar]
- 35.Emsley P, Cowtan K. Coot: Model-building tools for molecular graphics. Acta Crystallogr D Biol Crystallogr. 2004;60:2126–2132. doi: 10.1107/S0907444904019158. [DOI] [PubMed] [Google Scholar]
- 36.Murshudov GN, Vagin AA, Dodson EJ. Refinement of macromolecular structures by the maximum-likelihood method. Acta Crystallogr D Biol Crystallogr. 1997;53:240–255. doi: 10.1107/S0907444996012255. [DOI] [PubMed] [Google Scholar]
- 37.Chen VB, et al. MolProbity: All-atom structure validation for macromolecular crystallography. Acta Crystallogr D Biol Crystallogr. 2010;66:12–21. doi: 10.1107/S0907444909042073. [DOI] [PMC free article] [PubMed] [Google Scholar]


