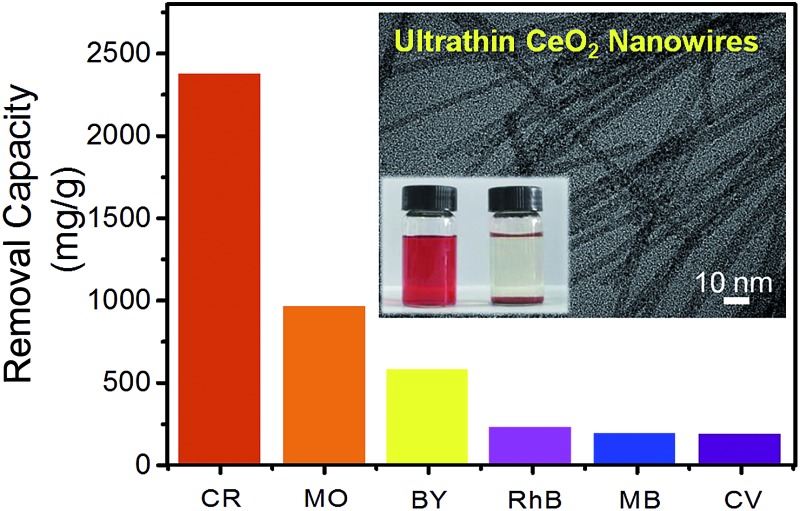
 Ultrathin CeO2 nanowires can be prepared by a one-step refluxing approach in a mixed solvent without any templates or surfactants, and exhibit excellent adsorption capabilities in water treatment.
Abstract
Ultrathin CeO2 nanowires with a diameter of 5 nm and an aspect ratio of more than 100 can be prepared by a one-step refluxing approach in a mixed solvent composed of water and ethanol without using any templates or surfactants. The formation mechanism of the as-synthesized ultrathin nanowires has been investigated. The as-synthesized CeO2 nanowires with a high surface area of 125.31 m2 g–1 exhibited excellent wastewater treatment performance with high removal capacities towards organic dyes and heavy metal ions. In addition, the as-synthesized CeO2 nanowires can adsorb Congo red selectively from a mixed solution composed of several dyes. Successful access to high quality ultrathin nanowires will make it possible for their potential application in catalysis and other fields.
Introduction
Nanocrystals of rare-earth compounds have become a new focus of research, due to their unique properties arising from the 4f electron configuration and their potential applications in ultraviolet absorbants, solid-state lasers, optical amplifiers, lighting and displays, and biolabels.1–3 Among them, CeO2, as a typical multifunctional rare earth oxide, has attracted a great deal of interest due to its novel chemical and physical properties, including high mechanical strength, oxygen ion conductivity, and oxygen storage capacity.4–7 On the basis of previous studies, various morphologies of dispersible CeO2 nanocrystals of rare-earth compounds, have been synthesized, such as nanoparticles, nanorods, nanowires, polyhedra, nanoplates, and nanocubes.8–13 One-dimensional (1D) nanostructured CeO2, such as nanorods, nanowires, and nanotubes, has become a new focus of research, due to its unique properties and potential applications. Various methods including sol–gel,14,15 precipitation,16 hydrothermal,17–22 and thermal decomposition23 have been reported for preparing 1D CeO2 nanostructures. To obtain 1D nanostructures, the crystal growth pathway can be controlled thermodynamically and kinetically with different mediators, e.g., solvent, surfactant, mineralizer, concentration, temperature, etc. For example, a variety of chemical reagents and/or shape-control agents including organic compounds, inorganic mineralizers, surfactants, or templates, can be used to create CeO2 colloids with 1D nanostructures.
1D nanowires can be fabricated mainly by hard or soft template-based approaches,24,25 which provide better control over the uniformity, morphology, and dimension, compared to other techniques, such as nanolithography.26,27 However, major drawbacks of these methods are the extremely low yield and high cost due to the use of templates, which prevents them from being used in practical applications. Meantime, 1D nanowires are usually synthesized by the use of surfactants as a structure-directing agent. However, the introduction of such chemical additives increases the cost of the as-synthesized nanomaterials and decreases the catalytic activity of the catalyst which requires clean surfaces with maximum reactive sites.
Herein, we report a facile solution route for the synthesis of ultrathin CeO2 nanowires by a one-step refluxing approach in a mixed solvent composed of water and ethanol without using any templates or surfactants. The as-synthesized CeO2 nanowires have a high surface area and exhibit a promising performance in wastewater treatment. Moreover, the ultrathin CeO2 nanowires showed obvious adsorption selectivity in wastewater, such that Congo red could be selectively removed from a mixed solution of several dyes. The removal capacity of Congo red can reach up to 2382.75 mg g–1 with a short adsorption duration of only 30 min.
Results and discussion
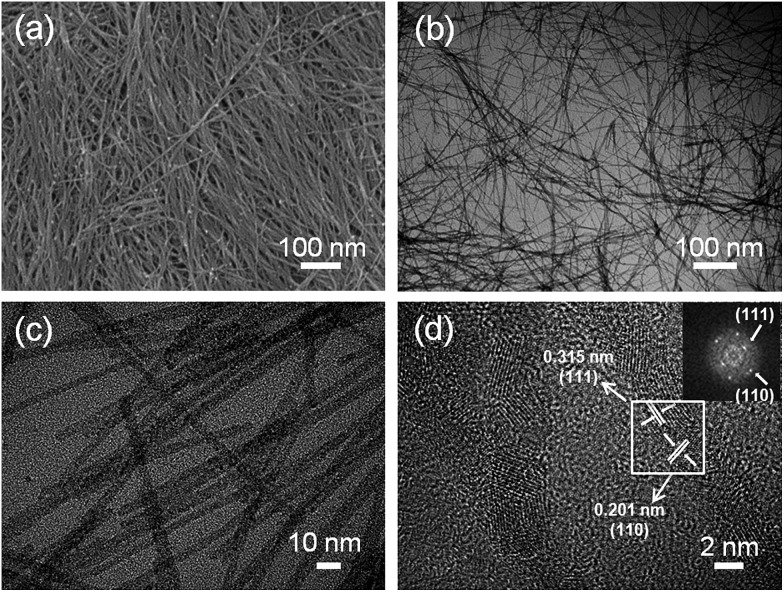
Ultrathin CeO2 nanowires were synthesized in a mixed solvent with a volume ratio of water/ethanol solution of 1 : 1. Fig. 1a to c show the morphology of the as-synthesized CeO2 nanowires, indicating that the nanowires were very uniform with a diameter of about 5 nm and an aspect ratio of more than 100. The X-ray diffraction (XRD) pattern of the as-synthesized nanowires as shown in Fig. S1a† indicates that the product is CeO2 (JCPDS card no. 34-0394). Meanwhile, Ce M4, 5-edge EELS spectra of the CeO2 nanowires corresponded to valence states of Ce4+ (inset in Fig. S1a†). Fourier transform infrared (FTIR) analysis also could illustrate the composition of the as-synthesized CeO2 nanowires (ESI, Fig. S1b†). The bands at 3424 and 488 cm–1 correspond to the ν-OH stretching of the OH groups and the Ce–OH bending vibration in the ultrathin nanowires respectively. Additionally, the products were further confirmed by the HRTEM image in Fig. 1d which shows clear lattice fringes with d-spacing values of 0.315 nm and 0.201 nm, corresponding to the theoretical d-111 (0.310 nm) and d-110 (0.191 nm) respectively. Similarly, the live fast-Fourier transform (FFT) image (inset in Fig. 1d) also supports the well crystalline nature, showing a matched d-111 (0.312 nm) and d-110 (0.204 nm).
Fig. 1. (a) SEM image; (b) and (c) TEM images; (d) high resolution TEM image and the corresponding FFT pattern of the as-synthesized nanowires (inset). The sample was prepared from the reaction mixture by refluxing at 140 °C for 12 h under stirring, which was taken from 2 mmol (0.6345 g) cerium acetate, 80 ml water/ethanol solution with a volume ratio of 1 : 1 and 20 ml of 30% NH3·H2O.
The formation process of the as-synthesized ultrathin nanowires with time evolution was investigated (see ESI Fig. S2†). A schematic diagram of the formation of ultrathin CeO2 nanowires showing that they were introduced by an attached growth and Ostwald ripening mechanism is given in Fig. S2a.† Firstly, the nanoparticles formed in the solution, and then these nanoparticles grew into nanorods by an oriented attachment mechanism. The evolution from nanorods to nanowires could be explained by a typical Ostwald ripening process.10 The formation process of CeO2 can be formulated as follows:
| Ce3+ + 3OH– → Ce(OH)3 | 1 |
| 4Ce(OH)3 + O2 + 2H2O → 4CeO2·2H2O | 2 |
Briefly, trivalent cerium hydroxide is extremely sensitive to oxygen, that is, Ce(OH)3 could change into CeO2 simultaneously during the synthesis and washing processes which has been reported previously.28 The presence of ethanol could make Ce3+ more easily oxidized with a minor amount of O2.29
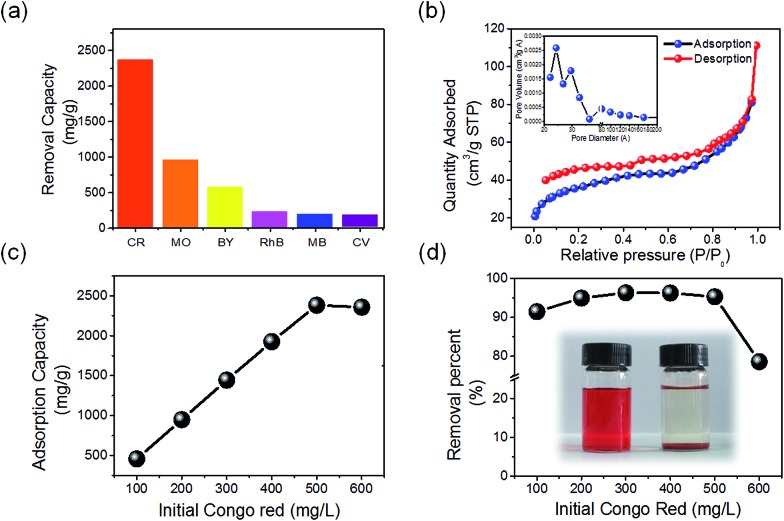
Nitrogen adsorption–desorption measurements were conducted to investigate the surface structure of the as-synthesized CeO2 nanowires (Fig. 2b), which reveals that the nanowires have a surface area of 125.31 m2 g–1 and a total pore volume of 0.14 cm3 g–1. The nanowires have a narrow pore size distribution centered at 2.42 nm, calculated from the desorption branch by using the Barrett–Joyner–Halenda (BJH) method.
Fig. 2. (a) The adsorption capacities of different dyes by the as-synthesized CeO2 nanowires; (b) nitrogen adsorption–desorption isotherms for the as-synthesized nanowires. The nanowires have a BET surface area of 125.31 m2 g–1. The corresponding pore size distribution curve obtained by using the BJH (Barret–Joyner–Halenda) method shows a narrow pore size at 2.42 nm; (c) and (d) adsorption isotherm and percentage removal of Congo red by the as-synthesized CeO2 nanowires, the initial concentration of Congo red is 100–600 mg L–1 and the adsorption time is 30 min.
As-synthesized nanowires with a high specific surface area and excellent adsorption property were used for wastewater treatment to adsorb a large quantity of pollutants, such as organic dyes and heavy metal ions.30,31 Such pollutants can be removed by carbon-based adsorbents (carbonaceous nanofibers, carbon nanotubes, carbon aerogel, etc.).32 However, these adsorbents are usually suspended in the aqueous solution and are difficult to separate, leading to secondary pollution.
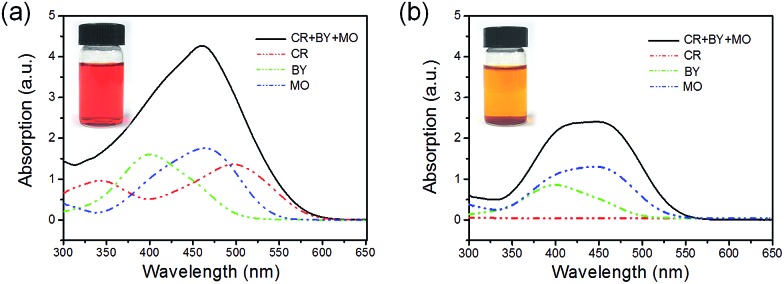
We chose six types of organic dyes (Congo red (CR), Methyl orange (MO), Brilliant yellow (BY), Rhodamine B (RhB), Methylene blue (MB), Crystal violet (CV)) as study models in the adsorption experiments. The adsorption capacities of different dyes are shown in Fig. 2a, which reveals that the as-synthesized nanowires have higher adsorption capacities for CR, MO, and BY than for RhB, CV, and MB. The as-synthesized CeO2 nanowires have the highest adsorption capacity for CR (2382.0 mg g–1). Fig. 3a exhibits the UV-vis spectrum of an initial mixed solution of CR, BY and MO, with each kind of dye at a concentration of 50 mg L–1. The spectrum of the mixed solution could be equivalent to the overlap of the spectra of the three kinds of organic dyes. The inset of Fig. 3a shows that the color of the initial mixed solution was bright red. Fig. 3b shows the spectrum of the eventual mixed solution with an orange colour (inset), which was treated with the as-synthesized nanowires. The spectra indicate that the CR dye was removed completely, while the other two were partly adsorbed. It indicates that when the initial concentration of CR was 500 mg L–1, the as-synthesized CeO2 nanowires showed the highest adsorption capacity and the removal percentage of Congo red exceeded 95%. We compared the adsorption capacities for Congo red of the CeO2 nanowires and several other previously reported metal oxides (see ESI Table S1†). The great diversity of the adsorption capacities could be due to the electrostatic interaction and hydrophobic effect.33,34 The as-synthesized ultrathin CeO2 nanowires exhibit good hydrophobicity, with a positive Zeta potential of 37.14 mV. In the solution, CR, MO, and BY were in the form of anions, whereas RhB, MB and CV formed cations. Due to the difference in hydrophobicity, the as-synthesized CeO2 nanowires could adsorb CR selectively from the mixed solution of the three dye molecules composed of CR, MO and BY (Fig. 3).
Fig. 3. UV-vis spectra and photographs (insets) for the mixed solutions of before (a) and after (b) adsorption experiments (full line for mixed solution, red dashed line for Congo red, green dashed line for Brilliant yellow, and blue dashed line for Methyl orange).
At the same time, we evaluated the adsorption capabilities of the as-synthesized CeO2 nanowires for heavy metal ions at room temperature. We studied four types of heavy metal ions (Pb(ii), Cu(ii), Cr(vi) and Cd(ii)), which are considered as highly toxic primary pollutants in industrial wastewater. The adsorption behavior of the four types of heavy metal ions was further described using Langmuir isotherms,35 as expressed by the Langmuir function (eqn (3)):
| Qe = QmbCe/(1 + bCe) | 3 |
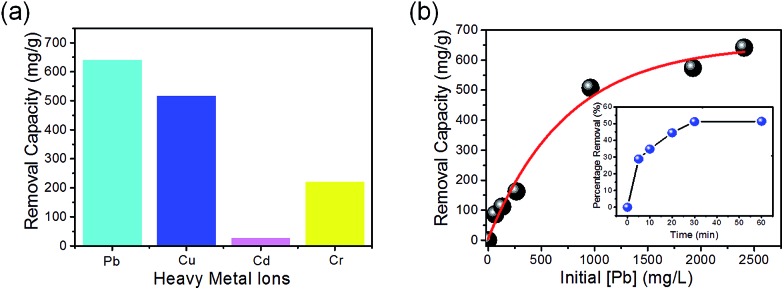
where Q e (mg g–1) refers to the amount of adsorbate adsorbed per unit mass of adsorbent, Q m (mg g–1) represents the maximum adsorption capacity, C e (mg L–1) is the equilibrium solute concentration, and b (L mg–1) is the equilibrium constant. Fig. 4a shows the adsorption capacities for different heavy metal ions of the as-synthesized CeO2 nanowires. The maximum adsorption capacity was 641.7 mg g–1 for Pb(ii), 518.0 mg g–1 for Cu(ii), 28.5 mg g–1 for Cr(vi), and 222.0 mg g–1 for Cd(ii). The adsorption capacities for Pb(ii) at varied equilibrium concentrations and the adsorption isotherm of Pb(ii) of the as-synthesized CeO2 nanowires are shown in Fig. 4b.
Fig. 4. (a) Adsorption capacities for different heavy metal ions of the as-synthesized CeO2 nanowires; (b) the adsorption capacities for Pb(ii) at varied equilibrium concentrations and the adsorption isotherm of Pb(ii) by as-synthesized CeO2 nanowires (inset).
The capacities of the CeO2 nanowires compared to several other materials can be seen in Table S2† (ESI). The adsorption of heavy metal ions was likely based on the electrostatic interactions between the charged oxides and ions, as well as ion exchange in the aqueous solution. The structural features of the as-synthesized CeO2 nanowires, including a high BET surface area and large pore volume, should be the important factors considered to enhance adsorption performance. Lastly, it is essential to point out that most adsorption results reported in the literature were obtained with a long adsorption duration of over several hours (compared to only 30 min in the present study). Thus, we believe that the as-synthesized CeO2 nanowires with a high adsorption capacity and shorter adsorption duration time are a promising material for wastewater treatment in practical applications.
Conclusions
In summary, we have developed a simple template- and surfactant-free method for the synthesis of ultrathin CeO2 nanowires by a one-step refluxing approach in a mixed solution of ethanol and water. The formation mechanism of the as-synthesized ultrathin nanowires has been investigated. The as-synthesized CeO2 nanowires with a high surface area of 125.31 m2 g–1 exhibited excellent wastewater treatment performance with high removal capacities towards organic dyes and heavy metal ions. Notably, the as-synthesized CeO2 nanowires can adsorb Congo red selectively from a mixed solution composed of several dyes. Furthermore, successful access to high quality ultrathin CeO2 nanowires will make it possible for their potential application in catalysis and other fields.
Experimental section
Synthesis of ultralong and ultrathin CeO2 nanowires
All the chemicals were of analytical grade and used without further purification. Firstly, 2 mmol (0.6345 g) cerium acetate was dissolved in a flask with 80 ml of a water/ethanol mixed solution with a 1 : 1 volume ratio. Then, the flask was placed in an oil bath and 20 ml of 30% NH3·H2O was added when the temperature increased to 140 °C. The reaction mixture was refluxed at 140 °C for 12 h under stirring. After the solution was cooled to room temperature, the resulting products were centrifuged and washed with ethanol and water several times. The pre-synthesized nanowires were frozen in liquid nitrogen (–196 °C) and then freeze-dried in a bulk tray dryer (Labconco Corporation, Kansas City, MO, USA) at a sublimating temperature of –48 °C and a pressure of 0.04 mbar.
Characterization
The X-ray diffraction (XRD) analysis was performed using a Philips X'Pert PRO SUPER X-ray diffractometer equipped with graphite monochromaticized Cu Kα radiation (λ = 1.54056 Å). The operation voltage and current were kept at 40 kV and 400 mA. Thermogravimetric analysis (TGA) was carried out using a TGA-60 thermal analyzer (Shimadzu Corporation) with a heating rate of 10 °C min–1 in flowing nitrogen. Scanning electron microscopy (SEM) images were taken with a Zeiss Supra 40 scanning electron microscope at an acceleration voltage of 5 kV. Transmission electron microscopy (TEM) images, HRTEM and EELS spectra were taken and recorded using Hitachi H-7650 and JEOLF2010 with an acceleration voltage of 200 KV respectively. The BET measurement was determined by using Micromeritics ASAP-2000 nitrogen adsorption apparatus. FTIR spectra were measured using a Bruker Vector-22 FTIR spectrometer from 4000–400 cm–1 at room temperature. The Zeta potential was performed using a Malvern Zetasizer instrument (Malvern, UK). UV-vis spectra were recorded using a Shimadzu UV-250 spectrophotometer scanning from 200 to 800 nm at room temperature. ICP-AES measurements were conducted using an Atomscan Advantage Spectrometer, Thermo Ash Jarrell Corporation, USA.
Removal of dyes
The desired amounts of the ultrathin CeO2 nanowires in the suspension were mixed with the aqueous solutions of dyes. After stirring for 30 min, the nanowires were separated and the supernatant solutions were analyzed using UV-vis spectroscopy to determine the residual amount of dye in the solution. The concentrations of the dyes were obtained by measuring the intensities of the absorbance bands, using a linear curve over 5–100 mg L–1. To estimate the adsorption capacity, the initial concentration of the dyes was varied in the range of 100–600 mg L–1, and the dosage of the CeO2 nanowires was kept at 1.0 g L–1.
Selective adsorption of Congo red
The initial mixed solution composed of three dyes (CR, BY, and MO) was mixed with desired amounts of the as-synthesized CeO2 nanowire suspension. After stirring for 30 min, the nanowires were separated and the supernatant solutions were analyzed using UV-vis spectroscopy to determine the concentration of residual dyes in the solution. The dosage of the CeO2 nanowires was kept at 0.25 g L–1 and the initial mixed solution composed of CR, BY and MO (at a concentration of 50 mg L–1).
Removal of heavy metal ions
The solutions containing various concentrations of heavy metal ions were mixed with the desired amounts of the as-synthesized CeO2 nanowires. After stirring for 30 min, the suspensions were centrifuged and the supernatant solutions were analyzed using ICP-AES to determine the concentration of the heavy metal ions. To estimate the adsorption capacity, the initial concentration of the heavy metal ions was varied in the range of 50–2500 mg L–1, and the dosage of the as-synthesized CeO2 nanowires was kept at 1.0 g L–1.
Acknowledgments
We acknowledge the National Basic Research Program of China (Grants 2014CB931800 and 2013CB933900), the National Natural Science Foundation of China (Grants 21401183, 21431006, 91227103, 21061160492 and J1030412), and the Chinese Academy of Sciences (Grant KJZD-EW-M01-1). This work was also funded by the Deanship of Scientific Research (DSR), King Abdulaziz University, under grant no. (89-130-35-HiCi). The authors, therefore, acknowledge technical and financial support of KAU.
Footnotes
References
- Mai H. X., Zhang Y. W., Si R., Yan Z. G., Sun L. D., You L. P., Yan C. H. J. Am. Chem. Soc. 2006;128:6424–6436. doi: 10.1021/ja060212h. [DOI] [PubMed] [Google Scholar]
- Sun L. D., Wang Y. F., Yan C. H. Acc. Chem. Res. 2014;47:1001–1009. doi: 10.1021/ar400218t. [DOI] [PubMed] [Google Scholar]
- Si R., Zhang Y. W., You L. P., Yan C. H. Angew. Chem., Int. Ed. 2005;44:3256–3260. doi: 10.1002/anie.200462573. [DOI] [PubMed] [Google Scholar]
- Yada M., Torikai T., Watari T., Furuta S., Katsuki H. Adv. Mater. 2004;16:1222–1226. [Google Scholar]
- Yu T., Joo J., Park Y. I., Hyeon T. Angew. Chem., Int. Ed. 2005;44:7411–7414. doi: 10.1002/anie.200500992. [DOI] [PubMed] [Google Scholar]
- Yang S. W., Gao L. J. Am. Chem. Soc. 2006;128:9330–9331. doi: 10.1021/ja063359h. [DOI] [PubMed] [Google Scholar]
- Zhang J., Ohara S., Umetsu M., Naka T., Hatakeyama Y., Adschiri T. Adv. Mater. 2007;19:203–206. [Google Scholar]
- Wang D., Kang Y., Doan-Nguyen V., Chen J., Kungas R., Wieder N. L., Bakhmutsky K., Gorte R. J., Murray C. B. Angew. Chem., Int. Ed. 2011;50:4378–4381. doi: 10.1002/anie.201101043. [DOI] [PubMed] [Google Scholar]
- Wang X., Jiang Z. Y., Zheng B. J., Xie Z. X., Zheng L. S. CrystEngComm. 2012;14:7579–7582. [Google Scholar]
- Ji Z. X., Zhang H. Y., Lin S. J., Meng H., Sun B. B., George S., Xia T., Nel A., Zink J. I. ACS Nano. 2012;6:5366–5380. doi: 10.1021/nn3012114. [DOI] [PMC free article] [PubMed] [Google Scholar]
- Zhu H. Z., Lu Y. M., Fan F. J., Yu S. H. Nanoscale. 2013;5:7219–7223. doi: 10.1039/c3nr02662k. [DOI] [PubMed] [Google Scholar]
- Tian B. Z., Yang H. F., Xie S. H., Yu C. Z., Tu B., Zhao D. Y. Adv. Mater. 2003;15:1370–1374. [Google Scholar]
- Kuiry S. C., Patil S. D., Deshpande S., Seal S. J. Phys. Chem. B. 2005;109:6936–6939. doi: 10.1021/jp050675u. [DOI] [PubMed] [Google Scholar]
- Laberty-Robert C., Long J. W., Lucas E. M., Pettigrew K. A., Stroud R. M., Doescher M. S., Rolison D. R. Chem. Mater. 2006;18:50–55. [Google Scholar]
- Wu G. S., Xie T., Yuan X. Y., Cheng B. C., Zhang L. D. Mater. Res. Bull. 2004;39:1023–1028. [Google Scholar]
- Pan C., Zhang D., Shi L., Fang J. Eur. J. Inorg. Chem. 2008;2008:2429–2436. [Google Scholar]
- Xing X. R., Yan L., Yu R. B., Chen J. Cryst. Growth Des. 2008;6:1474–1477. [Google Scholar]
- Yu L. Y. R., Zheng P., Chen J., Xing X. J. Phys. Chem. C. 2008;112:19896–19900. [Google Scholar]
- Wu Q., Zhang F., Xiao P., Tao H. S., Wang X. Z., Hu Z., Lu Y. N. J. Phys. Chem. C. 2008;112:17076–17080. [Google Scholar]
- Pan C. S., Zhang D. S., Shi L. Y. J. Solid State Chem. 2008;181:1298–1306. [Google Scholar]
- Yuan Z. Y., Vantomme A., Du G. H., Su B. L. Langmuir. 2005;21:1132–1135. doi: 10.1021/la047751p. [DOI] [PubMed] [Google Scholar]
- Mai H. X., Sun L. D., Zhang Y. W., Si R., Feng W., Zhang H. P., Liu H. C., Yan C. H. J. Phys. Chem. B. 2005;109:24380–24385. doi: 10.1021/jp055584b. [DOI] [PubMed] [Google Scholar]
- Lin H. L., Wu C. Y., Chiang R. K. J. Colloid Interface Sci. 2010;341:12–17. doi: 10.1016/j.jcis.2009.04.047. [DOI] [PubMed] [Google Scholar]
- Hurst S. J., Payne E. K., Qin L., Mirkin C. A. Angew. Chem., Int. Ed. 2006;45:2672–2692. doi: 10.1002/anie.200504025. [DOI] [PubMed] [Google Scholar]
- Liang H. W., Liu J. W., Qian H. S., Yu S. H. Acc. Chem. Res. 2013;46:1450–1461. doi: 10.1021/ar300272m. [DOI] [PubMed] [Google Scholar]
- Hong S. H., Zhu J., Mirkin C. A. Science. 1999;286:523–525. doi: 10.1126/science.286.5439.523. [DOI] [PubMed] [Google Scholar]
- Dagata J. A. Science. 1995;270:1625–1626. [Google Scholar]
- Abi-aad E., Bechara R., Grimblot J., Aboukais A. Chem. Mater. 1993;5:793–797. [Google Scholar]
- Chen S., Yu S. H., Yu B., Ren L., Yao W., Colfen H. Chem.–Eur. J. 2004;10:3050–3058. doi: 10.1002/chem.200306066. [DOI] [PubMed] [Google Scholar]
- Hu J. S., Zhong L. S., Wan W. G., Li J. Adv. Mater. 2008;20:2977–2982. [Google Scholar]
- Choi W. S., Koo H. Y., Zhuang Z. B., Li Y. D., Kim D. Y. Adv. Funct. Mater. 2007;17:1743–1749. [Google Scholar]
- Liang H. W., Cao X., Zhang W. J., Lin H. T., Zhou F., Chen L. F., Yu S. H. Adv. Funct. Mater. 2011;21:3851–3858. [Google Scholar]
- Pan B., Xing B. S. Environ. Sci. Technol. 2008;42:9005–9013. doi: 10.1021/es801777n. [DOI] [PubMed] [Google Scholar]
- Yang K., Wu W. H., Jing Q. F., Zhu L. Z. Environ. Sci. Technol. 2008;42:7931–7936. doi: 10.1021/es801463v. [DOI] [PubMed] [Google Scholar]
- Langmuir I. J. Am. Chem. Soc. 1918;40:1361–1403. [Google Scholar]
Associated Data
This section collects any data citations, data availability statements, or supplementary materials included in this article.


