

Abstract
The T-cell lymphoma invasion and metastasis gene 1 (Tiam1) is a guanine exchange factor (GEF) for the Rho-family GTPase Rac1 that is crucial for the integrity of adherens junctions, tight junctions, and cell-matrix interactions. This GEF contains several protein-protein interaction domains, including a PDZ domain. Earlier studies identified a consensus PDZ-binding motif and a synthetic peptide capable of binding to the Tiam1 PDZ domain, but little is known about its ligand specificity and physiological role in cells. Here, we investigated the structure, specificity, and function of the Tiam1 PDZ domain. We determined the crystal structures of the Tiam1 PDZ domain free and in complex with a “model” peptide, which revealed the structural basis for ligand specificity. Protein database searches using the consensus PDZ-binding motif identified two eukaryotic cell adhesion proteins, Syndecan1 and Caspr4, as potential Tiam1 PDZ domain binding proteins. Equilibrium binding experiments confirmed that C-terminal peptides derived from Syndecan1 and Caspr4 bound the Tiam1 PDZ domain. NMR chemical shift perturbation experiments indicated that the Tiam1 PDZ/Syndecan1 and PDZ/Caspr4 complexes were structurally distinct and identified key residues likely to be responsible for ligand selectivity. Moreover, cell biological analysis established that Syndecan1 is a physiological binding partner of Tiam1 and that the PDZ domain has a function in cell-matrix adhesion and cell migration. Collectively, our data provide insight into the structure, specificity, and function of the Tiam1 PDZ domain. Importantly, our data report on a physiological role for the Tiam1 PDZ domain and establish a novel link between two previously unrelated signal transduction pathways, both of which are implicated in cancer.
Keywords: Syndecan1, Tiam1, Rac1 GTPase, PDZ domain, protein-protein interaction
Introduction
Rho-family guanine triphosphatases (GTPases) control signal transduction pathways that regulate important biological responses, including cell polarity, migration, and division.1 These proteins are molecular switches that cycle between an active GTP-bound state and an inactive GDP-bound state. Guanine exchange factors (GEFs) are GTPase regulators that induce activation of the GTPase by facilitating the release of the GDP substrate. In addition, GEFs act as a junction between upstream signals and GTPase activity, and consequently are tightly regulated.
The T-cell lymphoma invasion and metastasis 1 (Tiam1) is a GEF protein that specifically activates the Rho-family GTPase Rac1. Tiam1 is a multidomain protein important for the integrity of adherens junctions,2 tight junctions,3–5 and cell–matrix interactions.6 Several studies implicate Tiam1 deregulation with invasive and metastatic forms of lung7 and colorectal8 cancer. In Madin-Darby canine kidney (MDCK) cells, Tiam1 colocalizes with E-cadherin-based adherens junctions and is critical for their formation and maintenance.2,9 Tiam1 knockdown in epithelial cells results in the loss of both adherens junctions and of apicalbasolateral polarity and confers a migratory phenotype. 2 In contrast, Tiam1 over-expression reverts the fibroblast-like phenotype of Ras-transformed MDCK cells to an epithelial-like phenotype.10 From these studies, it is clear that Tiam1 is a critical modulator of cell-cell and cell-matrix functions, yet precisely how this regulation occurs is unknown.
Tiam1 contains one PDZ domain, whose binding partner(s) and function remain poorly characterized. PDZ domains are protein-protein interaction domains approximately 90 amino acids in length that typically bind the four or five most C-terminal residues of their interaction partner. 11 Often, PDZ domains are found in signaling proteins that are functionally associated with the actin cytoskeleton where they are critical for organizing higher-order complexes important for cell-matrix interactions, cell-cell adhesion and cell polarity.12–15 We hypothesize that the Tiam1 PDZ domain provides a physical link to proteins or protein complexes required for the regulation of cellular adhesion. Indeed, a recent report indicates that Tiam1 PDZ binds the adhesion receptor CADM1 via a PDZ domain interaction.16 To date, several large-scale studies using either peptide screens17,18 or protein microarrays19,20 have begun to establish C-terminal peptide motifs for a large number of PDZ domains. In particular, Sonyang et al. (1997) and Tonikan et al. (2008) identified the Tiam1 PDZ domain as a Class II-type PDZ domain capable of binding synthetic peptides with a -X-Φ-X-Φ motif, where Φ represents a hydrophobic amino acid. However, the structural basis for Tiam1 PDZ domain specificity is not known.
In this work, we investigated the structure, specificity, and function of the Tiam1 PDZ domain. We determined the structure of the PDZ domain by X-ray crystallography, both free and bound to a model peptide ligand. Database searches using the Tiam1 PDZ domain consensus peptide-binding motif yielded several potential Tiam1 PDZ-binding proteins. Peptides corresponding to Syndecan1 and Caspr4, two receptor adhesion proteins, were found to bind the Tiam1 PDZ in vitro. Solution NMR analysis of the Tiam1 PDZ/Syndecan1 and PDZ/ Caspr4 complexes indicated that they have distinct modes of binding and identified key residues likely to be responsible for ligand selectivity. Finally, cell biological analysis established that Syndecan1 is a physiological binding partner of Tiam1 that promotes cell-matrix adhesion and cell migration.
Results
The Tiam1 PDZ domain structure and interaction with a model peptide ligand
Studies by Songyang et al. (1997) and Tonikan et al. (2008) identified the Tiam1 PDZ domain as a Class II-type PDZ domain. In addition, a “model” peptide ligand (SSRKEYYACOOH, referred to as the Model peptide) was shown to bind the PDZ domain with low affinity.17 To understand the structural features that give rise to ligand specificity, we used X-ray crystallography to determine the structure of the Tiam1 PDZ domain, both free and bound to the Model peptide. The free PDZ domain structure had a resolution of 1.30 A with an R-value of 19.6% (Rfree 22.4%), while the PDZ/Model structure had a resolution of 1.80 A with an R-value of 19.5% (Rfree 21.2%). Crystallographic data and refinement statistics are given in Table 1. The free PDZ domain crystallized with one PDZ molecule in the asymmetric unit, while the PDZ/Model complex crystallized with three PDZ molecules in the asymmetric unit. Two of these molecules (chains B and C) had clear electron density for the peptide, but no electron density for the peptide was found in the third molecule (chain A). The results presented below describe the structures of the ligand-free PDZ domain (PDB code 3KZD) and chain B of the PDZ/ Model complex (PDB code 3KZE).
Table 1.
Crystallographic data collection and refinement statistics
| PDZ domain | PDZ domain/Model peptide | |
|---|---|---|
| A. Data collection | ||
| Temperature (K) | 100 | 100 |
| Wavelength (A) | 1.033 | 1.033 |
| Space group | P3221 (154) | P21 (4) |
| Unit cell parameters | ||
| a, (Å) | 44.78 | 37.78 |
| b (Å) | 44.78 | 54.53 |
| c (Å) | 70.80 | 65.12 |
| α(°) | 90.0 | 90.0 |
| β (°) | 90.0 | 96.3 |
| γ (°) | 120.0 | 90.0 |
| Resolution (Å) | 34.01–1.30 (1.35–1.30) | 41.70–1.60 (1.66–1.60) |
| I/σ (I) | 18.5 (5.4) | 13.0 (1.5) |
| Completeness (%) | 98.5 (96.5) | 96.2 (96.1) |
| Rmerge (%)a | 5.0 (33.6) | 4.5 (50.7) |
| Redundancy | 10.25 (10.0) | 2.6 (2.35) |
| B. Refinement | ||
| Resolution (Å) | 34.01–1.30 | 32.37–1.80 |
| Rwork (%)b | 19.6 | 19.5 |
| Rfree (%) | 22.4 | 21.2 |
| Number of atoms | ||
| Protein (+ peptide) | 680 | 2089 (2212) |
| Water | 75 | 101 |
| B-factor average | ||
| Protein (main chain) (Å2) | 16.27 (14.13) | 35.71 (33.67) |
| Peptide (Å2) | N/A | 50.48 (48.49) |
| Water (Å2) | 22.47 | 36.40 |
| RMSD from ideal geometry | ||
| Bond lengths (Å) | 0.005 | 0.006 |
| Bond angles (°) | 0.995 | 0.907 |
| Dihedral angles (°) | 14.59 | 13.55 |
| Planarity (°) | 0.004 | 0.003 |
| Chirality (°) | 0.065 | 0.057 |
| Ramachandran plot | ||
| Most favored (%) | 98.9 | 99.6 |
| Additionally allowed (%) | 1.1 | 0.4 |
| Disallowed (%) | 0 | 0 |
Values in parentheses are for the highest resolution shell. One crystal was used for each data collection.
Rmerge=Σ|Ii – 〈I〉|/ΣIi, where Ii is the intensity of the ith observation and 〈I〉 is the mean intensity of the reflections.
R=Σ|Fobs – Fcalc|/Σ|Fobs|, crystallographic R-factor, where all reflections belong to a test set of randomly selected data.
The structure of the Tiam1 PDZ domain displays a classic β-barrel fold composed of six β-strands and two α-helices (Fig. 1a). The global backbone RMSD between the free and bound structures is 0.428 A; however, large deviations (RMSD ~3 Å) are evident along p2 and p3 (see Supplementary Data Tables S1 and S2). The peptide ligand sits into a groove that contains two hydrophobic pockets that anchor the peptide into the PDZ domain (Fig. 1b). The first pocket (S0) is formed by the side chains of residues Y858, F860, L862 and L915. This relatively shallow pocket (accessible surface area ~28 Å2) accommodates the methyl group of the C-terminal alanine residue of the peptide (Ala8, position 0 or P0). This side chain is stabilized by multiple hydrogen bond interactions between the PDZ “carboxylate-binding loop” (residues 858–861, Fig. 1c) and the terminal carboxyl group of the peptide ligand. In addition, a bound water molecule (Wat41) is involved in a hydrogen bond network with the side chain nitrogen (NZ) of Lys850 and the carbonyl oxygen of Asp856. Binding specificity is aided by a second hydrophobic pocket (S−2) that accommodates the tyrosine side chain of the antepenultimate (position −2 or P−2) peptide residue (Fig. 1b). This pocket is formed by the side chains of Leu874, Leu911 and Lys912 and is significantly larger than the S0 pocket with an accessible surface area of ~ 118 Å2.
Fig.1.
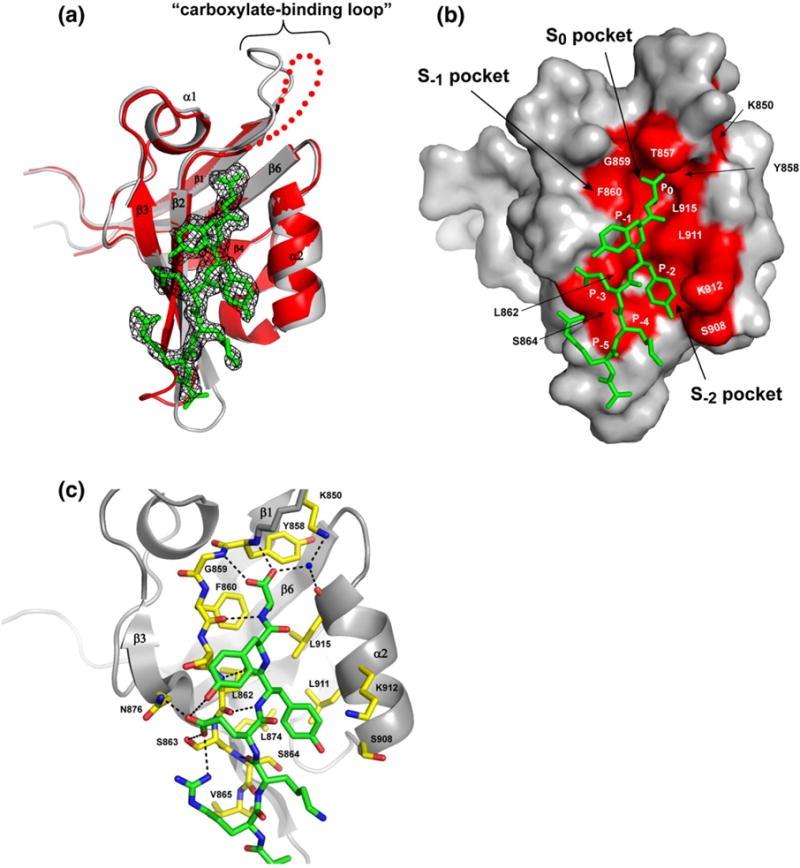
Free and Model peptide-bound structures of Tiam1 PDZ domain. (a) Ribbon representation of the free (red) and peptide-bound (gray) structures of the Tiam1 PDZ domain. The peptide (green) is shown with electron density contoured at 1σ. (b) A space-filling model showing the peptide-binding pocket in the PDZ domain. Residues important for the PDZ/peptide interaction are labeled. (c) A stick model showing the side chain and backbone interactions in the Tiam1 PDZ/Model complex. PDZ residues involved in binding the Model peptide are labeled and colored in yellow. Dotted lines indicate hydrogen bonding interactions identified using the program WhatIf.94
The PDZ/Model complex contains several hydrogen bond interactions between the PDZ domain and the peptide that are summarized in Fig. 1c. The β2 strand (residues 860–866) of the PDZ domain makes typical backbone β-strand hydrogen bonding interactions with the last seven peptide residues. These interactions are augmented by side chain hydrogen bonds between the PDZ domain and the peptide. Notably, the peptide side chain carboxylate of residue Glu5 (P−3) hydrogen bonds with the side chain of Asn876 (ND2) and the hydroxyl of Ser863 of the PDZ domain.
Finally, a distinguishing feature of the free Tiam1 PDZ domain structure is the absence of electron density for the “carboxylate-binding” loop (residues 851–857), whereas in the presence of the peptide ligand, the electron density was clearly interpretable. Significant variability in the conformation of this loop is present among the structures determined here (backbone RMSD ~ 9. 5 Å; Supplementary Data Table S1). Consistent with this, the solution NMR structural ensemble of the free Tiam1 PDZ domain (PDB code 2D8I; Riken Structural Genomics/Proteomics Initiative) also showed significant conformational differences in this region (Supplementary Data Table S2 and Fig. S1).
Identifying potential Tiam1 PDZ domain-binding proteins
Studies by Sonyang et al. (1997) and Tonikan et al. (2008) identified synthetic peptides capable of binding the Tiam1 PDZ domain. The peptide motif derived corresponds to a Class II-type ligand17,18 with a consensus amino acid sequence of [YFG]-[YFHW]-[WFA]COOH. Searching the PROSITE database21 with this motif yielded 84 candidate human Tiam1 PDZ-binding proteins (Supplementary Data Table S3). Among these were Syndecan proteins and Contactin-associated protein-like 4 (Caspr4). Syndecans are cell–cell and cell-matrix adhesion proteins,22,23 and Caspr424 is a neuron-specific cell–cell adhesion protein of the Neurexin family. The four isoforms of Syndecan (1–4) have very similar C-terminal sequences with the last four residues all containing EFYACOOH, and the C-terminal four residues of Caspr4 are EYFFCOOH. Because Tiam1 function has been linked to cell-cell and cell-matrix adhesion, we further characterized the interactions of the Tiam1 PDZ domain with Sydecan1 and Caspr4 peptides.
Characterizing Tiam1 PDZ/ligand interactions
To establish whether putative PDZ domain partner proteins are capable of binding the Tiam1 PDZ domain, we used fluorescence- and NMR-based binding assays to detect PDZ/peptide interactions.25 Carboxyl-terminal 8-mer peptides corresponding to the Model peptide (SSRKEYYACOOH), Syndecan1 (TKQEEFYACOOH), Caspr4 (ENQKEYFFCOOH) and Neurexin1 (NKDKEYYVCOOH) were synthesized. For fluorescence titration assays, peptides were chemically modified with an N-terminal fluorescent dansyl moiety, whereas NMR titrations used N-terminal acetylated peptides. The peptide derived from Neurexin1 was also tested because of its similarity to the C-terminal sequence of Caspr4. In addition, a Syndecan1 peptide phosphorylated at P−1 (Tyr309) was synthesized because it has been shown that Syntenin1 PDZ2/Syndecan4 interactions are regulated by phosphorylation.26 Fig. 2 shows representative curves for fluorescence-based Tiam1 PDZ/ peptide titrations. The fitted dissociation constants (Kd) were in the range ~17–65 μM. The binding affinity of the Model and Neurexin1 peptides were found to be weak, with Kd > 100 μM, and could not be fit to the fluorescence data reliably; however, Kds could be estimated from NMR titration experiments (Supplementary Data Figs. S2 and S3). In contrast, the Syndecan1- and Caspr4-derived peptides bound the Tiam1 PDZ domain with a dissociation constant of 27 μM and 17 μM, respectively. Table 2 gives a summary of the binding data and shows that the affinity of the Tiam1 PDZ domain for the consensus Model peptide (EYYA) was fourfold weaker than the Syndecan1 peptide (EFYA) interaction and about sevenfold weaker than the Caspr4 peptide (EYFF).
Fig. 2.
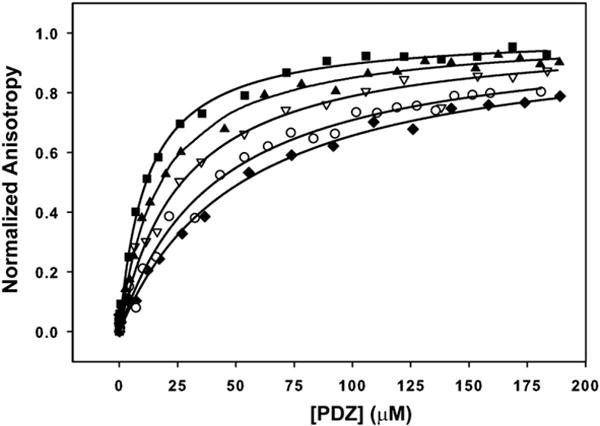
The Tiam1 PDZ domain binds Syndecanl and Caspr4 peptides. Representative titrations of Tiam1 PDZ domain with dansylated peptides derived from Syndecan1 (∇), Caspr4 (■), Syndecan1 A→F (◆), Caspr4 F→A (○), and tyrosine-phosphorylated Syndecan1 (▲). Fluorescence anisotropy data for each peptide were measured in triplicate and fit to Eq. (3) (see Materials and Methods).
Table 2.
Dissociation constants (Kd) for the interactions between Tiam1 PDZ domain and the peptides listed obtained by fluorescence anisotropy
| Peptide | Sequence
|
Kd (μM) | Fold versus Model a |
|---|---|---|---|
| P−7-P−6-P−5-P−4-P−3-P−2-P−1-P0 | |||
| Consensus Model | Ac-SSRKEYYA | 112±15b | |
| Syndecanl | dan-TKQEEFYA | 26.9±0.9 | 4.2 |
| Syndecan1 (phos) | dan-TKQEEFYpA | 19.3±1.5 | 5.8 |
| Syndecan1 (A→F) | dan-TKQEEFYF | 55.7±3.6 | 2.0 |
| Caspr4 | dan-ENQKEYFF | 16.8±5.4 | 6.7 |
| Caspr4 (F→A) | dan-ENQKEYFA | 64.8±5.9 | 1.7 |
| Neurexin1 | Ac-NKDKEYYV | 2400±250b | 0.05 |
dan, dansyl moiety; Ac, acetylated.
Fold versus Model refers to Kd (Model)/Kd (peptide).
Affinity determined by NMR titration.
To further probe the selectivity of the C-terminal residue, we synthesized peptides for Syndecan1 and Caspr4 that had their terminal residue mutated, Caspr4(F→A) and Syndecan1(A→F), and determined their affinity for the Tiam1 PDZ domain. The Kd of the Syndecan1(A→F) mutant was reduced by about twofold over Syndecan1, while the Caspr4 (F→A) mutant was reduced about fourfold over Caspr4 (Table 2). The differences in sequence between the Caspr4(F→A) and the Model peptide were minor over the five C-terminal residues (P−4–P0); the only difference was the hydroxyl group at position P−1. These results suggest the nature of the N-terminal residues (P−7–P−4) contributes to the binding; however, in the Tiam1 PDZ/Model crystal structure the two most N-terminal residues were disordered (P−7 and P−6), indicating that positions P−5 and P−4 are crucial for PDZ/ligand interactions.
Interestingly, the Neurexin1 peptide showed very weak affinity (~ 2.4 mM) for the Tiam1 PDZ domain, approximately 19-fold lower affinity compared to the Model peptide. The two most significant differences between these two sequences occur at P−5 (Arg→Asp) and the most C-terminal residue (P0), where the alanine was replaced by valine in Neurexin1. These results indicate that the final C-terminal residue also contributes to binding. Together, the binding data suggest that context-dependent interactions between the Tiam1 PDZ domain and its peptide ligand are responsible for PDZ specificity.
Distinct chemical shift changes in Tiam1 PDZ/Syndecan1 and PDZ/Caspr4 peptide complexes
We used NMR spectroscopy to identify the residues in the Tiam1 PDZ domain that participate in Syndecan1, Caspr4, Model and Neurexin interactions. A series of 15N-heteronuclear single quantum coherence spectra were collected for a protein solution containing 15N-labeled PDZ domain with increasing concentration of peptide. To interpret these data, we determined the backbone resonance assignments of the free Tiam1 PDZ domain. The assignment of 82/86 1H-15N resonances for nonproline residues was possible; however, it was not possible to assign residues Tyr858, Glu880, Ser908 and Ser909. It was found that most peaks were in fast exchange, which allowed peak tracking throughout each titration. The two exceptions were Gly859 and Thr881, which could not be tracked because they exhibited slow/intermediate exchange kinetics on the NMR time scale. Fig. 3 shows titration data for Syndecan1 and Caspr4 peptides and highlights residues in the Tiam1 PDZ domain that had significant change in chemical shift. (The data for the Model and Neurexin1 titration experiments are shown in Supplementary Data Figs. S2 and S3, respectively.) The weighted change in 1H and 15N chemical shift for each residue that could be compared is plotted in Fig. 3c and d. The average change in chemical shift for the two complexes was similar (0.0718 ppm for PDZ/Syndecan1 and 0.0664 ppm for PDZ/Caspr4). Fig. 3e and f show these data mapped onto the structure of the Tiam1 PDZ/Model peptide complex and indicate a set of perturbed residues common to both complexes, as well as highlighting regions of difference. In particular, residues along β2 had a similar pattern of chemical shift change upon titration of either peptide, while residues in helix α2 exhibited changes at two distinct and overlapping surfaces (residues 904, 911, 912, 915, 916 and 919 in Syndecan1 and residues 907, 912–914, 916, 917, 920 and 921 in Caspr4). Most notably, the chemical shifts of Leu911 and Leu915 in α2 show large changes in the Syndecan1 complex, but were not disturbed in the Caspr4 complex. Conversely, Leu920, a residue in β6 located distal to the binding pocket, is shifted significantly upon titration of Caspr4 but does not shift in the Syndecan1 titration. Together, these data suggest that specificity towards peptides derived from Syndecan1 and Caspr4 is determined by distinct but overlapping sets of residues.
Fig. 3.
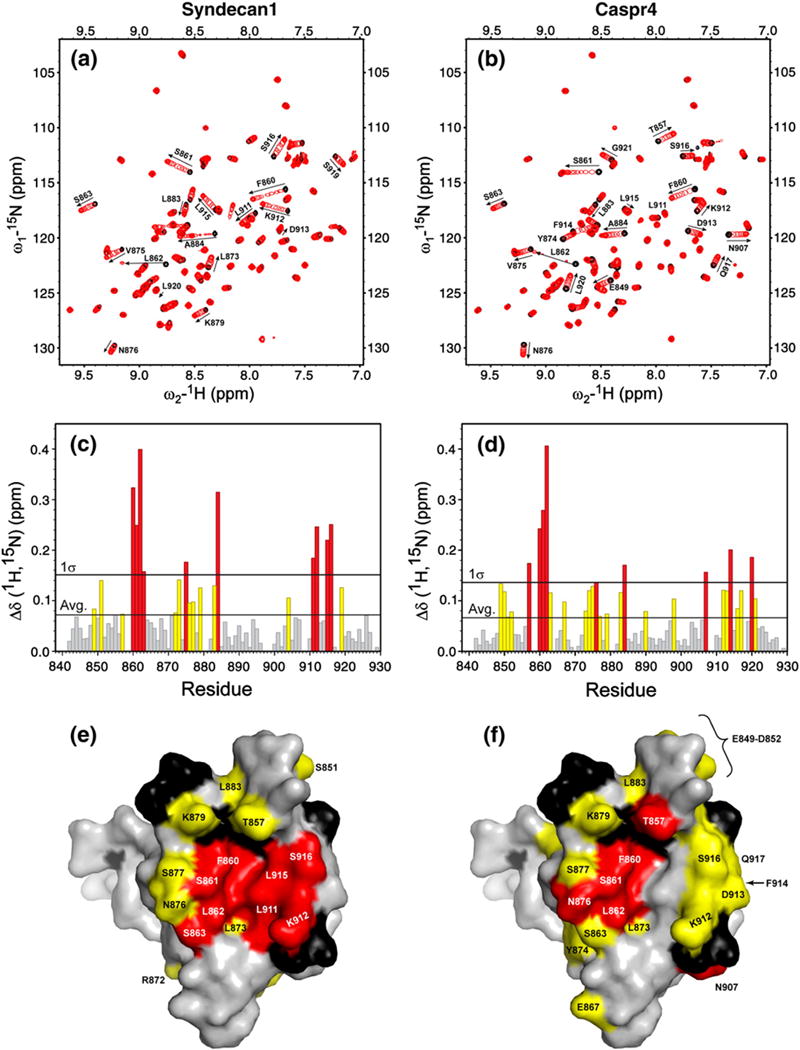
Syndecan1 and Caspr4 peptides induce distinct changes in 1H-15N heteronuclear single quantum coherence spectra of the Tiam1 PDZ domain. The ligand-free protein (black peaks) was titrated with either (a) the Syndecan1 or (b) the Caspr4 peptide (red peaks) to a final PDZ to peptide molar ratio of 1:3. (c and d) The weighted changes in chemical shift upon titration; residues with a chemical shift change >σ above the average are colored red, and residues with a chemical shift change between the average and 1σ are colored yellow. Residues that did not have a significant change in chemical shift are colored gray. The changes in chemical shift for (e) Syndecan1 and (f) Caspr4 are mapped onto the spacefilling model of the Tiam1 PDZ/Model crystal structure. Residues colored red and yellow follow the convention described above. Unassigned residues are black and residues unchanged during the titration are colored gray.
In a global sense, the degree of similarity in residues required for specificity between PDZ complexes can be quantified by comparing the changes in chemical shift per residue (△δ). Fig. 4 shows the correlation between the changes in chemical shift in the PDZ/ Model complex compared to the PDZ/Syndecan1 (Fig. 4a) and PDZ/Caspr4 complex (Fig. 4b). On the basis of the high degree of correlation for the PDZ/ Model and PDZ/Syndecan1 complexes (r2 = 0.92), it is clear that they are structurally very similar. In contrast, the PDZ/Model and PDZ/Caspr4 complexes are significantly less well correlated (r2 = 0.49), suggesting that they are structurally distinct. Similarly, a low degree of correlation was obtained for comparison of the PDZ/Syndecan1 and PDZ/ Caspr4 complexes (r2 = 0.45). Thus, we conclude that the Model peptide is a good surrogate for the Syndecan1 peptide, and that similar interactions are occurring in both complexes.
Fig. 4.

The Tiam1 PDZ/Mode1 and PDZ/Syndecan1 complexes are structurally similar, but distinct from the Tiam1 PDZ/Caspr4 complex. Plots indicating the correlation between the changes in chemical shift per residue between the Tiam1 PDZ/Model complex and the (a) PDZ/Syndecan1 or (b) PDZ/Caspr4 complexes.
Tiam1 PDZ domain mutant retains cellular localization and GEF activity
To investigate the biological function of the Tiam1 PDZ domain we established MDCK cell lines stably expressing green fluorescent protein (GFP)-labeled wild type (WT) Tiam1-C1199 (GFP-Tiam1 WT) or a PDZ mutant (GFP-Tiam1-PDZmut). The Tiam1-C1199 construct is a commonly used N-terminal truncation (at residue 392) that results in an activated Tiam1 protein.27 The GFP-Tiam1-PDZmut had five residues of the PDZ binding pocket (858–862) substituted to alanine. Introduction of these mutations into the isolated PDZ domain was highly destabilizing and resulted in unfolded protein. However, three lines of evidence suggest that in the context of Tiam1-C1199, the PDZ mutations do not globally perturb Tiam1 function, and affect only the PDZ domain binding function. First, Tiam1 GFP-Tiam1WT and Tiam1 GFP-Tiam1-PDZmut were expressed at equivalent levels (Fig. 5a), suggesting that domain-domain interactions stabilize the GFP-Tiam1-PDZmut protein. Second, the WT and PDZ mutant both localized to sites of cell-cell junctions (Supplementary Data Fig. S4), indicating that this function remains intact. Third, Rac1 activity assays (Fig. 5a) revealed that equivalent levels of Rac1-GTP were present in wild type and PDZ mutant Tiam1 cells, which were significantly greater than the level found in control cells expressing GFP alone. From these experiments, we conclude that the GFP-Tiam1-PDZmut retains intrinsic Tiam1 GEF activity and localizes to cell-cell junctions. Moreover, we infer that these functions are independent of the PDZ domain.
Fig. 5.
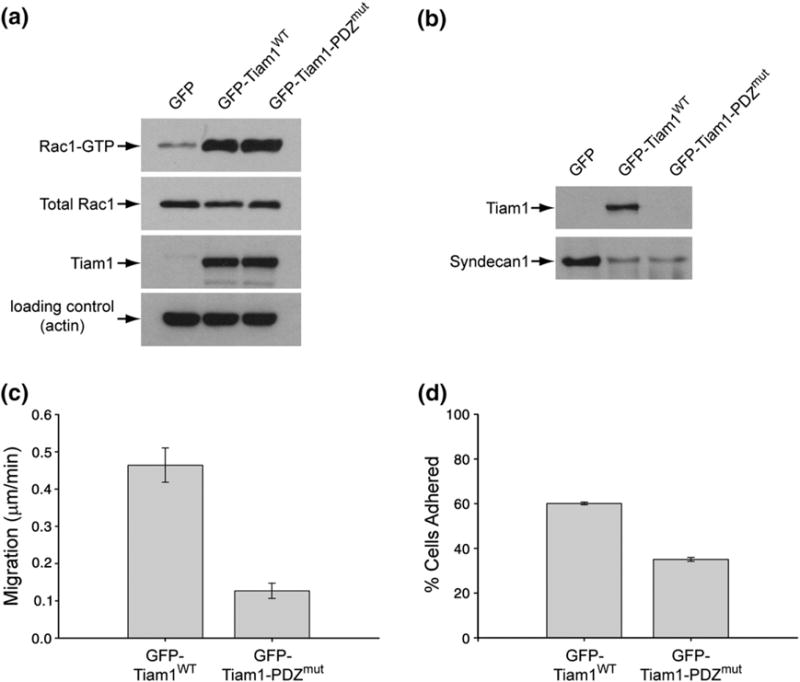
The Tiam1 PDZ domain binds Syndecan1 and is important for cell-matrix adhesion and cell migration. MDCK I cells stably expressing GFP, GFP-Tiam1WT and GFP-Tiam1-PDZmut were used in these assays. (a) The protein expression levels of active Rac1 (Rac1-GTP), total Rac1, Tiam1 (WT and PDZmut) and actin (loading control). The relative amount of active, GTP-bound Rac1 was determined using the GST-PAK-CRIB domain (PBD) that selectively precipitates GTP-bound Rac1 (top blot). GST-PBD precipitations were immunoblotted with a monoclonal antibody that recognizes Rac1. The data are representative of at least three independent experiments. (b) MDCK cells co-expressing the indicated Tiam1 proteins and myc-Syndecan1 were cultured to confluence, lysed, and Syndecan1 was immunoprecipitated. The resulting immunoprecipitates were subjected to western blot analysis to reveal the co-precipitating levels of Tiam1 or Syndecan1. The results are representative of three independent experiments. (c) The rate of wound closure over 18–24 h for Tiam1WT and Tiam1-PDZmut. The mean of three independent experiments and the standard error of the mean are plotted. (d) Cell–matrix adhesion assays were initiated by plating cells onto dishes coated with human fibronectin (10 μg/mL) for 45 min s at 37°C. The number of cells was quantified by light microscopy and the results are expressed as a percentage of the total number of cells. The mean of three independent experiments and the standard error of the mean are plotted.
Tiam1 binds Syndecan1 in a PDZ-dependent manner
Peptide binding studies and NMR titrations clearly indicate that the peptide derived from Syndecan1 binds the Tiam1 PDZ domain. We investigated the possibility that Tiam1 could bind full-length Syndecan1 in our MDCK cell lines. Because there is no commercially available antibody against canine Syndecan1, we chose to over-express mouse Syndecan1 in cells stably expressing GFP, GFP-Tiam1 WT and GFP-Tiam1-PDZmut . Fig. 5b shows that immunoprecipitated Syndecan1 bound GFP-Tiam1WT efficiently, but did not bind GFP-Tiam1-PDZmut. We conclude that in epithelial cells, the Tiam1/Syndecan1 interaction occurs through the Tiam1 PDZ domain.
The Tiam1 PDZ/Syndecan1 interaction promotes cell-matrix adhesion and cell migration
Syndecan1 is an important mediator of cell–matrix interactions and has a role in cell migration.22,23 We were interested in investigating what role the Tiam1/Syndecan interaction might have in these processes. To assess cell migration, we performed wound closure assays with MDCK cells expressing GFP-Tiam1WT and GFP-Tiam1-PDZmut constructs. Cells plated on fibronectin were subjected to a scratch wound and monitored over time. Fig. 5c shows that wound closure was ~3.7-fold slower for the PDZ mutant cells relative to cells with Tiam1WT. Cell-substrate adhesion was measured by plating cells on fibronectin-coated surfaces and counting the number that remained adhered to the matrix after gentle washing. Fig. 5d indicates that cells expressing the GFP-Tiam1WT were ~ 1.7-fold more adherent to fibronectin-coated plates than the GFP-Tiam1-PDZmut.
Discussion
Tiam1 has well established functions in cell polarity, cell-cell adhesion and cell migration.16,28,29 Ultimately, Tiam1 function is derived through its ability to regulate the spatial and temporal activity of its cognate GTPase, Rac1. To achieve this exquisite regulation, Tiam1 is tightly controlled via protein-protein interactions. In this regard, distinct protein domains in Tiam1 interact with proteins or complexes to regulate Rac1 activity.29–31 In particular, the RBD32–34 and PHn-CC-Ex3–5,35–38 regions are critical for Tiam1 activation and subcellular localization, respectively. In contrast, the specific function (s) or interacting protein(s) that bind the Tiam1 PDZ domain are poorly understood. In this work, we determined the structure and binding specificity of the Tiam1 PDZ domain and identified Syndecan1 as a physiological binding partner. Moreover, mutation of the Tiam1 PDZ domain affects Tiam1 cell–matrix adhesion and migration, suggesting that the Tiam1/Syndecan1 interaction is a critical regulator of these functions.
Context-dependent interactions in Tiam1 PDZ/peptide complexes
The structure of the Tiam1 PDZ domain bound to a consensus Model peptide displayed the canonical PDZ-binding β-insertion mechanism, whereby the C-terminal peptide ligand inserts into the binding groove of the PDZ domain through hydrogen bonding interactions with β2. Although the overall structure is very similar to those of other PDZ domain structures, the Tiam1 structure reveals that the β1-β2 (carboxylate binding) and β2–β3 loops are extended. As proposed initially by Kang et al. (2003), PDZ-ligand interactions generally occupy any of three pockets (S0, S−1 and S−2) that accommodate the side chains of the C-terminal residues leading to a combinatorial model for PDZ specificity.39 Only two of the three binding pockets are occupied in the Tiam1 PDZ/Model complex. The S0 pocket is shallow and partially filled by the C-terminal side chain methyl group of alanine, while the S−2 pocket is filled by the P−2 tyrosine side chain. In contrast, the S−2 pocket remains largely unoccupied (Figs. 1b and 6a).
Fig. 6.
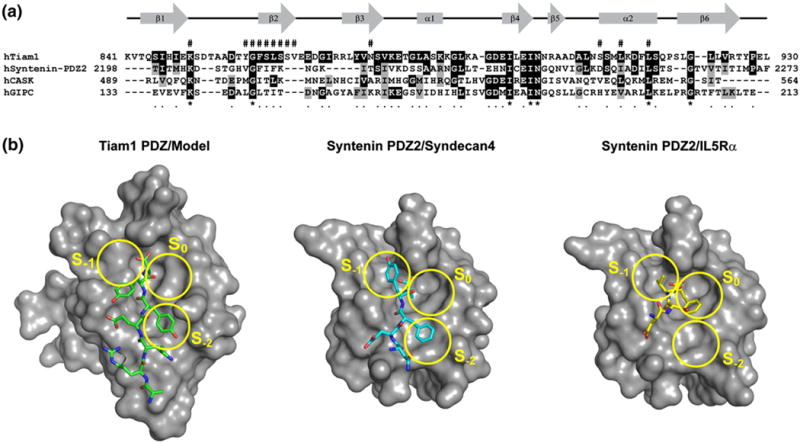
Distinct modes of peptide binding for Tiam1 and Syntenin PDZ domains. (a) The amino acid alignment of Syndecan-binding PDZ domains. Black and gray shading indicate that the residue is identical with or similar to that found in the Tiam1 PDZ domain, respectively. The pound sign (#) above the amino acid sequence indicates residues that participate in Tiam1 PDZ/ligand interactions. The gene accession codes are: Tiam1 (Q13009), Syntenin (O00560), Ca2+/calmodulin-associated Ser/Thr kinase (O14936), and GIPC (014908). (b) The binding surface and ligand-binding modes for the Tiam1 PDZ/Model and Syntenin PDZ2/Syndecan4 (PDB code 1OBY) complexes are compared. The three PDZ binding pockets (S0, S−1 and S−2) are highlighted in yellow and the orientation of each peptide is shown in stick representation. The Syntenin PDZ2/IL5Rα complex (PDB code 1OBX) illustrates how the C-terminal Phe residue of the peptide fits into the S0 pocket.
Several studies have established that the Tiam1 PDZ domain is capable of binding a variety of synthetic Class II-type peptides, with a preference for those that contain alanine, tryptophan or phenylalanine at the C-terminus.17,18 Indeed, our peptide-binding studies (Figs. 2 and 3) clearly show that the Tiam1 PDZ domain binds peptides derived from Syndecan1 and Caspr4 with typical PDZ/ ligand affinity. The structure of the Tiam1 PDZ/ Model peptide also indicates that PDZ/peptide interactions occur through the seven C-terminal residues, rather than the typical three or four terminal residues. These interactions are detailed in Fig. 1c and they are likely to provide stability and specificity to the PDZ/ligand interaction. Distal interactions such as these are becoming more evident and have been reported for several other PDZ domain-ligand complexes.40–43 Our binding data indicate that the final C-terminal residue also contributes to binding. This finding is evident from Table 2, which shows ~2–4-fold changes in affinity upon substituting the residue at the C-terminus. Together, our data suggest that context-dependent interactions between the Tiam1 PDZ domain and its peptide ligand are responsible for PDZ specificity. Thus, the simple combinatorial model described by Kang et al. (2003) does not readily explain context-dependent interactions observed in the Tiam1/ Model structure. A similar conclusion was reached by Stiffler et al. (2007) on the basis of a large-scale mouse proteome study that characterized the binding of ~150 PDZ domains to >200 sequences derived from authentic mouse proteins.20 For Tiam1, we advocate a model in which ligand specificity and affinity is attained by multiple PDZ domain residues that recognize individual positions on the peptide ligand to create context-dependent PDZ/ligand interactions.
The Tiam1 PDZ and Syntenin PDZ2 domains have similar ligand specificity; i.e. they both bind Class II peptides with a preference for Ala or Phe at the C-terminus. Specifically, both bind Syndecan proteins. The Syntenin PDZ domain appears distinct, however, in that it also can accommodate Class I peptides.39 Currently, it is unclear whether the Tiam1 PDZ domain binds Class I peptides because of the paucity of information concerning physiological ligands. Fig. 6 shows the amino acid sequences for Tiam1 and Syntenin PDZ domains and a comparison of the binding surfaces for the Tiam1 PDZ/Model peptide complex, Syntenin PDZ2 bound to a Syndecan4 peptide (TNEFYACOOH) and Syntenin PDZ2 bound to an IL5Rα peptide (ETLEDSVFCOOH).39 The Syndecan4 and the Tiam1 Model peptide share a high degree of sequence identity, especially at the extreme C-terminus, and both use the S−2 binding pocket to accommodate the hydrophobic Tyr/Phe at position P−2. In contrast, the Tyr at position P−1 is buried in the deep Syntenin S−1 pocket but not in the shallower Tiam1 S−1 pocket. The differences in the side chains that line this pocket are likely to promote interactions that stabilize the aromatic side chain. In Syntenin, His208 stacks against the Tyr aromatic ring in P−1,39 while in Tiam1, the analogous residue at this position is Thr857 and it makes no side chain interaction with the peptide ligand. This might have functional consequences, since phosphorylation of Tyr309 in Syndecan1 disrupts the Syntenin PDZ2/Syndecan1 interaction26 but had no effect on the Tiam1 PDZ/Syndecan1 interaction (Table 2).
Finally, insight into how Tiam1 might accommodate Phe at the C-terminus, as in the Caspr4 interaction, is provided by the Syntenin PDZ2/ IL5Rα complex (Fig. 6b).39 In this complex, the S0 pocket is filled by the C-terminal Phe side chain. One could envision that the analogous surface in the Tiam1 PDZ domain might allow for similar interactions and this idea is supported by PDZ/Caspr4 titration data (Fig. 3) that indicate chemical shift perturbations occur near this pocket. Moreover, a superposition of the IL5Rα peptide onto the Tiam1 PDZ/Model structure supports this possibility. Together, these observations indicate that PDZ domains are rather “plastic” in how they accommodate similar peptide ligands, potentially complicating attempts at predicting PDZ specificity.
The Tiam1/Syndecan1 interaction and biological function
Syndecan proteins are type-I transmembrane heparin sulfate proteoglycans implicated in the regulation of cell adhesion, migration, and differentiation.44–46 There are four distinct members of the Syndecan family (Syndecan1–4) that differ primarily in developmental and tissue expression. All Syndecans possess extracellular, membranespanning, and cytoplasmic domains. The extracellular domain is decorated with glucosaminoglycans and functions as a cell surface receptor that interacts with matrix proteins, growth factors and co-receptors such as integrins (reviewed in Refs. 23,46,47). Syndecans also contain a short (~30 amino acid) cytoplasmic C-terminus that can be divided into two conserved regions (C1 and C2) and a variable region (V). The C1 region contains a short PDZ-binding motif (EFYA) that is conserved throughout all Syndecan members. This region is known to bind PDZ-containing proteins involved in cell migration, endocytic trafficking and dendritic spine formation. In particular, Synectin1,48,49 Synbindin,50 Ca2+/ calmodulin-associated Ser/Thr kinase51–53 and Syntenin54–56 bind Syndecan C-terminal residues and participate in downstream signaling events.
Many studies have shown a link between Syndecan signaling and Rho-family GTPase activation (reviewed in Refs 46,57,58). In this regard, Syndecan4 has been the best characterized. The current model suggests that clustering of Syndecan4 at sites of cell-matrix adhesion recruits protein kinase C alpha (PKCα) and this leads directly to RhoA59 or Rac1 activation.60,61 One mechanism for Rac1 activation is through the RhoG/Dock180/Elmo pathway, which is regulated by a novel Syndecan4/RhoGDI1/RhoG complex.61
Much less is known about the downstream signaling events of other Syndecan family members. Interestingly, two recent reports indicate that signaling with other Syndecan isoforms might be distinct from that of Syndecan4. In particular, it was found that in HT-1080 fibrosarcoma and colon carcinoma cells (Caco-2 and HCT116) Syndecan2 stimulated Rac1 activation through a Tiam1-dependent mechanism.62,63 One interesting possibility that was not tested is that Tiam1 might link Syndecan signaling directly to Rac1 activation. Indeed, our biochemical and structural data (Figs. 2 and 3) indicate Tiam1 binds the Syndecan1 C-terminal PDZ-binding motif directly through its PDZ domain, suggesting that this scenario is possible. In fact, our immunoprecipitation experiments establish that the Tiam1/Syndecan1 interaction occurs in MDCK cells in a PDZ-dependent fashion (Fig. 5b). Although our data do not address the mechanism for the regulation of this interaction directly, one possibility is that phosphorylation of tyrosine residues (e.g. Tyr309) within the C-terminus of Syndecan might be involved, as was shown for Syntenin PDZ2/Syndecan4 interaction. 26 However, our binding data with the phosphorylated Syndecan1 peptide indicate that the WT and phosphorylated Syndecan1 peptides bound the Tiam1 PDZ domain with a comparable affinity, suggesting that this regulatory mechanism is likely not operative. Interestingly, this result raises the possibility that phosphorylation of Syndecan might contribute to the selection of binding partners and subsequent signaling responses by modulating PDZ/Syndecan interactions.
What is the functional role of the Tiam1/Syndecan1 interaction? Using an MDCK cell culture system, we showed that a Tiam1 PDZ mutant has reduced cell-matrix migration and adhesion (Fig. 5c and d). Furthermore, Tiam1 and Syndecan1 interact directly in vitro and co-immunoprecipipate in MDCK cells. Together, these results strongly support the suggestion that a direct physical interaction links the Tiam1-Rac1 complex to Syndecan1 signaling. Tiam1-Rac1 signaling is known to be important for maintaining cell-cell adhesions and cell motility, while Syndecan1 has been implicated in both cell–matrix and cell-cell adhesions.46,64 Syndecan1 is localized to the basolateral region of polarized MDCK cells,2,55,64–67 partially overlapping with Tiam1 at adherens junctions and tight junctions2–4,9 and Syndecan2 was found to regulate Tiam1 membrane localization.63 Syndecan1 protein expression levels have been associated with the epithelial-mesenchymal transition (EMT)68–70 in several tumor types,22,67,71–74 while Tiam1 is also a crucial regulator of events that contribute to the EMT and tumor progression.33 Collectively, these observations connect two previously unrelated signaling pathways, both known to contribute to cancer pathology. Our results demonstrate that over-expression of a Tiam1 PDZ domain mutant inhibits cell migration (Fig. 5c), suggesting that a functional Tiam1 PDZ domain is required for tumor cell invasion. Thus, one intriguing possibility is that the Tiam1 PDZ/Syndecan1 interaction could be a potential target for new cancer therapeutics.
In conclusion, our studies provide insight into the structure, specificity, and function of the Tiam1 PDZ domain. First, we solved the crystal structure of the Tiam1 PDZ domain in complex with a Model peptide substrate. Analysis of this structure in combination with biochemical and NMR chemical shift titrations with Syndecan1 and Caspr4 peptides suggests that Tiam1 PDZ domain specificity for peptide ligands is context-dependent and spread across the six or seven C-terminal residues. Second, our studies document a physiological role for the Tiam1 PDZ domain in cell-matrix interactions and establish a novel link between Tiam1 and Syndecan1, two previously unrelated signal transduction pathways implicated in cancer. Future studies will address how this interaction is regulated and investigate the subsequent downstream signaling events that occur upon Syndecan engagement.
Materials and Methods
Protein expression and purification
The polymerase chain reaction was used to amplify the human Tiam1 PDZ domain (residues 841–930) from the full-length DNA sequence.32 The amplified DNA was ligated into a modified pET21a vector (Novagen) that contains an N-terminal His6 tag and a tobacco etch virus (rTEV) protease cleavage site. The nucleotide coding sequence of the pET21a-PDZ vector was verified by automated DNA sequencing (University of Iowa DNA Facility). All protein expression was conducted in BL21 (DE3) (Invitrogen) Escherichia coli cells. Typically, E. coli cells were grown at 37 °C in Luria-Bertani (LB) medium supplemented with ampicillin (100 μg/mL) under vigorous agitation until an A600 of 0.6~ 1.0 was reached. Cultures were subsequently cooled to 25 °C and protein expression was induced by the addition of isopropyl 1-thio-β-D-galactopyranoside (IPTG) to 1 mM final concentration. Induced cells were incubated for an additional 6–8 h at 25 °C and harvested by centrifugation. Isotopic labeling (15N and 15N,13C) of the Tiam1 PDZ domain was done as described.75 Briefly, E. coli cells were grown in 1 L of LB medium until an A600 of 0.6~1.0 was reached. This culture was centrifuged and then resuspended in 250 mL of isotopically labeled M9 medium and incubated for an additional 1 h before being induced with 1 mM IPTG for 6–8 h at 25°C.
The Tiam1 PDZ domain was purified by nickel-chelate (GE-Healthcare) and size-exclusion chromatography. The N-terminal His6 affinity tag was removed by proteolysis with recombinant rTEV protease for 12–16 h at room temperature. Undigested protein, cleaved His6 tag and His-tagged rTEV were separated from Tiam1 PDZ domain by nickel-chelate chromatography. The final yield was ~20 mg of PDZ protein (>95% pure as judged by SDS-PAGE) from 1 L of culture. Samples were used immediately or stored at −20 °C.
Synthetic peptides
All peptides were synthesized by GenScript Inc. (Piscat-away, NJ) and were >95% pure as judged by analytical HPLC and mass spectrometry. Peptides for fluorescence anisotropy-based binding assays were dansylated at their N-terminus, whereas peptides for NMR analysis were acetylated at their N-terminus. Peptide concentrations were determined by absorbance measurements (A280) using the calculated extinction coefficient determined using the program SEDNTERP (v1.09).76 The peptides used in this study were: Model Tiam1-binding peptide (SSRKEYYACOOH),17 Syndecan1 (residues 303–310: TKQEEFYACOOH), Caspr4 (residues 1301–1308: ENQKEYFFCOOH), and Neurexin-1 (residues 1470–1477: NKDKEYYVCOOH). In addition, the Caspr4(F→1A) (ENQKEYFACOOH) and Syndecan1(A→F) (TKQEEFYFCOOH) peptides, which represent C-terminal residue swaps, were synthesized. Finally, a danyslated and phosphorylated Syndecan1 peptide was synthesized (dansyl-TKQEEFpYACOOH).
Crystallization and data collection
Crystallization conditions for the free and peptidebound forms of the Tiam1 PDZ domain were determined by the hanging-drop, vapor-diffusion method using high-throughput screens automated by a Mosquito drop setter (TTP LabTech). Equal volumes (0.75 μL) of precipitant and protein (20 mg /mL) in 10 mM Hepes, 50 mM NaCl, pH 8.0 alone or with 10 molar equivalents of model peptide were used for screens. Crystals of the free Tiam1 PDZ domain were obtained in condition 61 of the PEG Ion screen (0.2 M sodium thiocyanate, 20% (w/v) PEG 3350; Hampton Research), and the PDZ/peptide complex formed crystals in condition 81 of the PEG Ion screen (0.2 M sodium sulfate, 20% (w/v) PEG 3350). Before data collection, crystals were soaked for 10 s in mother liquor supplemented with 20% glycerol and then flash-frozen in liquid nitrogen. Initial crystal diffraction screening was achieved with a CuK rotating anode beam; full X-ray diffraction datasets for structure determination were collected at the Advanced Photon Source (Argonne National Laboratories, Chicago, IL) beam line GM/CA CAT 23-ID-D (γ = 1.033 Å) with a MarMosaic detector (Rayonix, Evanston, IL) at 0.5 steps over 180° for the free crystal and over 120° for the peptide-bound form. The free Tiam1 PDZ domain crystallized in space group P3221 with one molecule per asymmetric unit and the peptide-bound complex crystallized in space group P21 with three molecules in the asymmetric unit. Proper space group handedness was verified by analysis of the electron density.
Structure determination and refinement
Indexing, integration, and scaling were performed using d*TREK.77 Molecular replacement using MOLREP78 implemented in the CCP4 package was used to determine initial phases for both datasets. The model used to estimate the initial phases for the free Tiam1 PDZ domain was obtained from an average structure of previously determined PDZ domain structures (PDB codes 1OBZ and 1G9O) whose side chains and loops were removed. The preliminary model of the free Tiam1 PDZ domain was used to determine the initial phases of the Tiam1 PDZ/ peptide complex. Automated model building was carried out using ARP/wARP79,80 and further refinement was carried out in the PHENIX81,82 software suite, and electron density and manual model building was done using Coot. 83 After initial model building, water and dual occupancy side chains (H847, E866, S877, S908, L911, D913, S916 and S919 for free; H847 in chain A, D905 in chain B, H847, S863, R871 and R872 in chain C for the peptide-bound form) were modeled into electron density using Coot, followed by further refinement using anisotropic refinement on the fitted protein atoms. Rfree values were calculated using 10% of the reflections selected randomly and not used in the refinement.84 The structures were refined to 1.3 A in the free form and to 1.8 Å in the peptide-bound form. In the free form, electron density was absent from the carboxylate-binding loop (residues 851–857). In the bound form, chain C did not contain enough electron density to model in residues 853–855 and 867–868. Secondary structure was determined by DSSP.85 MolProbity86 was used to validate the structures. The Ramachandran analysis (performed in MolProbity) reported that all residues for both structures were in favored/allowed regions. The refinement statistics are given in Table 1.
All structure figures and structural alignments were performed with PyMOL†. The solvent accessible surfaces were calculated with GetArea.87 Solvent accessible surfaces of the binding pockets were determined by subtraction between the accessible surfaces of the structure with and without ligand atoms found within the binding pocket of interest.
NMR spectroscopy and data processing
NMR spectra were recorded at 25 °C using either a Varian 600 MHz or Bruker 500 MHz spectrometer. All NMR data were processed using NMRPipe88 and analyzed using Sparky ‡.89 Backbone chemical shift assignments were determined using standard triple resonance experiments on a 1.3 mM (U-15N,13C)-labeled sample of Tiam1 PDZ domain in 20 mM sodium phosphate (pH 6.8), 50 mM NaCl, 10 μM sodium azide. The Pine automation server90,91 was used for initial assignments, which were verified manually. Chemical shift perturbation experiments were performed in NMR buffer with 0.5 mM 15N-labeled Tiam1 PDZ and serial addition of concentrated (2 mM) peptide added in ~ 8 titration steps to a final molar ratio of peptide to PDZ domain of 3:1 or 5:1. The weighted changes in 1H,15N amide chemical shift were calculated as (Eq. 1):
| (1) |
The dissociation constants for the Model and Neurexin1 peptides were determined by fitting the weighted change in chemical shift as a function of peptide concentration to Eq. (2):
| (2) |
where P and L are the protein and ligand concentrations, respectively;92 △δobs is the observed change in chemical shift upon ligand titration and △δsat is the change in chemical shift upon saturatation. △δsat and Kd were determined by nonlinear regression analysis (Sigma Plot; SPPS, Inc.) of the data to Eq (2).
Fluorescence anisotropy binding assays
Fluorescence anisotropy was used to monitor the binding of dansylated peptides to the Tiam1 PDZ domain. PDZ protein (1. 5 mM stock) was titrated into 1. 3 mL of 0. 2 μM dansylated peptide contained in a stirred quartz cuvette until saturation. Fluorescence anisotropy measurements were recorded at 25°C on a Fluorolog 3 (Jobin Yvon, Horiba) spectrofluorimeter with γex of 340 nm and γem of 550 nm, slit widths of 10 nm (excitation) and 2 nm (emission), respectively. Individual measurements were integrated for 1 s. Data were baseline corrected with a buffer blank. Bmax and Kd for each titration were determined by fitting baseline-corrected data to Eq. (3) by non-linear regression (Sigma Plot; SPPS, Inc.).
| (3) |
For presentation, the data for each curve in Fig. 2 were normalized to the fitted Bmax. Reported dissociation constants are the average of at least three independent experiments.
Mammalian expression vectors and antibodies
To construct the pLPCX-GFP vector, GFP was amplified using PCR and subcloned into the pLPCX vector (Clonetech). The pLPCX-GFP-Tiam1-C1199 vector was assembled by subcloning the entire HindIII and NotI fragment spanning the 135 kDa C-terminal region of human Tiam1 (pCAN-myc-Tiam1-C1199; a generous gift from Dr Channing Der, University of North Carolina)32,93 into pLPCX-GFP (pLPCX-GFP-Tiam1WT). The pLPCX-GFP-Tiam1-C1199 PDZ mutant (pLPCX-GFP-Tiam1-PDZmut) was constructed by substituting each residue in the ligand-binding pocket (858–862; Tyr-Gly-Phe-Ser-Leu) to alanine using oligonucleotide-directed mutagenesis. The pQCXIP-myc-Syndecan1 construct was a generous gift from Dr Ira Mellman.64 All coding sequences were verified by DNA sequencing. The antibodies used were: anti-Tiam1 (C-16; Santa Cruz Biotechnology), anti-Syndecan165 (281.2; a generous gift from Dr Alan Rapraeger, University of Wisconsin), anti-GFP (11814460001, Roche), and anti-Rac1 (610651, BD Biosciences).
Cell culture
MDCK I cells were purchased from ATCC and maintained in DMEM, 10% FBS, and 100 U/ml each of penicillin and streptomycin. To generate MDCK cells stably expressing the GFP proteins, pLPCX-GFP, pLPCX-GFP-Tiam1WT and pLPCX-GFP-Tiam1-PDZmut, cDNAs were transfected into GPG-293 virus-producing cells using the Lipofectamine reagent (Invitrogen). Viral supernatants were collected, concentrated, and used to infect MDCK cells. Cells expressing the GFP proteins were selected in medium containing 2 μg/mL puromycin, and the expression of the GFP proteins was confirmed by western blot analysis using an antibody against GFP. To express myc-Synedcan1, retroviral particles encoding mouse Syndecan1 were generated as described above and used to infect MDCK I cells that were then harvested two days post infection.
Rac1 activity assays
To measure Rac1 activity, MDCK I cells expressing GFP, GFP-Tiam1WT or GFP-Tiam1-PDZmut were lysed in icecold buffer A (50 mM Tris, pH 7.6, 500 mM NaCl, 0.1% (w/v) SDS, 0.5% (w/v) sodium deoxycholate, 1% (v/v) Triton X-100, 10 mM MgCl2, 1 mM PMSF, 20 mg /mL aprotinin, 2 mM Na3VO4), and the lysates were clarified by centrifugation. The active GTP-bound Rac1 was affinity-precipitated using a GST fusion protein with the Rac1/Cdc42-binding domain of PAK (PBD) conjugated to glutathione-Sepharose (GE-Healthcare). The PDB-bound beads were washed three times in buffer A containing 150 mM NaCl. Bound proteins were resolved using SDSPAGE and immunoblotted using anti-Rac1 (1:1000).
Immunoprecipitation assays
MDCK cells were washed twice in ice-cold HBS (20 mM Hepes, pH 7.5, 150 mM NaCl), and lysed in ice-cold EB (10 mM Tris, pH 7.4, 50 mM NaCl, 1.0% Triton X-100, 0.1% SDS, 5 mM EDTA, 1 mM PMSF, 10. 0 μg/ml aprotinin, 1 mM PMSF). Syndecan1 was immunoprecipitated using 5.0 μg of the 281.2 antibody, and the immunoprecipitates were washed four times in EB and twice in heparitinase buffer (50 mM Hepes, pH 6.5, 50 mM sodium oxaloacetate, 150 mM NaCl, 5 mM CaCl2). The immunoprecipitates were digested with 0.004 U/mL of heparitinase I and chondroitinase (0.1 U/mL) for 2.5 h at 37 °C to remove the sugar moieties, suspended in sample buffer, resolved by SDS-PAGE, and transferred to Immobilon PVDF membrane (Millipore). The co-precipitating levels of Tiam1 and the amount of Syndecan1 present in the immunoprecipitates were visualized by western blotting.
Wound closure assays
MDCK cells were plated at high density and cultured for two days on fibronectin-coated surfaces. Wounds were inflicted in confluent monolayers using a pipet tip, and the cultures were washed and incubated in serum-free medium. Images were acquired every 10 min for 18–24 h using Zeiss axiovert inverted microscope equipped with a Hamamatsu ORCA-ER camera. Cells were maintained in a heated and humidified incubation chamber during the acquisition of all images. The rate (μm/min) of wound closure over 18–24 h was determined using Axiovision Imaging Software (Zeiss Corporation).
Cell-matrix adhesion assays
MDCK cells were lifted using phosphate-buffered saline (PBS) supplemented with 4 mM EDTA, washed in serumfree DMEM, and plated on dishes coated with 10 μg/mL human fibronectin for 45 min at 37 °C. The culture dishes were washed three times in PBS. The number of adherent cells in 20 fields of view were counted using phase microscopy and used to calculate the percentage of adhered cells.
Protein Data Bank accession codes
The atomic coordinates and structure factor amplitudes have been deposited in the PDB with accession codes 3KZD and 3KZE for the free and peptide-bound PDZ domains, respectively.
Supplementary Material
Acknowledgments
We thank members of the Fuentes laboratory for helpful discussions and comments on the manuscript. We are grateful to Drs Nate Coussens and Lokesh Gakhar for crystallographic advice during the initial phases of the project and to Drs Liping Yu and Andrew Fowler for assistance with NMR data collection. We thank The Roy J. Carver Charitable Trust (grant #01–224) for continued funding of the College of Medical NMR Facility. E.J.F. was supported by funds from an NSF Research Starter Grant (MCB-0624451), Roy J. Carver Trust Medical Research Initiative Grant (grant #01–224), American Cancer Society (IRG-77-004-28), and the American Heart Association (0835261N). Crystallographic data sets were collected at the GM/CA CAT, which has been funded in whole or in part with Federal funds from the National Cancer Institute (Y1-CO-1020) and the National Institute of General Medical Science (Y1-GM-1104). Use of the Advanced Photon Source was supported by the U.S. Department of Energy, Basic Energy Sciences, Office of Science, under contract no. DE-AC02-06CH11357.
Abbreviations
- PDZ
post-synaptic density-95/ discs large/zonula occludens-1
- GFP
green fluorescent protein
- EMT
epithelial-mesenchymal transition
- GEF
guanine exchange factor
- WT
wild type
- MDCK
Madin-Darby canine kidney cells
Footnotes
T. D. Goddard and D. G. Kneller (2007). SPARKY 3. Univeristy of California, San Fransico.
Supplementary Data
Supplementary data associated with this article can be found, in the online version, at doi:10.1016/j.jmb.2010.03.047
References
- 1.Jaffe AB, Hall A. Rho GTPases: biochemistry and biology. Annu Rev Cell Dev Biol. 2005;21:247–269. doi: 10.1146/annurev.cellbio.21.020604.150721. [DOI] [PubMed] [Google Scholar]
- 2.Malliri A, van Es S, Huveneers S, Collard JG. The Rac exchange factor Tiam1 is required for the establishment and maintenance of cadherin-based adhesions. J Biol Chem. 2004;279:30092–30098. doi: 10.1074/jbc.M401192200. [DOI] [PubMed] [Google Scholar]
- 3.Chen X, Macara IG. Par-3 controls tight junction assembly through the Rac exchange factor Tiam1. Nat Cell Biol. 2005;7:262–269. doi: 10.1038/ncb1226. [DOI] [PubMed] [Google Scholar]
- 4.Mertens AE, Rygiel TP, Olivo C, van der Kammen R, Collard JG. The Rac activator Tiam1 controls tight junction biogenesis in keratinocytes through binding to and activation of the Par polarity complex. J Cell Biol. 2005;170:1029–1037. doi: 10.1083/jcb.200502129. [DOI] [PMC free article] [PubMed] [Google Scholar]
- 5.Nishimura T, Yamaguchi T, Kato K, Yoshizawa M, Nabeshima Y, Ohno S. PAR-6-PAR-3 mediates Cdc42-induced Rac activation through the Rac GEFs STEF/Tiam1. Nat Cell Biol. 2005;7:270–277. doi: 10.1038/ncb1227. [DOI] [PubMed] [Google Scholar]
- 6.Sander EE, van Delft S, ten Klooster JP, Reid T, van der Kammen RA, Michiels F, Collard JG. Matrix-dependent Tiam1/Rac signaling in epithelial cells promotes either cell-cell adhesion or cell migration and is regulated by phosphatidylinositol 3-kinase. J Cell Biol. 1998;143:1385–1398. doi: 10.1083/jcb.143.5.1385. [DOI] [PMC free article] [PubMed] [Google Scholar]
- 7.Hou M, Tan L, Wang X, Zhu YS. Antisense Tiam1 down-regulates the invasiveness of 95D cells in vitro. Acta Biochim Biophys Sin (Shanghai) 2004;36:537–540. doi: 10.1093/abbs/36.8.537. [DOI] [PubMed] [Google Scholar]
- 8.Minard ME, Ellis LM, Gallick GE. Tiam1 regulates cell adhesion, migration and apoptosis in colon tumor cells. Clin Exp Metastasis. 2006;23:301–313. doi: 10.1007/s10585-006-9040-z. [DOI] [PubMed] [Google Scholar]
- 9.Kraemer A, Goodwin M, Verma S, Yap AS, Ali RG. Rac is a dominant regulator of cadherin-directed actin assembly that is activated by adhesive ligation independently of Tiam1. Am J Physiol Cell Physiol. 2007;292:C1061–C1069. doi: 10.1152/ajpcell.00073.2006. [DOI] [PubMed] [Google Scholar]
- 10.Hordijk PL, ten Klooster JP, van der Kammen RA, Michiels F, Oomen LC, Collard JG. Inhibition of invasion of epithelial cells by Tiam1-Rac signaling. Science. 1997;278:1464–1466. doi: 10.1126/science.278.5342.1464. [DOI] [PubMed] [Google Scholar]
- 11.Saras J, Heldin CH. PDZ domains bind carboxy-terminal sequences of target proteins. Trends Biochem Sci. 1996;21:455–458. doi: 10.1016/s0968-0004(96)30044-3. [DOI] [PubMed] [Google Scholar]
- 12.Gonzalez-Mariscal L, Betanzos A, Nava P, Jaramillo BE. Tight junction proteins. Prog Biophys Mol Biol. 2003;81:1–44. doi: 10.1016/s0079-6107(02)00037-8. [DOI] [PubMed] [Google Scholar]
- 13.Kim E, Sheng M. PDZ domain proteins of synapses. Nat Rev Neurosci. 2004;5:771–781. doi: 10.1038/nrn1517. [DOI] [PubMed] [Google Scholar]
- 14.Guillemot L, Paschoud S, Pulimeno P, Foglia A, Citi S. The cytoplasmic plaque of tight junctions: a scaffolding and signalling center. Biochim Biophys Acta. 2008;1778:601–613. doi: 10.1016/j.bbamem.2007.09.032. [DOI] [PubMed] [Google Scholar]
- 15.Feng W, Zhang M. Organization and dynamics of PDZ-domain-related supramodules in the postsynaptic density. Nat Rev Neurosci. 2009;10:87–99. doi: 10.1038/nrn2540. [DOI] [PubMed] [Google Scholar]
- 16.Masuda M, Maruyama T, Ohta T, Ito A, Hayashi T, Tsukasaki K. CADM1 interacts with Tiam1 and promotes invasive phenotype of human T-cell leukemia virus type I (HTLV-I) transformed cells and adult T-cell leukemia (ATL) cells: possible involvement of CADM1 in pathogenesis of ATL. J Biol Chem. 2010 doi: 10.1074/jbc.M109.076653. In the press. [DOI] [PMC free article] [PubMed] [Google Scholar]
- 17.Songyang Z, Fanning AS, Fu C, Xu J, Marfatia SM, Chishti AH. Recognition of unique carboxyl-terminal motifs by distinct PDZ domains. Science. 1997;275:73–77. doi: 10.1126/science.275.5296.73. [DOI] [PubMed] [Google Scholar]
- 18.Tonikian R, Zhang Y, Sazinsky SL, Currell B, Yeh JH, Reva B. A specificity map for the PDZ domain family. PLoS Biol. 2008;6:e239. doi: 10.1371/journal.pbio.0060239. [DOI] [PMC free article] [PubMed] [Google Scholar]
- 19.Chen JR, Chang BH, Allen JE, Stiffler MA, MacBeath G. Predicting PDZ domain-peptide interactions from primary sequences. Nat Biotechnol. 2008;26:1041–1045. doi: 10.1038/nbt.1489. [DOI] [PMC free article] [PubMed] [Google Scholar]
- 20.Stiffler MA, Chen JR, Grantcharova VP, Lei Y, Fuchs D, Allen JE. PDZ domain binding selectivity is optimized across the mouse proteome. Science. 2007;317:364–369. doi: 10.1126/science.1144592. [DOI] [PMC free article] [PubMed] [Google Scholar]
- 21.de Castro E, Sigrist CJ, Gattiker A, Bulliard V, Langendijk-Genevaux PS, Gasteiger E. ScanProsite: detection of PROSITE signature matches and ProRule-associated functional and structural residues in proteins. Nucleic Acids Res. 2006;34:W362–W365. doi: 10.1093/nar/gkl124. [DOI] [PMC free article] [PubMed] [Google Scholar]
- 22.Beauvais DM, Rapraeger AC. Syndecans in tumor cell adhesion and signaling. Reprod Biol Endocrinol. 2004;2:3. doi: 10.1186/1477-7827-2-3. [DOI] [PMC free article] [PubMed] [Google Scholar]
- 23.Xian X, Gopal S, Couchman JR. Syndecans as receptors and organizers of the extracellular matrix. Cell Tissue Res. 2009;339:31–46. doi: 10.1007/s00441-009-0829-3. [DOI] [PubMed] [Google Scholar]
- 24.Spiegel I, Salomon D, Erne B, Schaeren-Wiemers N, Peles E. Caspr3 and caspr4, two novel members of the caspr family are expressed in the nervous system and interact with PDZ domains. Mol Cell Neurosci. 2002;20:283–297. doi: 10.1006/mcne.2002.1110. [DOI] [PubMed] [Google Scholar]
- 25.Fuentes EJ, Gilmore SA, Mauldin RV, Lee AL. Evaluation of energetic and dynamic coupling networks in a PDZ domain protein. J Mol Biol. 2006;364:337–351. doi: 10.1016/j.jmb.2006.08.076. [DOI] [PubMed] [Google Scholar]
- 26.Sulka B, Lortat-Jacob H, Terreux R, Letourneur F, Rousselle P. Tyrosine dephosphorylation of the syndecan-1 PDZ binding domain regulates syntenin-1 recruitment. J Biol Chem. 2009;284:10659–10671. doi: 10.1074/jbc.M807643200. [DOI] [PMC free article] [PubMed] [Google Scholar]
- 27.Habets GG, Scholtes EH, Zuydgeest D, van der Kammen RA, Stam JC, Berns A, Collard JG. Identification of an invasion-inducing gene, Tiam-1, that encodes a protein with homology to GDP-GTP exchangers for Rho-like proteins. Cell. 1994;77:537–549. doi: 10.1016/0092-8674(94)90216-x. [DOI] [PubMed] [Google Scholar]
- 28.Mertens AE, Pegtel DM, Collard JG. Tiam1 takes PARt in cell polarity. Trends Cell Biol. 2006;16:308–316. doi: 10.1016/j.tcb.2006.04.001. [DOI] [PubMed] [Google Scholar]
- 29.Mertens AE, Roovers RC, Collard JG. Regulation of Tiam1-Rac signalling. FEBS Lett. 2003;546:11–16. doi: 10.1016/s0014-5793(03)00435-6. [DOI] [PubMed] [Google Scholar]
- 30.Buchsbaum RJ. Rho activation at a glance. J Cell Sci. 2007;120:1149–1152. doi: 10.1242/jcs.03428. [DOI] [PubMed] [Google Scholar]
- 31.Rossman KL, Der CJ, Sondek J. GEF means go: turning on RHO GTPases with guanine nucleotide-exchange factors. Nat Rev Mol Cell Biol. 2005;6:167–180. doi: 10.1038/nrm1587. [DOI] [PubMed] [Google Scholar]
- 32.Lambert JM, Lambert QT, Reuther GW, Malliri A, Siderovski DP, Sondek J. Tiam1 mediates Ras activation of Rac by a PI(3)K-independent mechanism. Nat Cell Biol. 2002;4:621–625. doi: 10.1038/ncb833. [DOI] [PubMed] [Google Scholar]
- 33.Malliri A, van der Kammen RA, Clark K, van der Valk M, Michiels F, Collard JG. Mice deficient in the Rac activator Tiam1 are resistant to Ras-induced skin tumours. Nature. 2002;417:867–871. doi: 10.1038/nature00848. [DOI] [PubMed] [Google Scholar]
- 34.Yamauchi J, Miyamoto Y, Tanoue A, Shooter EM, Chan JR. Ras activation of a Rac1 exchange factor, Tiam1, mediates neurotrophin-3-induced Schwann cell migration. Proc Natl Acad Sci USA. 2005;102:14889–14894. doi: 10.1073/pnas.0507125102. [DOI] [PMC free article] [PubMed] [Google Scholar]
- 35.Buchsbaum RJ, Connolly BA, Feig LA. Interaction of Rac exchange factors Tiam1 and Ras-GRF1 with a scaffold for the p38 mitogen-activated protein kinase cascade. Mol Cell Biol. 2002;22:4073–4085. doi: 10.1128/MCB.22.12.4073-4085.2002. [DOI] [PMC free article] [PubMed] [Google Scholar]
- 36.Buchsbaum RJ, Connolly BA, Feig LA. Regulation of p70 S6 kinase by complex formation between the Rac guanine nucleotide exchange factor (Rac-GEF) Tiam1 and the scaffold spinophilin. J Biol Chem. 2003;278:18833–18841. doi: 10.1074/jbc.M207876200. [DOI] [PubMed] [Google Scholar]
- 37.Connolly BA, Rice J, Feig LA, Buchsbaum RJ. Tiam1-IRSp53 complex formation directs specificity of rac-mediated actin cytoskeleton regulation. Mol Cell Biol. 2005;25:4602–4614. doi: 10.1128/MCB.25.11.4602-4614.2005. [DOI] [PMC free article] [PubMed] [Google Scholar]
- 38.Tolias KF, Bikoff JB, Burette A, Paradis S, Harrar D, Tavazoie S. The Rac1-GEF Tiam1 couples the NMDA receptor to the activity-dependent development of dendritic arbors and spines. Neuron. 2005;45:525–538. doi: 10.1016/j.neuron.2005.01.024. [DOI] [PubMed] [Google Scholar]
- 39.Kang BS, Cooper DR, Devedjiev Y, Derewenda U, Derewenda ZS. Molecular roots of degenerate specificity in syntenin’s PDZ2 domain: reassessment of the PDZ recognition paradigm. Structure. 2003;11:845–853. doi: 10.1016/s0969-2126(03)00125-4. [DOI] [PubMed] [Google Scholar]
- 40.Birrane G, Chung J, Ladias JA. Novel mode of ligand recognition by the Erbin PDZ domain. J Biol Chem. 2003;278:1399–13402. doi: 10.1074/jbc.C200571200. [DOI] [PubMed] [Google Scholar]
- 41.Feng W, Wu H, Chan LN, Zhang M. Par-3-mediated junctional localization of the lipid phosphatase PTEN is required for cell polarity establishment. J Biol Chem. 2008;283:23440–23449. doi: 10.1074/jbc.M802482200. [DOI] [PubMed] [Google Scholar]
- 42.Kozlov G, Banville D, Gehring K, Ekiel I. Solution structure of the PDZ2 domain from cytosolic human phosphatase hPTP1E complexed with a peptide reveals contribution of the beta2-beta3 loop to PDZ domain-ligand interactions. J Mol Biol. 2002;320:813–820. doi: 10.1016/s0022-2836(02)00544-2. [DOI] [PubMed] [Google Scholar]
- 43.Tyler RC, Peterson FC, Volkman BF. Distal interactions within the par3-VE-cadherin complex. Biochemistry. 2010;49:951–957. doi: 10.1021/bi9017335. [DOI] [PMC free article] [PubMed] [Google Scholar]
- 44.David G. Integral membrane heparan sulfate proteoglycans. FASEB J. 1993;7:1023–1030. doi: 10.1096/fasebj.7.11.8370471. [DOI] [PubMed] [Google Scholar]
- 45.Kim CW, Goldberger OA, Gallo RL, Bernfield M. Members of the syndecan family of heparan sulfate proteoglycans are expressed in distinct cell-, tissue-, and development-specific patterns. Mol Biol Cell. 1994;5:797–805. doi: 10.1091/mbc.5.7.797. [DOI] [PMC free article] [PubMed] [Google Scholar]
- 46.Morgan MR, Humphries MJ, Bass MD. Synergistic control of cell adhesion by integrins and syndecans. Nat Rev Mol Cell Biol. 2007;8:957–969. doi: 10.1038/nrm2289. [DOI] [PMC free article] [PubMed] [Google Scholar]
- 47.Mythreye K, Blobe GC. Proteoglycan signaling co-receptors: roles in cell adhesion, migration and invasion. Cell Signal. 2009;21:1548–1558. doi: 10.1016/j.cellsig.2009.05.001. [DOI] [PMC free article] [PubMed] [Google Scholar]
- 48.Gao Y, Li M, Chen W, Simons M. Synectin, syndecan-4 cytoplasmic domain binding PDZ protein, inhibits cell migration. J Cell Physiol. 2000;184:373–379. doi: 10.1002/1097-4652(200009)184:3<373::AID-JCP12>3.0.CO;2-I. [DOI] [PubMed] [Google Scholar]
- 49.Tkachenko E, Elfenbein A, Tirziu D, Simons M. Syndecan-4 clustering induces cell migration in a PDZ-dependent manner. Circ Res. 2006;98:1398–1404. doi: 10.1161/01.RES.0000225283.71490.5a. [DOI] [PubMed] [Google Scholar]
- 50.Ethell IM, Hagihara K, Miura Y, Irie F, Yamaguchi Y. Synbindin, A novel syndecan-2-binding protein in neuronal dendritic spines. J Cell Biol. 2000;151:53–68. doi: 10.1083/jcb.151.1.53. [DOI] [PMC free article] [PubMed] [Google Scholar]
- 51.Cohen AR, Woods DF, Marfatia SM, Walther Z, Chishti AH, Anderson JM. Human CASK/LIN-2 binds syndecan-2 and protein 4.1 and localizes to the basolateral membrane of epithelial cells. J Cell Biol. 1998;142:129–138. doi: 10.1083/jcb.142.1.129. [DOI] [PMC free article] [PubMed] [Google Scholar]
- 52.Hsueh YP, Sheng M. Regulated expression and subcellular localization of syndecan heparan sulfate proteoglycans and the syndecan-binding protein CASK/LIN-2 during rat brain development. J Neurosci. 1999;19:7415–7425. doi: 10.1523/JNEUROSCI.19-17-07415.1999. [DOI] [PMC free article] [PubMed] [Google Scholar]
- 53.Hsueh YP, Yang FC, Kharazia V, Naisbitt S, Cohen AR, Weinberg RJ, Sheng M. Direct interaction of CASK/LIN-2 and syndecan heparan sulfate proteoglycan and their overlapping distribution in neuronal synapses. J Cell Biol. 1998;142:139–151. doi: 10.1083/jcb.142.1.139. [DOI] [PMC free article] [PubMed] [Google Scholar]
- 54.Grootjans JJ, Zimmermann P, Reekmans G, Smets A, Degeest G, Durr J, David G. Syntenin, a PDZ protein that binds syndecan cytoplasmic domains. Proc Natl Acad Sci USA. 1997;94:13683–13688. doi: 10.1073/pnas.94.25.13683. [DOI] [PMC free article] [PubMed] [Google Scholar]
- 55.Zimmermann P, Tomatis D, Rosas M, Grootjans J, Leenaerts I, Degeest G. Characterization of syntenin, a syndecan-binding PDZ protein, as a component of cell adhesion sites and microfilaments. Mol Biol Cell. 2001;12:339–350. doi: 10.1091/mbc.12.2.339. [DOI] [PMC free article] [PubMed] [Google Scholar]
- 56.Zimmermann P, Zhang Z, Degeest G, Mortier E, Leenaerts I, Coomans C. Syndecan recycling is controlled by syntenin-PIP2 interaction and Arf6. Dev Cell. 2005;9:377–388. doi: 10.1016/j.devcel.2005.07.011. [DOI] [PubMed] [Google Scholar]
- 57.Okina E, Manon-Jensen T, Whiteford JR, Couchman JR. Syndecan proteoglycan contributions to cytoskeletal organization and contractility. Scand J Med Sci Sports. 2009;19:479–489. doi: 10.1111/j.1600-0838.2009.00941.x. [DOI] [PubMed] [Google Scholar]
- 58.Lambaerts K, Wilcox-Adelman SA, Zimmermann P. The signaling mechanisms of syndecan heparan sulfate proteoglycans. Curr Opin Cell Biol. 2009;21:662–669. doi: 10.1016/j.ceb.2009.05.002. [DOI] [PMC free article] [PubMed] [Google Scholar]
- 59.Dovas A, Yoneda A, Couchman JR. PKCbeta-dependent activation of RhoA by syndecan-4 during focal adhesion formation. J Cell Sci. 2006;119:2837–2846. doi: 10.1242/jcs.03020. [DOI] [PubMed] [Google Scholar]
- 60.Bass MD, Roach KA, Morgan MR, Mostafavi-Pour Z, Schoen T, Muramatsu T. Syndecan-4-dependent Rac1 regulation determines directional migration in response to the extracellular matrix. J Cell Biol. 2007;177:527–538. doi: 10.1083/jcb.200610076. [DOI] [PMC free article] [PubMed] [Google Scholar]
- 61.Elfenbein A, Rhodes JM, Meller J, Schwartz MA, Matsuda M, Simons M. Suppression of RhoG activity is mediated by a syndecan 4-synectin-RhoGDI1 complex and is reversed by PKCalpha in a Rac1 activation pathway. J Cell Biol. 2009;186:75–83. doi: 10.1083/jcb.200810179. [DOI] [PMC free article] [PubMed] [Google Scholar]
- 62.Park H, Han I, Kwon HJ, Oh ES. Focal adhesion kinase regulates syndecan-2-mediated tumorigenic activity of HT1080 fibrosarcoma cells. Cancer Res. 2005;65:9899–9905. doi: 10.1158/0008-5472.CAN-05-1386. [DOI] [PubMed] [Google Scholar]
- 63.Choi Y, Kim H, Chung H, Hwang JS, Shin JA, Han IO, Oh ES. Syndecan-2 regulates cell migration in colon cancer cells through Tiam1-mediated Rac activation. Biochem Biophys Res Commun. 2010;391:921–925. doi: 10.1016/j.bbrc.2009.11.165. [DOI] [PubMed] [Google Scholar]
- 64.Maday S, Anderson E, Chang HC, Shorter J, Satoh A, Sfakianos J. A PDZ-binding motif controls basolateral targeting of syndecan-1 along the biosynthetic pathway in polarized epithelial cells. Traffic. 2008;9:1915–1924. doi: 10.1111/j.1600-0854.2008.00805.x. [DOI] [PMC free article] [PubMed] [Google Scholar]
- 65.Rapraeger A, Jalkanen M, Bernfield M. Cell surface proteoglycan associates with the cytoskeleton at the basolateral cell surface of mouse mammary epithelial cells. J Cell Biol. 1986;103:2683–2696. doi: 10.1083/jcb.103.6.2683. [DOI] [PMC free article] [PubMed] [Google Scholar]
- 66.Svennevig K, Prydz K, Kolset SO. Proteoglycans in polarized epithelial Madin-Darby canine kidney cells. Biochem J. 1995;311:881–888. doi: 10.1042/bj3110881. [DOI] [PMC free article] [PubMed] [Google Scholar]
- 67.Leppa S, Vleminckx K, Van Roy F, Jalkanen M. Syndecan-1 expression in mammary epithelial tumor cells is E-cadherin-dependent. J Cell Sci. 1996;109:1393–1403. doi: 10.1242/jcs.109.6.1393. [DOI] [PubMed] [Google Scholar]
- 68.Sun D, McAlmon KR, Davies JA, Bernfield M, Hay ED. Simultaneous loss of expression of syndecan-1 and E-cadherin in the embryonic palate during epithelial-mesenchymal transformation. Int J Dev Biol. 1998;42:733–736. [PubMed] [Google Scholar]
- 69.Loussouarn D, Campion L, Sagan C, Frenel JS, Dravet F, Classe JM. Prognostic impact of syndecan-1 expression in invasive ductal breast carcinomas. Br J Cancer. 2008;98:1993–1998. doi: 10.1038/sj.bjc.6604400. [DOI] [PMC free article] [PubMed] [Google Scholar]
- 70.Contreras HR, Ledezma RA, Vergara J, Cifuentes F, Barra C, Cabello P, et al. The expression of syndecan-1 and -2 is associated with Gleason score and epithelial-mesenchymal transition markers, E-cadherin and beta-catenin, in prostate cancer. Urol Oncol. 2009 doi: 10.1016/j.physletb.2003.10.071. In the press. [DOI] [PubMed] [Google Scholar]
- 71.Beauvais DM, Burbach BJ, Rapraeger AC. The syndecan-1 ectodomain regulates alphav-beta3 integrin activity in human mammary carcinoma cells. J Cell Biol. 2004;167:171–181. doi: 10.1083/jcb.200404171. [DOI] [PMC free article] [PubMed] [Google Scholar]
- 72.Fears CY, Woods A. The role of syndecans in disease and wound healing. Matrix Biol. 2006;25:443–456. doi: 10.1016/j.matbio.2006.07.003. [DOI] [PubMed] [Google Scholar]
- 73.Gotte M, Kersting C, Ruggiero M, Tio J, Tulusan AH, Kiesel L, Wulfing P. Predictive value of syndecan-1 expression for the response to neoadjuvant chemotherapy of primary breast cancer. Anticancer Res. 2006;26:621–627. [PubMed] [Google Scholar]
- 74.Shimada K, Nakamura M, De Velasco MA, Tanaka M, Ouji Y, Konishi N. Syndecan-1, a new target molecule involved in progression of androgen-independent prostate cancer. Cancer Sci. 2009;100:1248–1254. doi: 10.1111/j.1349-7006.2009.01174.x. [DOI] [PMC free article] [PubMed] [Google Scholar]
- 75.Marley J, Lu M, Bracken C. A method for efficient isotopic labeling of recombinant proteins. J Biomol NMR. 2001;20:71–75. doi: 10.1023/a:1011254402785. [DOI] [PubMed] [Google Scholar]
- 76.Laue T, Shah B, Ridgeway T, Pelletier S. In: Analytical Ultracentrifugation in Biochemistry and Polymer Science. Harding S, Rowe A, Horton J, editors. Royal Society of Chemistry; Cambridge, UK: 1992. pp. 90–125. [Google Scholar]
- 77.Pflugrath JW. The finer things in X-ray diffraction data collection. Acta Crystallogr D. 1999;55:1718–1725. doi: 10.1107/s090744499900935x. [DOI] [PubMed] [Google Scholar]
- 78.Vagin A, Teplyakov A. MOLREP: an automated program for molecular replacement. J Appl Crystallogr. 1997;30:1022–1025. [Google Scholar]
- 79.Lamzin VS, Wilson KS. Automated refinement of protein models. Acta Crystallogr D. 1993;49:129–147. doi: 10.1107/S0907444992008886. [DOI] [PubMed] [Google Scholar]
- 80.Perrakis A, Sixma TK, Wilson KS, Lamzin VS. wARP: improvement and extension of crystallographic phases by weighted averaging of multiple-refined dummy atomic models. Acta Crystallogr D. 1997;53:448–455. doi: 10.1107/S0907444997005696. [DOI] [PubMed] [Google Scholar]
- 81.Adams PD, Gopal K, Grosse-Kunstleve RW, Hung LW, Ioerger TR, McCoy AJ. Recent developments in the PHENIX software for automated crystallographic structure determination. J Synchrotron Radiat. 2004;11:53–55. doi: 10.1107/s0909049503024130. [DOI] [PubMed] [Google Scholar]
- 82.Adams PD, Grosse-Kunstleve RW, Hung LW, Ioerger TR, McCoy AJ, Moriarty NW. PHENIX: building new software for automated crystallographic structure determination. Acta Crystallogr D. 2002;58:1948–1954. doi: 10.1107/s0907444902016657. [DOI] [PubMed] [Google Scholar]
- 83.Emsley P, Cowtan K. Coot: model-building tools for molecular graphics. Acta Crystallogr D. 2004;60:2126–2132. doi: 10.1107/S0907444904019158. [DOI] [PubMed] [Google Scholar]
- 84.Brunger AT. Free R value: a novel statistical quantity for assessing the accuracy of crystal structures. Nature. 1992;355:472–475. doi: 10.1038/355472a0. [DOI] [PubMed] [Google Scholar]
- 85.Kabsch W, Sander C. Dictionary of protein secondary structure: pattern recognition of hydrogen-bonded and geometrical features. Biopolymers. 1983;22:2577–2637. doi: 10.1002/bip.360221211. [DOI] [PubMed] [Google Scholar]
- 86.Davis IW, Leaver-Fay A, Chen VB, Block JN, Kapral GJ, Wang X. MolProbity: all-atom contacts and structure validation for proteins and nucleic acids. Nucleic Acids Res. 2007;35:W375–W383. doi: 10.1093/nar/gkm216. [DOI] [PMC free article] [PubMed] [Google Scholar]
- 87.Fraczkiewicz R, Braun W. Exact and efficient analytical calculation of the accessible surface areas and their gradients for macromolecules. J Comput Chem. 1998;19:319–333. [Google Scholar]
- 88.Delaglio F, Grzesiek S, Vuister GW, Zhu G, Pfeifer J, Bax A. NMRPipe: a multidimensional spectral processing system based on UNIX pipes. J Biomol NMR. 1995;6:277–293. doi: 10.1007/BF00197809. [DOI] [PubMed] [Google Scholar]
- 89.Goddard T, Kneller D. SPARKY 3. San Fransico: Univeristy of California; 2007. [Google Scholar]
- 90.Bahrami A, Assadi AH, Markley JL, Eghbalnia HR. Probabilistic interaction network of evidence algorithm and its application to complete labeling of peak lists from protein NMR spectroscopy. PLoS Comput Biol. 2009;5:e1000307. doi: 10.1371/journal.pcbi.1000307. [DOI] [PMC free article] [PubMed] [Google Scholar]
- 91.Lee W, Westler WM, Bharami A, Eghbalnia HR, Markley JL. PINE-SPARKY: graphical interface for evaluating automated probabilistic peak assignments in protein NMR spectroscopy. Bioinformatics. 2009;25:2085–2087. doi: 10.1093/bioinformatics/btp345. [DOI] [PMC free article] [PubMed] [Google Scholar]
- 92.Lian L, Roberts GCK. Effects of chemical exchange on NMR spectra. In: Roberts GCK, editor. NMR of Macromolecules A Practical Approach. Oxford University Press; Oxford, UK: 1993. [Google Scholar]
- 93.Bollag G, Crompton AM, Peverly-Mitchell D, Habets GG, Symons M. Activation of Rac1 by human Tiam1. Methods Enzymol. 2000;325:51–61. doi: 10.1016/s0076-6879(00)25430-x. [DOI] [PubMed] [Google Scholar]
- 94.Vriend G. WHAT IF: a molecular modeling and drug design program. J Mol Graph. 1990;8:52–56. doi: 10.1016/0263-7855(90)80070-v. [DOI] [PubMed] [Google Scholar]
Associated Data
This section collects any data citations, data availability statements, or supplementary materials included in this article.