

Abstract
Delayed graft function (DGF) complicates kidney allograft outcomes in the immediate post-transplantation period. We hypothesized that in hemodialysis patients, high pre-transplant body mass index (BMI) is associated with higher risk of DGF.
Linking 5-year hemodialysis patient data of a large dialysis organization to the Scientific Registry of Transplant Recipients, we identified 11,836 hemodialysis patients who underwent kidney transplantation during 7/2001-6/2007. We conducted multivariate logistic regression analyses to assess the association between pre-transplant BMI and post-transplant DGF.
Patients were 49±14 (mean±SD) years old, had a BMI of 26.8±6.0 kg/m2, and included 38% women, 27% Blacks and 26% diabetics. After adjusting for relevant covariates, pre-transplant BMI remained an independent predictor of DGF. One SD increase in pre-transplant BMI was associated with a 35% higher risk of DGF (OR=1.35; 95% confidence interval [CI]: 1.27-1.44). Compared to patients with pre-transplant BMI of 22-24.99 kg/m2, patient with overweight (BMI 25-29.99 kg/m2), mild obesity (BMI 30-34.99 kg/m2) and moderate to severe obesity (BMI>=35 kg/m2) had 30%, 42% and 118% higher risks of DGF, respectively (p<0.05). Similar associations were observed in all patients subgroups.
Pre-transplant overweight/obesity is associated with incrementally higher risk of DGF.
Keywords: Pre-transplant weight, delayed graft function, kidney transplantation, obesity, overweight, body mass index, overnutrition, weight reduction
Introduction
Delayed graft function (DGF) is a well-known complication affecting kidney allograft outcomes in the immediate post-transplantation period and is defined as the need for at least one session of dialysis treatment in the first week after receiving a kidney transplant,[1] DGF is attributed to ischemia-reperfusion and immunological injury of the graft.[2] The prevalence of DGF varies from 4% to 10% in living donor [2] and 5% to 50% in deceased donor kidney transplants.[3-7] The occurrence of DGF may significantly complicate the immediate post-transplant management by increasing morbidity and mortality,[8, 9] prolonging patient hospitalization [10] and inflating health care costs.[10-12]
Overweight (body mass index [BMI] 25-<30 kg/m2) and obesity (BMI>30 kg/m2) at the time of kidney transplantation are common among North American dialysis patients.[13] Some studies report poorer long-term post-kidney transplant outcomes in obese dialysis patients [14-17] mainly due to cardiovascular complications,[18] whereas other studies have found no association between pre-transplant BMI and long-term post-transplant outcomes,[19-22] including our recent study in10,090 kidney transplant recipients.[23] In contrast, pre-transplant obesity is usually associated with such untoward short-term complications as surgical wound infections or dehiscence.[24] More recent studies report that obese renal transplant recipients have higher risk of developing diabetes mellitus or diverse post-operative complications.[19, 22, 24-26] However, it is not known whether overweight or obesity has a negative impact on other short-term complications in particular DGF. To the best of our knowledge, only a small case-control study (n=80) by Espejo et al showed that obese patients have higher risk of DGF after kidney transplantation,[27] whereas Yamamoto et al. (n=28) found no meaningful association between obesity and DGF.[28] Obesity is associated with higher sympathetic activity,[29, 30] which, along with imminent administration of calcineurin inhibitors may lead to renal vasoconstriction and decreased kidney perfusion, resulting in DGF. Moreover, obesity is associated with longer operative time and longer ischemic time,[31] which is associated with elevated risk of DGF.[32, 33] Given these biologically plausible hypotheses and the foregoing inconsistent data, we sought to examine whether recipients’ high BMI has a bearing on early post-transplant graft function in a large and contemporary, incident cohort of kidney transplant recipients throughout the United States. We hypothesized that higher pre-transplant BMI during the months immediately prior to kidney transplantation is associated with higher prevalence of DGF in post-transplant patient.
Results
The original 5-year (07/2001-06/2006) national database of all DaVita dialysis patients included 164,789 adult subjects. This database was linked via unique identifiers to the national SRTR registry that included all transplant waitlisted people and kidney transplant recipients until 06/2007 (Figure 1). Out of 37,766 DaVita dialysis patients who were identified in the SRTR database 17,629 had undergone one or more kidney transplantations during their life time, including 14,508 patients who had undergone their first kidney transplantation between 7/2001 and 7/2007. After excluding those without electronically recorded data (n=1), peritoneal dialysis patients (n=2092) subjects who lacked data from the baseline quarter or those with outlier values for age (> 99 or <16 years; n=579), there were 11,836 hemodialysis patients who met all inclusion and exclusion criteria and who subsequently underwent their first kidney transplantation during the observation period.
Figure 1.
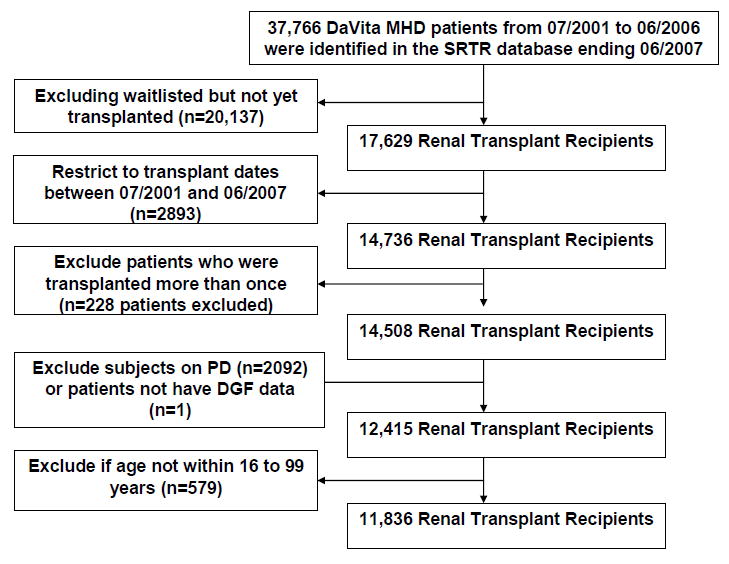
Flow chart of the patient selection (see text)
Table 1 compares the demographic, clinical, transplant related and pre-transplant laboratory characteristics of the patients with (n=2628) and without (n=9208) DGF. Patients with DGF were 2 years older and more likely to be diabetic or African-American or to have Medicare as their primary insurance. Patients with DGF had lower serum albumin and hemoglobin levels and were more likely to receive kidneys from deceased donors with longer cold ischemic time. Additionally, patients with DGF had a higher pre-transplant BMI by 1.2 kg/m2 than those without DGF (Table 1).
Table 1.
Demographic, clinical and laboratory characteristics for 11,836 long-term hemodialysis patients who received kidney transplants. Data are from the last or second to last calendar quarter prior to transplantation. Values are in percentage or mean ± SD or median (IQR), as appropriate
| Variables | All | With DGF | Without DGF | p-value |
|---|---|---|---|---|
| N (%) | 11,836 (100) | 2,628 (22.2) | 9,208 (77.8) | N/A |
| Age (years) | 49±14 | 50±13 | 48±14 | <0.001 |
| Gender (% women) | 38 | 34 | 39 | <0.001 |
| Diabetes mellitus (%) | 26 | 29 | 26 | <0.001 |
| Race/Ethnicity (%) | ||||
| Whites | 46 | 39 | 48 | <0.001 |
| African Americans | 27 | 35 | 25 | <0.001 |
| Hispanics | 14 | 14 | 14 | 0.85 |
| Asians | 4 | 3 | 4 | 0.01 |
| Dialysis vintage time (%): | ||||
| <6 months | 12 | 6 | 14 | <0.001 |
| 6-24 months | 28 | 19 | 31 | <0.001 |
| 2-5 years | 36 | 41 | 35 | <0.001 |
| >5 years | 24 | 34 | 21 | <0.001 |
| Primary insurance (%) | ||||
| Medicare | 52 | 59 | 50 | <0.001 |
| Medicaid | 3 | 3 | 3 | 0.47 |
| Private Insurance | 16 | 14 | 17 | 0.003 |
| Other | 20 | 14 | 22 | <0.001 |
| Marital Status (%) | ||||
| Married | 47 | 46 | 48 | 0.26 |
| Divorced | 6 | 6 | 6 | 0.65 |
| Single | 27 | 28 | 27 | 0.17 |
| Widowed | 3 | 3 | 3 | 0.98 |
| BMI (kg/m2) | 26.8±6.0 | 28.0±6.7 | 26.4±5.7 | <0.001 |
| Kt/V (dialysis dose) | 1.61±0.35 | 1.60±0.33 | 1.62±0.36 | 0.055 |
| nPCR (g/kg/day) | 1.05±0.25 | 1.06±0.25 | 1.05±0.26 | 0.01 |
| Serum albumin (g/dL) | 4.02±0.37 | 4.00±0.37 | 4.03±0.38 | <0.001 |
| creatinine (mg/dL) | 10.6±3.2 | 11.1±3.1 | 10.5±3.2 | <0.001 |
| bicarbonate (mg/dL) | 21.9±3.4 | 22.2±3.3 | 21.8±3.4 | <0.001 |
| TIBC (mg/dL) | 212±40 | 208±39 | 213±41 | <0.001 |
| ferritin (ng/mL) * | 469 (249-731) | 534 (299-786) | 448 (236-717) | <0.001 |
| phosphorus (mg/dL) | 5.95±1.54 | 5.97±1.57 | 5.94±1.53 | 0.41 |
| calcium (mg/dL) | 9.43±0.74 | 9.42±0.77 | 9.44±0.73 | 0.23 |
| Blood hemoglobin (g/dL) | 12.3±1.2 | 12.2±1.3 | 12.3±1.2 | 0.001 |
| WBC (×103/l) | 6.8±2.0 | 6.9±2.1 | 6.8±2.1 | 0.24 |
| Lymphocyte (%total WBC) | 23±8 | 23±8 | 23±8 | 0.22 |
| Pre-transplant transfusion (%) | 31 | 36 | 30 | <0.001 |
| Number of HLA mismatch * | 4 (3-5) | 4 (2-5) | 4 (3-5) | <0.001 |
| PRA (%) * | 0 (0-3) | 0 (0-4) | 0 (0-3) | 0.21 |
| Cold Ischemia time (hours) * | 14 (4-22) | 19 (12-25) | 12 (2-20) | <0.001 |
| EDC kidney (%) | 19 | 23 | 17 | <0.001 |
| Donor type (% Living) | 32 | 10 | 38 | <0.001 |
| Donor age (years) | 39±15 | 42±15 | 38±15 | <0.001 |
BMI: body mass index, EDC: Extended Donor Criteria, HLA: human leukocyte antigen, TIBC: total iron binding capacity; nPNA: normalized protein nitrogen appearance, PRA: panel reactive antibody (last value prior to transplant), WBC: white blood cell.
median (IQR)
Table 2 shows the results of multivariate logistic regression analyses. Pre-transplant BMI was an important predictor of DGF in univariate analysis. One standard deviation (SD=6.0 kg/m2) increase of pre-transplant BMI was associated with 30% higher risk of DGF (OR=1.30; 95%CI: 1.24-1.36). The association between pre-transplant BMI and the risk of DGF in the entire cohort are shown in Figure 2 and Figure S1 in the Appendix. After adjusting for case-mix and MICS variables, pre-transplant BMI remained an independent and significant predictor of DGF (Table 2). This association remained significant after adjusting for transplant related variables: one SD increase of pre-transplant BMI was associated with a 35% higher risk of DGF (OR=1.35; 95%CI: 1.27-1.45). Compared to patients with pre-transplant with BMI in high normal range (22-24.99 kg/m2) the patient groups with overweight (25-29.99 kg/m2,) mild obesity (30-34.99 kg/m2,) and moderate to severe obesity (>=35 kg/m2) had 30%, 42% and 118% higher risk of DGF in the fully adjusted model (p<0.05) (Figure 2). Patients with pre-transplant BMI higher than 35 kg/m2 had 87% higher risks of DGF than individuals with pre-transplant BMI lower than 35 kg/m2 (OR=1.87; 95%CI: 1.52-2.30). Qualitative similar results were found when different cut-off points for BMI were used (Table 2). The association of BMI with DGF was monotonously incremental when BMI was modeled as a continuous variable and using fractional polynomials and cubic splines (Figure S1). These associations persist in sensitivity analyses including after inclusion of peritoneal dialysis patients (Figure S2).
Table 2.
Multivariage logistic regression models showing pre-transplant weight and BMI and their Odds Rations and 95% CI for delayed graft function
| Pre-transplant weight | Unadjusted | Case-mix adjusted* | Case-mix & MICS adjusted** | Case-mix & MICS & Transplant data adjusted *** | ||||
|---|---|---|---|---|---|---|---|---|
| OR (95% CI) | P-value | OR (95% CI) | P-value | OR (95% CI) | P-value | OR (95% CI) | P-value | |
| Weight (kg) (+1 Standard Deviation) | 1.29 (1.24-1.35) | <0.001 | 1.32 (1.25-1.39) | <0.001 | 1.33 (1.25-1.41) | <0.001 | 1.34 (1.26-1.44) | <0.001 |
| BMI (kg/m2) (+1 Standard Deviation) | 1.30 (1.24-1.36) | <0.001 | 1.29 (1.23-1.36) | <0.001 | 1.33 (1.26-1.41) | <0.001 | 1.35 (1.27-1.44) | <0.001 |
| BMI>25(kg/m2) vs BMI<=25 (kg/m2) (ref.) | 1.48 (1.44-1.75) | <0.001 | 1.53 (1.38-1.69) | <0.001 | 1.53 (1.37-1.72) | <0.001 | 1.57 (1.39-1.79) | <0.001 |
| BMI>30(kg/m2) vs BMI<=30 (kg/m2) (ref.) | 1.54 (1.39-1.71) | <0.001 | 1.51 (1.35-1.68) | <0.001 | 1.50 (1.33-1.69) | <0.001 | 1.48 (1.30-1.70) | <0.001 |
| BMI>35(kg/m2) vs BMI<=35 (kg/m2) (ref.) | 1.78 (1.53-2.08) | <0.001 | 1.82 (1.55-2.13) | <0.001 | 1.84 (1.53-2.21) | <0.001 | 1.87 (1.52-2.30) | <0.001 |
| BMI>40 (kg/m2) vs BMI<=40 (kg/m2) (ref.) | 2.25 (1.72-2.96) | <0.001 | 2.34 (1.77-3.10) | <0.001 | 2.51 (1.80-3.50) | <0.001 | 2.78 (1.88-4.12) | <0.001 |
Figure 2.
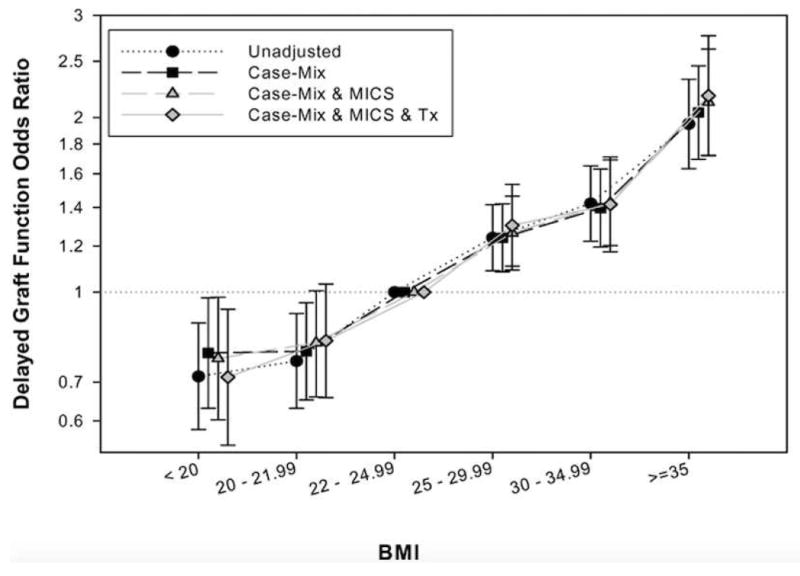
Multivariate analysis of logistic regression models showing pre-transplant BMI and OR (and 95% CI as error bars) of delayed graft function in four different models (Reference: BMI 22-<25 kg/m2)
Similar associations were observed in all subgroups. Figure 3 shows fully adjusted OR (and 95%CI) of DGF associated with each SD higher pre-transplant BMI across various patient subgroups. The OR of DGF across all examined subgroups was greater than one, indicating a higher risk. Most interaction tests did not exhibit small p-values indicating lack of major effect modification by the examined characteristics, except for diabetes and EDC. The association between pre-transplant BMI and DGF was stronger in non-diabetic patients and in recipients of an EDC kidney (Table S1). Of note, in deceased donor subgroup each SD increase of BMI was associated with 36 % risk of DGF (OR (95% CI): 1.36 (1.26-1.46)). In living donor subgroup each SD increase of BMI associated with 33 % (OR (95% CI): 1.33 (1.14-1.56)) risk of DGF. The interaction term was not significant (p=0.88) (Table S1).
Figure 3.
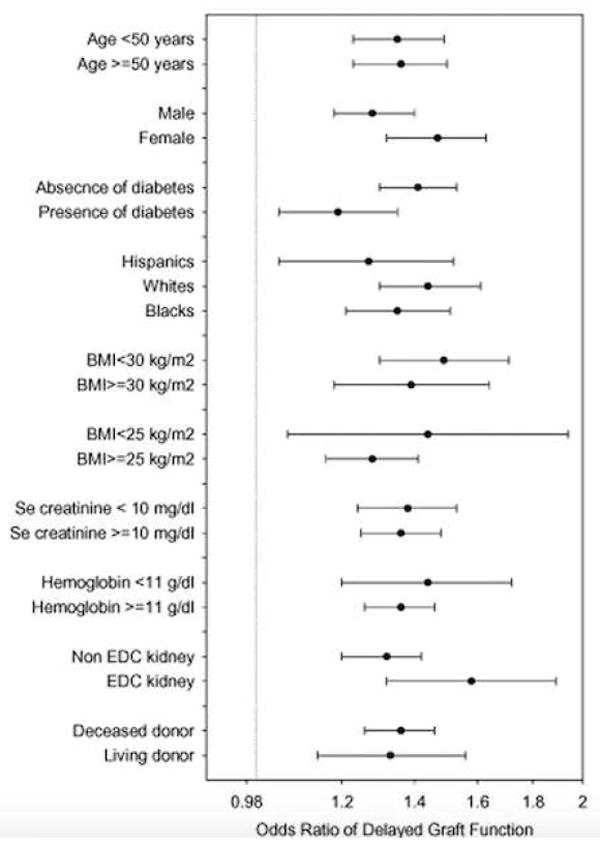
Multivariate analysis of fully adjusted (for case-mix, MICS and transplant covariates) logistic regression models showing pre-transplant BMI and OR (and 95% CI as error bars) of delayed graft function for each standard deviation higher BMI in different sub-group of patients
Discussion
In 11,836 kidney transplant recipients with comprehensive pre- and post-transplant data, higher pre-transplant BMI during the last calendar quarter of hemodialysis treatment was associated with higher risk of DGE during the first post-transplant week. Compared to patients with pre-transplant BMI between 22-24.99 kg/m2, the overweight and obese patients with higher pre-transplant BMI (25-29.99 kg/m2, 30-34.99 kg/m2, and >=35 kg/m2) had incrementally higher risk, i.e., 30%, 42% and 118% higher risk of DGF, whereas lower BMI <22 kg/m2 tended to show approximately 25% lower DGF risk. The associations between pre-transplant BMI and DGF were rather consistent across diverse demographic, clinical and laboratory subgroups. These finding may have important implications for pre-transplant management of waitlisted patients.
DGF is a common short-term post-transplant complication and occurs in 5% to 50% of all kidney transplant recipients. It is especially more frequent with deceased donor kidneys.[3-6] The well known deleterious effects of DGF in the immediate post-transplant period are multiple and include complications of the immediate post-transplant patient care in the hospital. However, there may be even long-term impact of DGF. Most,[34, 35] but not all[36, 37] studies report an association between DGF and reduced long-term graft survival rate. A systematic review reported that DGF is associated with a 41% increased risk of graft loss,[8] 38% increased risk of acute rejection in the first year and a higher serum creatinine concentration at 3.5 years of follow-up.[8]
Overweight and obesity are highly prevalent at the time of kidney transplantation.[13] Previous reports have described conflicting associations between BMI and various outcomes in kidney transplant recipients. Early studies showed higher risk of post-operative complications[31] and early surgical wound infections[24] in obese patients. Lentine et al. reported higher incidence of cardiovascular event including heart failure and atrial fibrillation and early postoperative complications in obese versus non-obese patients.[18] Several other studies, however, did not find any association between pre-transplant BMI and mortality.[19, 21, 22] Chang et al. reported that obesity per se was not associated with poorer kidney transplant outcomes, although it was associated with factors that led to poorer graft and patient survival.[38] Indeed, patients with a BMI ≥30 receiving single pediatric kidneys had better death-censored graft survival rates when compared to non-obese patients.[39] Zaydfudim et al. reported that pre-transplant overweight and obese status did not affect physical quality of life after kidney transplantation.[40]
In our study the association between pre-transplant BMI and the risk of DGF was rather linear, incremental, consistent across virtually subgroups and robust even after adjusting for several important confounders. Only few studies examined the association between BMI and DGF and found conflicting or equivocal results. A small case-control study (n=80) showed the obese patients have higher risk of DGF after kidney transplantation,[27] whereas Yamamoto et al.(n=28) found no association between obesity and DGF.[28] These studies were likely underpowered and used an inconsistent definitions of DGF.
Several potential mechanisms may contribute to the observed associations. A biologically plausible explanation is that obesity is associated with longer operative time of longer and warm ischemic time,[31] which are per se risk factors of DGF.[32, 33] Obesity is associated with high sympathetic activity,[29, 30] which results in renal vasoconstriction. Moreover the prompt administration of calcineurin inhibitors after transplantation, probably in higher doses given overweight or obesity, may aggravate vasoconstriction and further compromise graft perfusion, increasing the risk of DGF. Another potential explanation is the linkage between obesity and increased pro-thrombotic activity and endothelial dysfunction.[41] Body fat mass, in particular central obesity, is associated with higher levels of thrombin generation. [42, 43] Obesity is also a risk factor for venous thrombo-embolic disease. [44] Increased pro-thrombotic activity and endothelial dysfunction may contribute to the risk of graft micro-thrombosis,[45] which per se may play an important role in DGF.[46]
There are potential limitations to our study. Like all observational studies, ours too cannot prove causality. Patients who were excluded from analyses were likely different from the included ones, but their proportion was relatively small. In the SRTR dataset more detailed data about immunosuppression therapy such as calcineurin inhibitor dose or blood level or the induction therapy, which may also have an effect on the risk of DGF, do not exist. Additional limitation is the uncertainty about the use of BMI as a measure of obesity. BMI per se may not be an appropriate measure to characterize nutritional status, body composition, obesity or muscle mass in dialysis patients.[47-52] To better characterize nutritional status, additional parameters such as waist circumference would be needed.[48, 50-52] To the best of our knowledge our study is the first examining the association between pre-transplant BMI and immediate post-transplant DGF in such a large and nationally representative patient population. Other strengths of our study include the high number of patients, the multilevel adjustments including for laboratory data, and the contemporary nature of the cohort (2001-20017).
Conclusions
In our large and contemporary national cohort of 11,836 kidney transplant recipients, pre-transplant BMI is associated with risk of DGF even after extensive multivariate adjustment. The association between pre-transplant BMI and DGF was consistent in all examined subgroups. Despite data indicating an obesity paradox with greater survival of overweight and obese hemodialysis patients,[47, 49, 53, 54] careful trials of closely supervised weight reduction may be indicated to examine whether immediate post-transplant outcomes including risk of DGF can be improved.
Methods
Patients
We linked data on all kidney transplant recipients listed in the Scientific Registry of Transplant Recipients (SRTR) up until June 2007 to a list of individuals with chronic kidney disease stage 5D, who underwent maintenance hemodialysis (MHD) treatment from July 2001 to June 2006 in one of the outpatient dialysis facilities of a US-based large dialysis organization (DaVita Inc, prior to its acquisition of former Gambro dialysis facilities). The study was approved by the Institutional Review Committees of both Los Angeles Biomedical Research Institute at Harbor-UCLA and DaVita Clinical Research. The study was conforming to the principles of the Declaration of Helsinki. Because of the large sample size, the anonymity of the patients studied and the non-intrusive nature of the research the requirement for informed consent was waived.
Clinical and Demographic Measures
The creation of the national DaVita MHD patient cohort has been described previously.[51, 54-57] Demographic data and details of medical history were collected, including information on age, gender, race, type of insurance, marital status, presence of diabetes, height, post-hemodialysis dry weight (to calculate averaged body mass index [BMI]) and dialysis vintage. Dialysis vintage was defined as the duration of time between the first day of dialysis treatment and the day of kidney transplantation.
To minimize measurement variability, all repeated measures for each patient during any given calendar quarter, i.e., over a 13-week or 3-month interval, up to the time of kidney transplantation, were averaged and the quarterly means in each of the 20 calendar quarters were used in our analyses. Each patient had up to 39 recoded post-hemodialysis weights corresponding thrice weekly MHD treatment. All values were averaged into one single quarterly value per patient per each calendar quarter. In the present study we used the average of a number of BMI measurement in the last quarter before transplantation.
After deleting extreme outliers (BMI<12 or >60 kg/m2) we divided pre-transplant BMI into six a priori selected categories or underweight (=<19.99 kg/m2), low normal weight (20-21.99 kg/m2,), high normal weight (22-24.99 kg/m2,) overweight (25-29.99 kg/m2,), mild obesity (30-34.99 kg/m2,) and moderate to sever obesity (>=35 kg/m2). These increments were consistent with our previous studies.[58]
Laboratory Measures
Blood samples were drawn using uniform techniques in all of the DaVita dialysis clinics and were transported to the DaVita Laboratory in Deland, Florida, typically within 24 hours. All laboratory values were measured by automated and standardized methods in the DaVita Laboratory. Most laboratory values were measured monthly, including serum urea, creatinine, albumin, calcium, phosphorus, bicarbonate, and total iron binding capacity (TIBC). Serum ferritin was measured at least quarterly. Hemoglobin was measured at least monthly in essentially all patients and weekly to bi-weekly in most patients. Most blood samples were collected pre-dialysis with the exception of the post-dialysis serum urea nitrogen that was obtained to calculate urea kinetics. Kt/V (single pool) was calculated using urea kinetic modeling equations as described elsewhere.[56] Albumin-corrected calcium was calculated by subtracting 0.8 mg/dL for each g/dL serum albumin below 4.0 g/dL.[59]
Definition of DGF
DGF was defined as the need for any dialysis therapy in the first week after transplantation.[1]
Statistical Methods
Data were summarized using proportions, means (±standard deviation [SD]) or medians (interquartile range [IQR]) as appropriate. Categorical variables were analyzed with chi-square tests and continuous variables were compared using Student’s t-tests or the Mann-Whitney U tests, Kruskal-Wallis H tests or ANOVA as appropriate. In all statistics two-sided tests were used and the results were considered statistically significant if p was <0.05. Logistic regression models were employed to estimate the odds ratio (OR) (and 95% confidence interval [95%CI]) of post-transplant DGF based on pre-transplant BMI during the calendar quarter preceding the kidney transplantation.
For each analysis, four models were examined based on the level of multivariate adjustment: (I) An unadjusted model; (II) Case-mix adjusted models included age, gender, race-ethnicity (African Americans and other self-categorized Blacks, Non-Hispanic Whites, Asians, Hispanics and others), diabetes mellitus, dialysis vintage, primary insurance (Medicare, Medicaid, private and others), marital status (married, single, divorced, widowed and other or unknown), the standardized mortality ratio of the dialysis clinic during entry quarter, dialysis dose as indicated by Kt/V (single pool), presence or absence of a dialysis catheter, and (III) Malnutrition-inflammation-complex syndrome (MICS) adjusted models which included all of the covariates in the case-mix model as well as 11 surrogates of nutritional status and inflammation, including 10 laboratory variables with known association with clinical outcomes in HD patients, i.e. nPCR as an indicator of daily protein intake, also known as the normalized protein nitrogen appearance (nPNA)[60], serum or blood concentrations of albumin, creatinine, TIBC, ferritin, phosphorus, calcium, bicarbonate, peripheral white blood cell count (WBC), lymphocyte percentage and hemoglobin; and (IV) Case-mix, MICS and transplant data adjusted models included all of the above plus 7 transplant-related variables: (1) donor type (deceased or living), (2) donor age, (3) panel reactive antibody (PRA) titer (last value prior to transplant), (4) number of HLA mismatches, (5) cold ischemia time, (6) transfusion before transplantation and (7) extended donor criteria (EDC) using standard definition (donor history of hypertension and/or serum creatinine of donor > 1.5 mg/dL and/or cause of death in donor is cerebrovascular event).
In sensitivity analyses, we reexamined all associations after 1,962 peritoneal dialysis patients were added to 11,836 hemodialysis patients, leading to a total sample size of 13,798 kidney transplanted recipients. Missing covariate data in the last (pre-transplant) colander quarter were imputed by medians or means including from prior calendar quarters as appropriate. All analyses were carried out using STATA version 11.1 (STATA Corporation, College Station, TX).
Supplementary Material
Acknowledgments
We thank Mr. Robert Lehn at DaVita Laboratories in Deland, FL, Mr. Joe Weldon, from DaVita Informatics, for providing the national database, and Mr. Chris Rucker and Ms. Beth Bennett from DaVita Clinical Research for their continued support.
Funding Source:
The study was supported by KKZ’s research grant from the American Heart Association grant (0655776Y). KKZ’s other funding sources include the National Institute of Diabetes, Digestive and Kidney Disease of the National Institute of Health (R01 DK078106); a research grant from DaVita Clinical Research and a philanthropic grant from Mr. Harold Simmons. MZM received grants from the National Research Fund (NKTH-OTKA-EU 7KP-HUMAN-MB08-A-81231), was also supported by the János Bolyai Research Scholarship of the Hungarian Academy of Sciences (2008-2011), and is recipient of the Hungarian Eötvös Scholarship (MÖB/66-2/2010).
Footnotes
Relevant Potential Conflict of Interest:
Dr. Krishnan is an employee of DaVita. Dr. Kalantar-Zadeh is the medical director of DaVita Harbor-UCLA/MFI in Long Beach, CA. Other authors have not declared any conflict of interest.
References
- 1.Yarlagadda SG, Coca SG, Garg AX, et al. Marked variation in the definition and diagnosis of delayed graft function: a systematic review. Nephrol Dial Transplant. 2008;23:2995–3003. doi: 10.1093/ndt/gfn158. [DOI] [PMC free article] [PubMed] [Google Scholar]
- 2.Perico N, Cattaneo D, Sayegh MH, et al. Delayed graft function in kidney transplantation. Lancet. 2004;364:1814–1827. doi: 10.1016/S0140-6736(04)17406-0. [DOI] [PubMed] [Google Scholar]
- 3.Ojo AO, Wolfe RA, Held PJ, et al. Delayed graft function: risk factors and implications for renal allograft survival. Transplantation. 1997;63:968–974. doi: 10.1097/00007890-199704150-00011. [DOI] [PubMed] [Google Scholar]
- 4.Koning OH, van Bockel JH, van der Woude FJ, et al. Risk factors for delayed graft function in University of Wisconsin solution preserved kidneys from multiorgan donors. European Multicenter Study Group on Organ Preservation. Transplant Proc. 1995;27:752–753. [PubMed] [Google Scholar]
- 5.Sellers MT, Gallichio MH, Hudson SL, et al. Improved outcomes in cadaveric renal allografts with pulsatile preservation. Clin Transplant. 2000;14:543–549. doi: 10.1034/j.1399-0012.2000.140605.x. [DOI] [PubMed] [Google Scholar]
- 6.Gjertson DW. Impact of delayed graft function and acute rejection on graft survival. Transplant Proc. 2002;34:2432. doi: 10.1016/s0041-1345(02)03167-6. [DOI] [PubMed] [Google Scholar]
- 7.Hassanain M, Tchervenkov J, Cantarovich M, et al. Delayed graft function has an equally bad impact on deceased donor renal graft survival in both standard criteria donors and expanded criteria donors. Transplant Proc. 2009;41:133–134. doi: 10.1016/j.transproceed.2008.10.044. [DOI] [PubMed] [Google Scholar]
- 8.Yarlagadda SG, Coca SG, Formica RN, Jr, et al. Association between delayed graft function and allograft and patient survival: a systematic review and meta-analysis. Nephrol Dial Transplant. 2009;24:1039–1047. doi: 10.1093/ndt/gfn667. [DOI] [PubMed] [Google Scholar]
- 9.Tapiawala SN, Tinckam KJ, Cardella CJ, et al. Delayed graft function and the risk for death with a functioning graft. J Am Soc Nephrol. 2010;21:153–161. doi: 10.1681/ASN.2009040412. [DOI] [PMC free article] [PubMed] [Google Scholar]
- 10.Almond PS, Matas AJ, Canafax DM. Fixed-rate reimbursement fails to cover costs for patients with delayed graft function. Pharmacotherapy. 1991;11:126S–129S. [PubMed] [Google Scholar]
- 11.Almond PS, Troppmann C, Escobar F, et al. Economic impact of delayed graft function. Transplant Proc. 1991;23:1304. [PubMed] [Google Scholar]
- 12.Rosenthal JT, Danovitch GM, Wilkinson A, et al. The high cost of delayed graft function in cadaveric renal transplantation. Transplantation. 1991;51:1115–1118. [PubMed] [Google Scholar]
- 13.Friedman AN, Miskulin DC, Rosenberg IH, et al. Demographics and trends in overweight and obesity in patients at time of kidney transplantation. Am J Kidney Dis. 2003;41:480–487. doi: 10.1053/ajkd.2003.50059. [DOI] [PubMed] [Google Scholar]
- 14.Holley JL, Shapiro R, Lopatin WB, et al. Obesity as a risk factor following cadaveric renal transplantation. Transplantation. 1990;49:387–389. doi: 10.1097/00007890-199002000-00032. [DOI] [PMC free article] [PubMed] [Google Scholar]
- 15.Pirsch JD, Armbrust MJ, Knechtle SJ, et al. Obesity as a risk factor following renal transplantation. Transplantation. 1995;59:631–633. [PubMed] [Google Scholar]
- 16.Pischon T, Sharma AM. Obesity as a risk factor in renal transplant patients. Nephrol Dial Transplant. 2001;16:14–17. doi: 10.1093/ndt/16.1.14. [DOI] [PubMed] [Google Scholar]
- 17.Ghahramani N, Reeves WB, Hollenbeak C. Association between increased body mass index, calcineurin inhibitor use, and renal graft survival. Exp Clin Transplant. 2008;6:199–202. [PubMed] [Google Scholar]
- 18.Lentine KL, Rocca-Rey LA, Bacchi G, et al. Obesity and cardiac risk after kidney transplantation: experience at one center and comprehensive literature review. Transplantation. 2008;86:303–312. doi: 10.1097/TP.0b013e31817ef0f9. [DOI] [PMC free article] [PubMed] [Google Scholar]
- 19.Howard RJ, Thai VB, Patton PR, et al. Obesity does not portend a bad outcome for kidney transplant recipients. Transplantation. 2002;73:53–55. doi: 10.1097/00007890-200201150-00009. [DOI] [PubMed] [Google Scholar]
- 20.Schold JD, Srinivas TR, Guerra G, et al. A “weight-listing” paradox for candidates of renal transplantation? Am J Transplant. 2007;7:550–559. doi: 10.1111/j.1600-6143.2006.01629.x. [DOI] [PubMed] [Google Scholar]
- 21.Marcen R, Fernandez A, Pascual J, et al. High body mass index and posttransplant weight gain are not risk factors for kidney graft and patient outcome. Transplant Proc. 2007;39:2205–2207. doi: 10.1016/j.transproceed.2007.07.072. [DOI] [PubMed] [Google Scholar]
- 22.Johnson DW, Isbel NM, Brown AM, et al. The effect of obesity on renal transplant outcomes. Transplantation. 2002;74:675–681. doi: 10.1097/00007890-200209150-00015. [DOI] [PubMed] [Google Scholar]
- 23.Streja E, Molnar MZ, Kovesdy CP, et al. Associations of Pre-Transplant Weight and Muscle Mass with Mortality in Renal Transplant Recipients. CJASN. 2011 doi: 10.2215/CJN.09131010. in press. [DOI] [PMC free article] [PubMed] [Google Scholar]
- 24.Lynch RJ, Ranney DN, Shijie C, et al. Obesity, surgical site infection, and outcome following renal transplantation. Ann Surg. 2009;250:1014–1020. doi: 10.1097/SLA.0b013e3181b4ee9a. [DOI] [PubMed] [Google Scholar]
- 25.Bennett WM, McEvoy KM, Henell KR, et al. Morbid obesity does not preclude successful renal transplantation. Clin Transplant. 2004;18:89–93. [PubMed] [Google Scholar]
- 26.Massarweh NN, Clayton JL, Mangum CA, et al. High body mass index and short- and long-term renal allograft survival in adults. Transplantation. 2005;80:1430–1434. doi: 10.1097/01.tp.0000181094.68259.88. [DOI] [PubMed] [Google Scholar]
- 27.Espejo B, Torres A, Valentin M, et al. Obesity favors surgical and infectious complications after renal transplantation. Transplant Proc. 2003;35:1762–1763. doi: 10.1016/s0041-1345(03)00718-8. [DOI] [PubMed] [Google Scholar]
- 28.Yamamoto S, Hanley E, Hahn AB, et al. The impact of obesity in renal transplantation: an analysis of paired cadaver kidneys. Clin Transplant. 2002;16:252–256. doi: 10.1034/j.1399-0012.2002.01080.x. [DOI] [PubMed] [Google Scholar]
- 29.Gosmanov AR, Smiley DD, Robalino G, et al. Effects of oral and intravenous fat load on blood pressure, endothelial function, sympathetic activity, and oxidative stress in obese healthy subjects. Am J Physiol Endocrinol Metab. 2010;299:E953–958. doi: 10.1152/ajpendo.00469.2010. [DOI] [PMC free article] [PubMed] [Google Scholar]
- 30.Lambert E, Sari CI, Dawood T, et al. Sympathetic nervous system activity is associated with obesity-induced subclinical organ damage in young adults. Hypertension. 2010;56:351–358. doi: 10.1161/HYPERTENSIONAHA.110.155663. [DOI] [PubMed] [Google Scholar]
- 31.Olarte IG, Hawasli A. Kidney transplant complications and obesity. Am J Surg. 2009;197:424–426. doi: 10.1016/j.amjsurg.2008.11.021. [DOI] [PubMed] [Google Scholar]
- 32.Sharma AK, Tolani SL, Rathi GL, et al. Evaluation of factors causing delayed graft function in live related donor renal transplantation. Saudi J Kidney Dis Transpl. 2010;21:242–245. [PubMed] [Google Scholar]
- 33.Jensen H, Ladefoged J. Influence of warm and cold ischemia time on initial function and one-year survival of renal allografts. Clin Nephrol. 1976;5:256–259. [PubMed] [Google Scholar]
- 34.Gentil MA, Alcaide MP, Algarra GR, et al. Impact of delayed graft function on cadaveric kidney transplant outcome. Transplant Proc. 2003;35:689–691. doi: 10.1016/s0041-1345(03)00048-4. [DOI] [PubMed] [Google Scholar]
- 35.Arias M. Impact of the delayed graft function in hypersensitized kidney transplant patients. Transplant Proc. 2003;35:1655–1657. doi: 10.1016/s0041-1345(03)00564-5. [DOI] [PubMed] [Google Scholar]
- 36.Boom H, Mallat MJ, de Fijter JW, et al. Delayed graft function influences renal function, but not survival. Kidney Int. 2000;58:859–866. doi: 10.1046/j.1523-1755.2000.00235.x. [DOI] [PubMed] [Google Scholar]
- 37.Marcen R, Orofino L, Pascual J, et al. Delayed graft function does not reduce the survival of renal transplant allografts. Transplantation. 1998;66:461–466. doi: 10.1097/00007890-199808270-00008. [DOI] [PubMed] [Google Scholar]
- 38.Chang SH, Coates PT, McDonald SP. Effects of body mass index at transplant on outcomes of kidney transplantation. Transplantation. 2007;84:981–987. doi: 10.1097/01.tp.0000285290.77406.7b. [DOI] [PubMed] [Google Scholar]
- 39.Balamuthusamy S, Paramesh A, Zhang R, et al. The effects of body mass index on graft survival in adult recipients transplanted with single pediatric kidneys. Am J Nephrol. 2009;29:94–101. doi: 10.1159/000151293. [DOI] [PubMed] [Google Scholar]
- 40.Zaydfudim V, Feurer ID, Moore DR, et al. Pre-transplant overweight and obesity do not affect physical quality of life after kidney transplantation. J Am Coll Surg. 2010;210:336–344. doi: 10.1016/j.jamcollsurg.2009.11.009. [DOI] [PubMed] [Google Scholar]
- 41.Darvall KA, Sam RC, Silverman SH, et al. Obesity and thrombosis. Eur J Vasc Endovasc Surg. 2007;33:223–233. doi: 10.1016/j.ejvs.2006.10.006. [DOI] [PubMed] [Google Scholar]
- 42.Beijers HJ, Ferreira I, Spronk HM, et al. Body composition as determinant of thrombin generation in plasma: the Hoorn study. Arterioscler Thromb Vasc Biol. 2010;30:2639–2647. doi: 10.1161/ATVBAHA.110.211946. [DOI] [PubMed] [Google Scholar]
- 43.Ay L, Kopp HP, Brix JM, et al. Thrombin generation in morbid obesity: significant reduction after weight loss. J Thromb Haemost. 2010;8:759–765. doi: 10.1111/j.1538-7836.2010.03766.x. [DOI] [PubMed] [Google Scholar]
- 44.Stein PD, Beemath A, Olson RE. Obesity as a risk factor in venous thromboembolism. Am J Med. 2005;118:978–980. doi: 10.1016/j.amjmed.2005.03.012. [DOI] [PubMed] [Google Scholar]
- 45.Casserly LF, Dember LM. Thrombosis in end-stage renal disease. Semin Dial. 2003;16:245–256. doi: 10.1046/j.1525-139x.2003.16048.x. [DOI] [PubMed] [Google Scholar]
- 46.McCall SJ, Tuttle-Newhall JE, Howell DN, et al. Prognostic significance of microvascular thrombosis in donor kidney allograft biopsies. Transplantation. 2003;75:1847–1852. doi: 10.1097/01.TP.0000063126.88887.68. [DOI] [PubMed] [Google Scholar]
- 47.Postorino M, Marino C, Tripepi G, et al. Abdominal obesity and all-cause and cardiovascular mortality in end-stage renal disease. J Am Coll Cardiol. 2009;53:1265–1272. doi: 10.1016/j.jacc.2008.12.040. [DOI] [PubMed] [Google Scholar]
- 48.Noori N, Kopple JD, Kovesdy CP, et al. Mid-arm muscle circumference and quality of life and survival in maintenance hemodialysis patients. Clin J Am Soc Nephrol. 2010;5:2258–2268. doi: 10.2215/CJN.02080310. [DOI] [PMC free article] [PubMed] [Google Scholar]
- 49.Noori N, Kovesdy CP, Dukkipati R, et al. Survival predictability of lean and fat mass in men and women undergoing maintenance hemodialysis. Am J Clin Nutr. 2010;92:1060–1070. doi: 10.3945/ajcn.2010.29188. [DOI] [PMC free article] [PubMed] [Google Scholar]
- 50.Locatelli F, Fouque D, Heimburger O, et al. Nutritional status in dialysis patients: a European consensus. Nephrol Dial Transplant. 2002;17:563–572. doi: 10.1093/ndt/17.4.563. [DOI] [PubMed] [Google Scholar]
- 51.Miller JE, Kovesdy CP, Norris KC, et al. Association of Cumulatively Low or High Serum Calcium Levels with Mortality in Long-Term Hemodialysis Patients. Am J Nephrol. 2010;32:403–413. doi: 10.1159/000319861. [DOI] [PMC free article] [PubMed] [Google Scholar]
- 52.Kovesdy CP, Czira ME, Rudas A, et al. Body mass index, waist circumference and mortality in kidney transplant recipients. Am J Transplant. 2010;10:2644–2651. doi: 10.1111/j.1600-6143.2010.03330.x. [DOI] [PubMed] [Google Scholar]
- 53.Kopple JD, Zhu X, Lew NL, et al. Body weight-for-height relationships predict mortality in maintenance hemodialysis patients. Kidney Int. 1999;56:1136–1148. doi: 10.1046/j.1523-1755.1999.00615.x. [DOI] [PubMed] [Google Scholar]
- 54.Kalantar-Zadeh K, Streja E, Kovesdy CP, et al. The obesity paradox and mortality associated with surrogates of body size and muscle mass in patients receiving hemodialysis. Mayo Clin Proc. 2010;85:991–1001. doi: 10.4065/mcp.2010.0336. [DOI] [PMC free article] [PubMed] [Google Scholar]
- 55.Molnar MZ, Lukowsky LR, Streja E, et al. Blood pressure and survival in long-term hemodialysis patients with and without polycystic kidney disease. J Hypertens. 2010 doi: 10.1097/HJH.0b013e32833e4fd8. [DOI] [PMC free article] [PubMed] [Google Scholar]
- 56.Miller JE, Kovesdy CP, Nissenson AR, et al. Association of Hemodialysis Treatment Time and Dose with Mortality: The Role of Race and Gender. Am J Kidney Dis. 2010;55:100–112. doi: 10.1053/j.ajkd.2009.08.007. [DOI] [PMC free article] [PubMed] [Google Scholar]
- 57.Kalantar-Zadeh K, Miller JE, Kovesdy CP, et al. Impact of race on hyperparathyroidism, mineral disarrays, administered vitamin D mimetic, and survival in hemodialysis patients. J Bone Miner Res. 2010;25:2448–2458. doi: 10.1002/jbmr.177. [DOI] [PMC free article] [PubMed] [Google Scholar]
- 58.Kalantar-Zadeh K, Kopple JD, Kilpatrick RD, et al. Association of morbid obesity and weight change over time with cardiovascular survival in hemodialysis population. Am J Kidney Dis. 2005;46:489–500. doi: 10.1053/j.ajkd.2005.05.020. [DOI] [PubMed] [Google Scholar]
- 59.Kalantar-Zadeh K, Kilpatrick RD, Kuwae N, et al. Revisiting mortality predictability of serum albumin in the dialysis population: time dependency, longitudinal changes and population-attributable fraction. Nephrol Dial Transplant. 2005;20:1880–1888. doi: 10.1093/ndt/gfh941. [DOI] [PubMed] [Google Scholar]
- 60.Shinaberger CS, Greenland S, Kopple JD, et al. Is controlling phosphorus by decreasing dietary protein intake beneficial or harmful in persons with chronic kidney disease? Am J Clin Nutr. 2008;88:1511–1518. doi: 10.3945/ajcn.2008.26665. [DOI] [PMC free article] [PubMed] [Google Scholar]
Associated Data
This section collects any data citations, data availability statements, or supplementary materials included in this article.