Abstract
Reverse micelles (RMs) made from water and sodium bis(2-ethylhexyl) sulfosuccinate (AOT) are commonly studied experimentally as models of aqueous microenvironments. They are small enough for individual RMs to also be studied by molecular dynamics (MD) simulation, which yields detailed insight into their structure and properties. Although RM size is determined by the water loading ratio (i.e. the molar ratio of water to AOT), experimental measurements of RM size are imprecise and inconsistent, which is problematic when seeking to understand the relationship between water loading ratio and RM size, and when designing models for study by MD simulation. Therefore, a systematic study of RM size was performed by MD simulation with the aims of determining the size of an RM for a given water loading ratio, and of reconciling the results with experimental measurements. Results for a water loading ratio of 7.5 indicate that the interaction energy between AOT anions and other system components is at a minimum when there are 62 AOT anions in each RM. The minimum is due to a combination of attractive and repulsive electrostatic interactions that vary with RM size and the dielectric effect of available water. Overall, the results agree with a detailed analysis of previously published experimental data over a wide range of water loading ratios, and help reconcile seemingly discrepant experimental results. In addition, water loss and gain from an RM is observed and the mechanism of water exchange is outlined. This kind of RM model, which faithfully reproduces experimental results, is essential for reliable insights into the properties of RM-encapsulated materials.
Graphical Abstract
INTRODUCTION
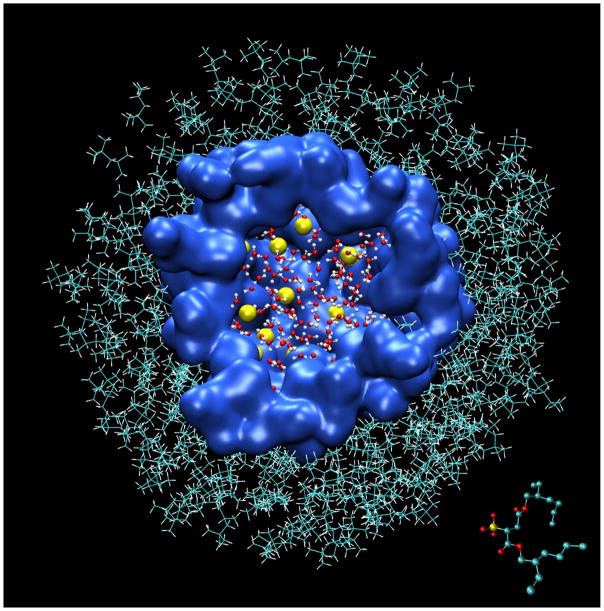
Reverse micelles (RMs), composed of water and surfactant suspended in a nonpolar solvent, are popular experimental systems for the study of biological materials under conditions where they are physically confined with limited amounts of water. As such, they are frequently used as experimental models of crowded biological microenvironments such as membranous organelles, intercellular spaces, and the interior of macromolecular chaperones.1–3 While RMs can be made with diverse surfactant types, sodium bis(2-ethylhexyl) sulfosuccinate (aka aerosol OT or AOT) is popular because it readily forms RMs without a cosurfactant that are chemically stable, optically transparent, and capable of encapsulating relatively large amounts of water (Figure 1).
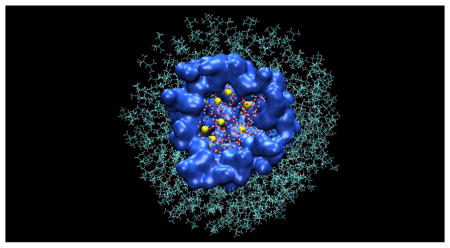
Figure 1.
Cross section of an RM model with W0 = 7.5 and 62 AOT. Water molecules are rendered as CPK models, sodium cations as yellow van der Walls spheres with a radius of 0.6 Å, AOT anions as a blue surface, and isooctane as lines. A single AOT anion is rendered as a CPK model in the lower right corner.
RM size in ternary AOT-based systems is determined by the water loading ratio (i.e. the mole ratio of water to surfactant, or W0),4 and the radius polydispersity (γ) of 0.065 – 0.30 reported for these systems5–12 suggests that their size distributions are narrow. However, the absolute size of RMs is not a simple or direct measurement, and experimental estimates of AOT RM size vary by as much as 35% for any given W0 value,13 particularly when these estimates are from techniques that rely on fundamentally different properties of an RM such as scattering intensities and transport rates. The uncertainty about RM size is especially problematic when performing molecular dynamics (MD) simulations for insight into the structure and organization of RMs because the number of molecular components in most simulations is fixed.14 The question of RM size remains unresolved despite numerous MD simulation studies with continuum solvent,15–17 coarse-grained surfactant,18–22 and all-atom models.13,23 Indeed, RM simulations of W0 = 7.5 have been recently described with as few as 70 AOT molecules per RM,24 (nAOT) and as many as 106.25 Moreover, the question is a general one, with similar questions arising in studies of reverse micelles made with cetyltrimethylammonium bromide and other surfactants.14,26 In the case of AOT, One approach to answering the question of RM size via simulation has been to allow RMs to self-assemble from randomly distributed components. However, this approach is computationally expensive, and has thus far yielded systems with unexpectedly large indices of polydispersity.27
Therefore, this study was undertaken to obtain a more precise and complete understanding of RM size, and address two main questions: what is the physicochemical basis for the relationship between W0 and RM size, and how can fundamentally different kinds of experimental data be reconciled? We address the first question with MD simulations by examining the interaction energies within RMs across a range of sizes, and comparing the simulation results to previously published experimental data. The results of this horizontal study (at constant W0 = 7.5) are also extrapolated vertically (across a range of W0) to further test them against experimental data. We address the second question by examining the nature of the experimental data available. We find that structural insights provided by these simulations help reconcile many of the apparent discrepancies in available experimental data.
METHODS
Simulations
Simulations were performed as NPT ensembles with NAMD 2.9,28 the CHARMM27 all atom force field for proteins and lipids,29 and TIP3P water.30 Parameters for the AOT anion and isooctane (isoO) were obtained from previously published studies.23,25,31,32 Long-range electrostatic forces were calculated with the Particle Mesh Ewald method33 and an interaction cutoff of 12 Å was applied within periodic boundary conditions. Van der Waals (VdW) forces were smoothly shifted to zero between 10 Å and 12 Å. Equations of motion were integrated with the Verlet method and a time step of 2 fs. Langevin dynamics with a damping coefficient of 5 ps−1 was used to keep the temperature at 300 °K. The pressure was maintained at 1 atm using a Nosé-Hoover-Langevin piston.34
Simulation systems were constructed by selecting a W0 value and the number of surfactant molecules (nAOT) to include in the system. These parameters determine the number of water molecules (nwater) to include, and the systems are denoted below as RMX where X = nAOT and ranged from 34 to 106. A spherical cluster of nwater + nAOT water molecules was extracted from a well-equilibrated simulation of pure water at 300 °K and 1 atm. AOT molecules were added by replacing nAOT randomly selected water molecules with sodium cations, and distributing the anionic portions randomly on the surface of the cluster with SO3 groups oriented inward. These water/AOT clusters were placed in the center of a truncated octahedron of sufficient size to contain 2536 molecules of isoO (nISO) – a number chosen so that the isoO mass was 83% of the total system mass for the largest RM and thus, within the RM-forming portion of the AOT/water/isoO phase diagram.25 Compositions of systems are listed in Table 1.
Table 1.
Compositions of simulated systems*
| System | nAOT | nwater | natoms | fiso (%) | rw (Å) | s (Å) |
|---|---|---|---|---|---|---|
| WD | - | 255 | 66701 | 98 | 12.3 | 95 |
| RM34 | 34 | 255 | 68945 | 94 | 12.3 | 98 |
| RM46 | 46 | 345 | 70007 | 92 | 13.6 | 98.5 |
| RM50 | 50 | 375 | 70361 | 91 | 13.9 | 98.7 |
| RM54 | 54 | 405 | 70715 | 90 | 14.4 | 98.9 |
| RM58 | 58 | 435 | 71069 | 90 | 14.8 | 99 |
| RM60 | 60 | 450 | 71246 | 89 | 14.9 | 99.1 |
| RM62 | 62 | 465 | 71423 | 89 | 15.1 | 99.2 |
| RM64 | 64 | 480 | 71600 | 89 | 15.3 | 99.3 |
| RM66 | 66 | 495 | 71777 | 88 | 15.4 | 99.4 |
| RM68 | 68 | 510 | 71954 | 88 | 15.6 | 99.5 |
| RM70 | 70 | 525 | 72131 | 88 | 15.7 | 99.6 |
| RM74 | 74 | 555 | 72485 | 87 | 16.1 | 99.7 |
| RM78 | 78 | 585 | 72839 | 87 | 16.4 | 99.8 |
| RM82 | 82 | 615 | 73193 | 86 | 16.7 | 100 |
| RM94 | 94 | 705 | 74255 | 84 | 17.4 | 100.4 |
| RM106 | 106 | 795 | 75317 | 83 | 18.2 | 100.9 |
nAOT and nwater are the numbers of AOT and water molecules. natoms is the total number of atoms in each system. fiso is the mass fraction of isoO as a percentage of mass of all components in the system. rW is the average distance from the center of the RM to the outermost water molecule. s is edge length of the truncated octahedron unit cell.
Simulation systems were equilibrated in four stages, each stage consisting of 0.01 ns minimization and 1 ns of NPT simulation. In stage one, all atoms except those in the isoO solvent were fixed in position. In stage two, the hydrocarbon tails of the AOT anions were unfixed. In stage three, the remaining portions of the AOT anions were unfixed. In stage four, all molecules in the system were unfixed. A separate simulation of a water droplet in isoO (without AOT) was equilibrated with only the latter two stages. Equilibrated systems were propagated for 30 ns with coordinates and energies saved every 0.001 ns. Only the final 15 ns of each trajectory were used for the data analysis. The entire process – system assembly, equilibration, and 30 ns simulation – was repeated twice for each system with a different water cluster and sodium cation substitutions to assess the reproducibility of results. A separate RM62 system was propagated for 100 ns to examine the time required for convergence.35
Analysis
Interaction energies for each saved coordinate set were calculated using VMD36 and the same parameters used to create the trajectory (VMD and NAMD therefore yield identical energies for the same structure). Four energies were calculated for individual members of each molecular species: its interaction with all other components of the same molecular species, and its overall interaction with each of the other three molecular species. These energies were averaged over all members of each species, and over all saved coordinate sets, for each simulation.
Most RMs quickly became ellipsoid in shape. Therefore, analysis of the distribution of components in terms of radial density profiles was problematic, and local nearest distance metrics were substituted in which the SO3 groups demarcated the boundary between polar and apolar phases. The distance of various atoms and groups from this boundary surface was calculated.37 Each atom/group was assigned to a 1 Å layer, based on its distance to the nearest SO3 headgroup. The thickness of the surfactant layer (rAOT) is the distance from the boundary to the AOT terminal CH3 groups, plus the radius of an SO3 head group (3.1 Å) and the radius of a CH3 group (2.3 Å). The various radii and distances referenced in this work are summarized in Table 2.
Table 2.
Radius definitions
| Symbol | Definition |
|---|---|
| rW | Average distance from the center of the RM to the outermost water molecule (used only in table 1) |
| rh | Hydrodynamic radius of RM complexes |
| rAOT | Thickness of the surfactant shell |
| rg | Radius of gyration of RM complexes |
| r0 | VdW radius of a water oxygen |
| rcore | Radius of the core containing water, sodium cations, and approximately half the volume of SO3 groups |
The radius of gyration (ng) of simulated RM complexes was calculated as the root mean square distance between atom pairs according to equation 1:
| (1) |
where n is the number of atoms, nij is the distance between atom i and j, and ric is the distance between atom i and the center of mass of the RM. To facilitate the comparison of rg values from simulations with rg values obtained from SAXS, only sodium, oxygen, and sulfur atoms were included in the calculation of rg, because carbon and hydrogen atoms in AOT scatter X-rays to the same degree as the atoms in isoO, and do not create the electron contrast detected by SAXS.
RM shape was characterized by modeling the aqueous core consisting of water and sodium cations as an ellipsoid with the same mass and moments of inertia.18,22 The principal moments of inertia (I1, I2, and I3) were calculated by determining the eigenvalues of the inertia tensor. For ellipsoids, the relations between semi-axes and principal moments of inertia are given by equations 2 – 4. The semi-axes a, b, and c of the ellipsoid systems were determined by solving equations 2–4 for a, b, and c:
| (2) |
| (3) |
| (4) |
where maq is the combined mass of the water molecules and sodium cations. Because these calculations are based on the coordinates of atomic centers, and neglect the volume of the outermost water molecules, the VdW radius of a water oxygen (ro = 1.4Å) was added to each semi-axis, yielding a′, b′, and c′. Eccentricity, e, is a commonly used measure of the degree to which shape deviates from spherical.23,24,38 It was calculated from the semi-axes by
| (5) |
where e = 0 for a perfect sphere and approaches 1 for disc-like and rod-like shapes.
As RMs became ellipsoid, the hydrodynamic radius (rh) of simulated RM complexes was determined according to equation 6:
| (6) |
where rh is equal to the radius of sphere that has the same volume as the ellipsoidal RMs.39
RESULTS
Equilibration
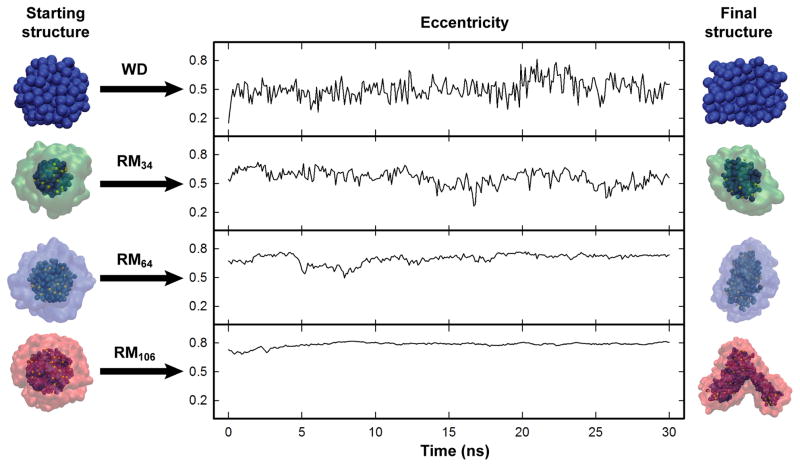
The stability of system energy over time is a common criterion by which NPT simulations are judged to be suitably equilibrated. By this criterion, the water droplet and all 16 RM systems reached stable energies within 10 ns. However, simulated systems did not all reach a stable shape within this time, and some of the systems required nearly 15 ns to reach stable eccentricity values (Figure 2). Therefore, all simulations were run for 30 ns, but only the last 15 ns were deemed to be equilibrated and used for analysis.
Figure 2.
Eccentricity vs time for the WD, RM34, RM64, and RM106 systems. On either end of each graph, the initial and final structures are illustrated by representing water molecules as blue spheres, sodium cations as yellow spheres, and AOT anions as a surface. The starting structures were energy minimized before marking time “0” in the eccentricity graphs. Note that the final structure of the RM106 system is highly distorted. This degree of distortion was not reflected in the eccentricity calculations, fission into smaller systems appeared imminent. There were no shape distortions suggesting imminent fission observed in any of the smaller systems.
Trajectory analysis
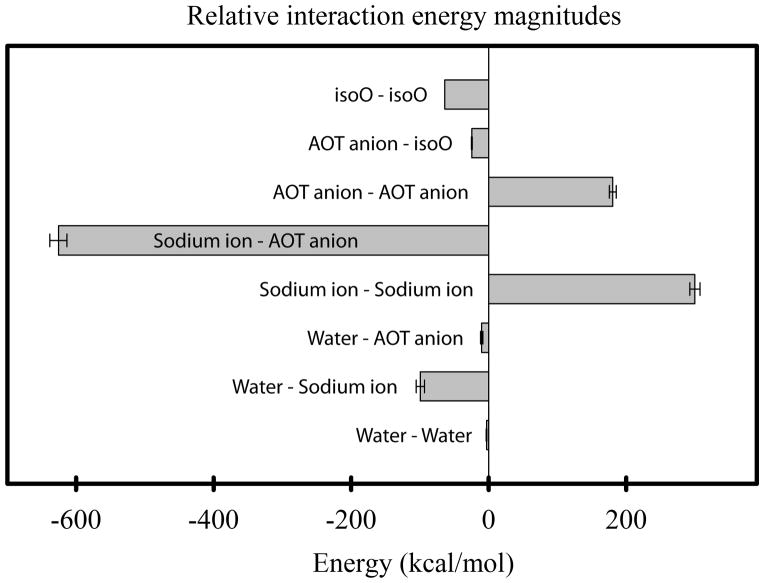
The overall energy of each RM system varied with system size, so most energy terms have been normalized by nAOT to facilitate comparisons. Representative values for the various nonbonded interaction energies in the RM62 system are illustrated in Figure 3. The largest single term was the attractive electrostatic interaction between sodium cations and AOT anions. This attractive interaction was only partially balanced by repulsive interactions between cations and between anions. Relatively small negative energies were found for nonbonded isoO–isoO, AOT anion–isoO, water–AOT anion, water–sodium and water–water interactions.
Figure 3.
The relative magnitudes of all pairwise non-bonded interaction energies for an RM62 system, normalized by nAOT .
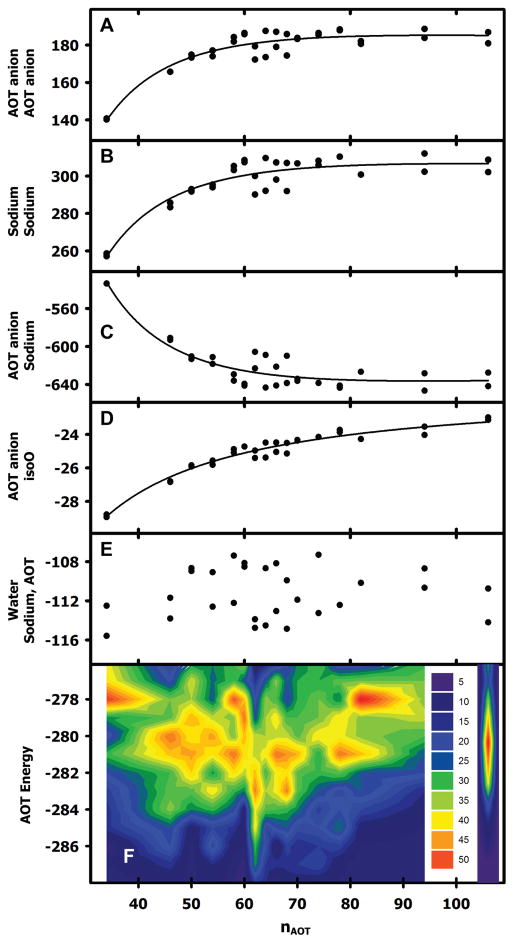
Interaction energies involving AOT headgroups and sodium cations both became more positive with RM size, suggesting that these repulsive interactions favor smaller RMs at constant W0 (Figures 4A,B). In contrast, interaction energies between sodium cations and AOT anions became more negative with RM size, suggesting that these attractive interactions favor larger RMs at constant W0 (Figure 4C). Water-water and isoO-isoO interaction energies were −3 kcal/mol and −64 kcal/mol, respectively, and independent of system size (Figure 3). The interaction energies between AOT anions and isoO became slightly more positive with RM size (Figure 4D), while those between sodium cations and with AOT anions exhibited no strong trend (Figure 4E).
Figure 4.
RM system nonbonded interaction energies in kcal/mole normalized by nAOT. (A) AOT anion – AOT anion interaction energies with an inverse second order fit. (B) Sodium cation – Sodium cation interaction energies with an inverse second order fit. (C) AOT anion – Sodium cation interaction energies with an inverse second order fit. (D) AOT anion – isoO interaction energies with an inverse second order fit. (E) The sum of water – AOT anion and water – Sodium cation interaction energies. There are two results for each system in panels A-E from the two independent 30 ns simulations, that sometimes superimpose. (F) AOT energy (defined in the text, i.e. the sum of the energies depicted in panels A-E) with a quadratic fit to all data except the RM106 system (indicated in open circles). The value of nAOT at the minimum is 60.9 (vertical red arrow). All energies are normalized by nAOT. The two results for each system are from the two independent 30 ns simulations. (G) Histograms of the AOT energies combined into a contour graph. Autocorrelation times for the AOT energies were generally less than 100 ps. Therefore, energies were calculated at 100 ps intervals for the two 15 ps simulations for each system, divided into 1 kcal/mol bins, and color-coded according to bin counts as indicated.
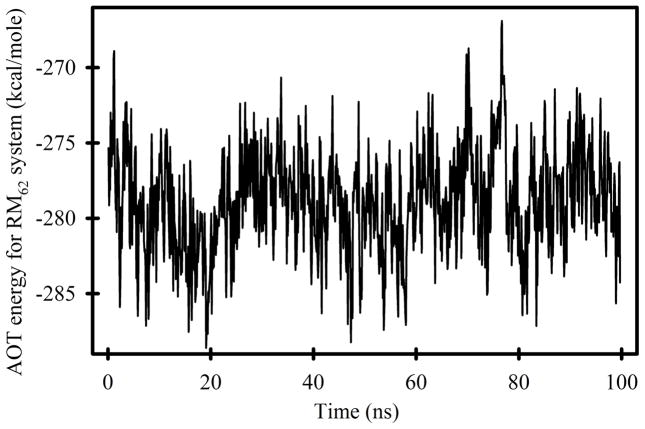
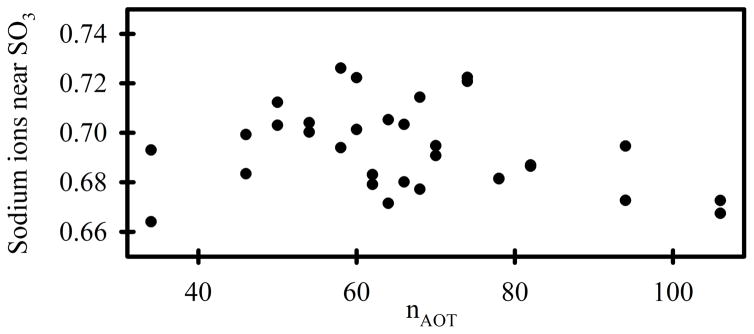
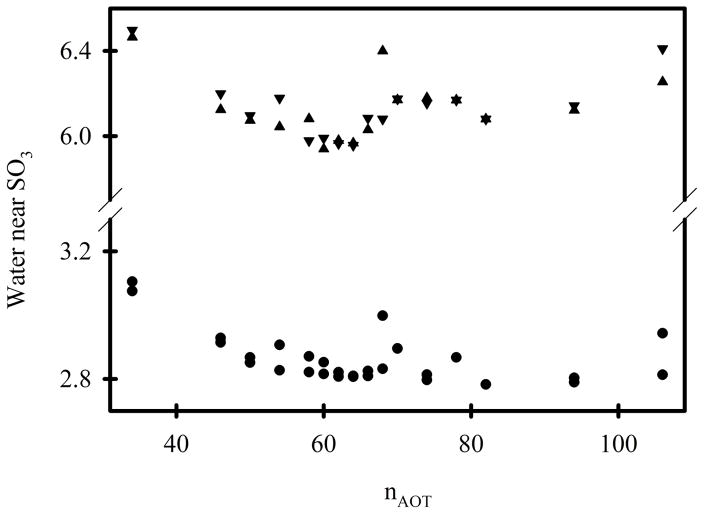
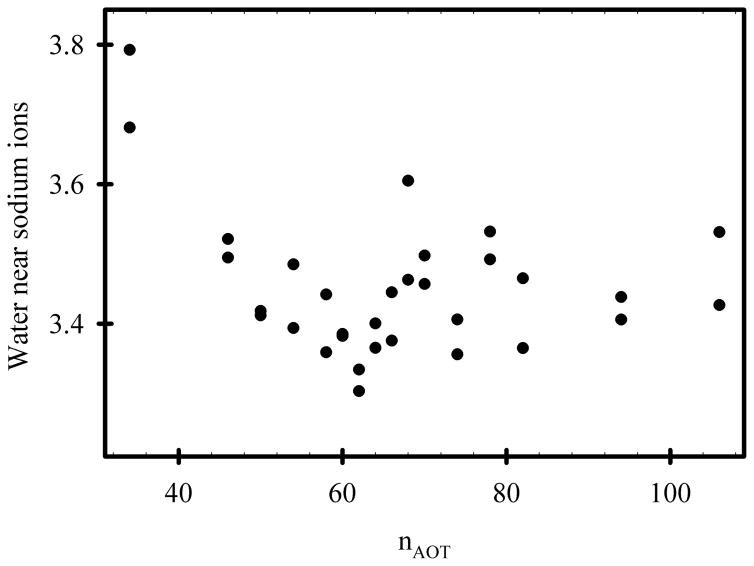
The sum of the energies depicted in Figures 4A-E represent the energies of interaction between sodium AOT and all other system components. This “AOT energy” exhibits a minimum in the range of nAOT = 62 to 68 (Figure 4F). However, the data from RM106 systems is anomalous. Together with the anomalous shape of this system (Figure 2, lower panel), it appears that they are unstable for reasons that are not reflected in the AOT energy. Fission into smaller systems appears imminent, and this behavior was not observed for any of the smaller systems. If the AOT energies in Figure 4F are fit while excluding the RM106 system, the minimum value corresponds to nAOT = 60.9. Histograms of the AOT energy at 100 ps intervals for both 15 ns simulations of each system were created for each of the systems and combined into a contour graph (Figure 4G). There are several noteworthy features in this graph. First, the RM62 system makes far more frequent excursions to energies < −284 kcal/mol than any other system. There is no correlation between these low energies and the number of sodium cations in the immediate vicinity of AOT head groups (Figure 5), or the number of water molecules in the immediate vicinity of AOT head groups (Figure 6). However, the RM62 system had the smallest number of water molecules in the immediate vicinity of sodium cations (Figure 7). To test whether AOT energies in the RM62 system were representative of simulations over longer times, it was propagated for 100 ns (Figure 8). No systematic drift in AOT energy was observed.
Figure 5.
The average number of sodium cations within 3Å of the SO3− groups. The two results for each value of nAOT were derived from the two independent 30 ns simulations.
Figure 6.
The average number of water molecules within 3Å (circles) and 5Å (triangles) of the SO3− groups. The two results for each value of nAOT were derived from the two independent 30 ns simulations.
Figure 7.
The average number of water molecules within 3Å of sodium cations. The two results for each value of nAOT were derived from the two independent 30 ns simulations.
Figure 8.
AOT energies over 100 ns for an RM62 system.
Second, there appear to be discrete preferred energy levels among the various systems, particularly at −283, −281, and −278 kcal/mol. The systems are not trapped at these levels, since autocorrelation times for the energy values are <100 ps. Several systems frequent more than one of these preferred levels, and systems differing in nAOT by only 2 can frequent quite different levels (e.g. RM62 and RM60). The existence of such discrete levels suggests that geometric factors may influence system energy, such as those that stabilize 60-mer viral capsids.
Third, there is a clear trend for higher AOT energies as nAOT values become either smaller or larger than 62. However, the data from RM106 systems is anomalous (extreme right portion of Figure 4F). These systems were included in this study because of previously published on a system of this size.25 However, their anomalous shape (Figure 2, lower panel) suggests that they are unstable for reasons not reflected in the AOT energy. Fission into smaller systems appears imminent, and this behavior was not observed for any of the smaller systems.
Altogether, these results suggest that when W0 = 7.5, RM62 systems assume a relatively low energy state more frequently that other RM systems, and that the structural basis for this low energy state is that screening of sodium cation – AOT anion interactions by water is reduced.
RM Structure and Organization
Deviations from a spherical shape became larger with increased RM size, while fluctuations in eccentricity became smaller (Figure 2). If the size of an RM is not appropriate for a given W0, shape distortion may occur because it is inherently unstable, without any indication of this distortion in the eccentricity value. For example, the RM106 system, illustrated in Figure 3, has a stable eccentricity value, but a highly distorted shape.
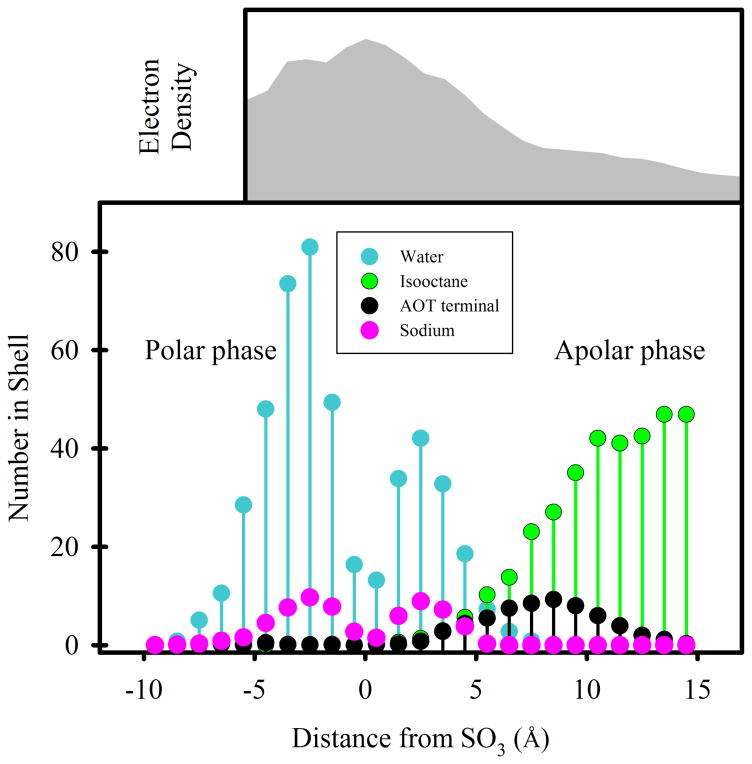
Nearest distance metrics indicate that water and sodium cations preferentially situate 2.5 Å closer to the center of the micelle than the SO3 headgroups, but another layer of water and sodium cations situate 2.5 Å farther from the center than these groups (Figure 9). This pattern is a reflection of AOT anion penetration into the aqueous core of the RM, and displacement of water and sodium cations to the outside. It should be noted that an intermolecular distance of 2.5 Å is insufficient space for water molecules to situate between the ions. This observation, and the overall dominance of the interaction energy between sodium cations and AOT anions, is consistent with the aforementioned conclusion that RM stability is determined by the proximity of charged species and the extent to which water is available to screen the electrostatic interactions.
Figure 9.
Distribution of components in an RM62 system. Lower panel: Nearest distance metrics analysis37 with distance to the nearest SO3 group on the horizontal axis. The polar phase is comprised primarily of water (blue) and sodium cations (magenta). The apolar phase is comprised of AOT chains (black) and isoO (green). The AOT terminal methyl groups are indicated to enable the determination of rAOT as described in the text. Upper panel: a radial electron density profile approximated by weighting an ordinary radial density profile by atomic numbers. The horizontal axis is roughly aligned with the distance scale of the lower panel. The vertical axis is arbitrary.
Figure 9 also shows that the distribution of isoO exhibits substantial overlap with the distribution of AOT chains, which is relevant to the observation in Figure 4D that interaction energies between AOT and isoO become more positive with RM size (discussed below). Finally, Figure 9 indicates that very few waters are more than 8Å inside of the SO3 groups. It should be noted that this distance is not a useful measure of the aqueous core radius because the RM has an ellipsoidal shape, and because AOT headgroups penetrate into the aqueous core of the RM.
Mass exchange
No loss or gain of sodium cations or AOT anions was observed over the course of the 30 ns simulations, but multiple water molecules both exited the RM into the isoO phase, and re-entered the RMs from the isoO phase. The number of water molecules gained and lost for all systems are listed in Table 3. There was no discernable difference in the first or second halves of the simulations, no apparent correlation between RM size and the rates of water gain/loss, and no tendency for a net change in nwater. In stark contrast, no molecules were lost from a pure water droplet in isoO over the same interval. This observation suggested that AOT anions were responsible for facilitating water transit in and out of the RM core. Although no attempt was made to estimate the magnitude of energy barrier that regulates water transfer, it was noted that the non-bonded interaction energy of a water molecule was −21 kcal/mol in the RM core, and −2.5 kcal/mol in the isoO phase. At various points in surfactant layer, the energy was approximately −10 kcal/mol. Thus, AOT anions appear to facilitate water transit in and out of the RM core by creating a population of water molecules at the interface with intermediate energies.
Table 3.
Water losses and gains for simulated RM systems*
| System | Loss | Gain | Net |
|---|---|---|---|
| WD | 0 | 0 | - |
| RM34 | 7 | 6 | −1 |
| RM46 | 5 | 5 | 0 |
| RM50 | 6 | 5 | −1 |
| RM54 | 7 | 4 | −3 |
| RM58 | 7 | 7 | 0 |
| RM60 | 6 | 6 | 0 |
| RM62 | 8 | 7 | −1 |
| RM64 | 7 | 5 | −2 |
| RM66 | 6 | 6 | 0 |
| RM68 | 11 | 11 | 0 |
| RM70 | 9 | 7 | −2 |
| RM74 | 6 | 6 | 0 |
| RM78 | 7 | 7 | 0 |
| RM82 | 12 | 11 | −1 |
| RM94 | 8 | 7 | −1 |
| RM106 | 8 | 7 | −1 |
counts are for the entire 30-ns simulations
Experimental correlation
A large number of experimental studies have been published that provide information about RM size. Some cannot be compared to the present results because they do not provide data for W0<12. Some DLS results must be excluded because the AOT concentration ([AOT]) used was greater than 200 mM and such concentrations appear to distort the results of DLS experiments.40 Since [AOT] = 140 mM in the simulations, only DLS studies performed with 100mM < [AOT] < 200 mM were compared.40 However, there are 11 published studies of RM size that may be compared to the simulation results reported herein.
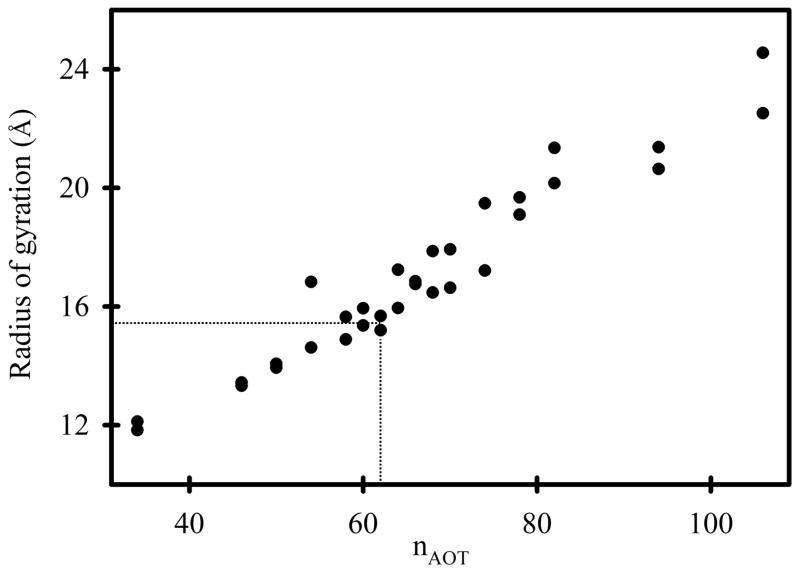
Amararene et al.6 reported SAXS results for RMs with W0 values ranging from 3 to 30. Linear interpolation of their results for W0 = 7.5 yields rg = 16 ± 1Å. Yano et al.41,42 reported SAXS results for RMs with W0 values ranging from 3.5 to 24.4. Linear interpolation of their results for W0 = 7.5 yields rg = 17 ± 1 Å. From the RM62 simulation and equation 2 we obtained rg = 15.7 Å (Figure 10), in close agreement with both experimental results. SAXS measurements have also been reported by Hirai et al., who reported a sharp discontinuity in the relationship between rg and W0 at W0 = 10.. Linear interpolation of their results for W0 < 10 yields rg = 26 Å for W0 = 7.5,43 considerably larger than the other two aforementioned SAXS studies. However, a linear extrapolation of their results for W0 > 10 yields rg = 18 Å for W0 = 7.5, which is in agreement with the other SAXS studies and with the simulation results reported herein.
Figure 10.
Radius of gyration vs nAOT for simulated RM systems. The two results for each value of nAOT were derived from the two independent 30 ns simulations. The average radius of gyration for the RM62 system is 15.7 Å, and indicated with dotted lines.
When comparing SAXS and simulation results, it must be emphasized that conclusions about rg are model dependent; whether the scattering entities are modeled as solid or hollow spheres has a significant influence on the results. A radial electron density profile for the RM62 system,23,24 approximated by weighting an ordinary radial density profile by atomic numbers, suggests that three regions with different X-ray scattering tendencies are present: an oxygen-rich region in the center, a transition region 10–15 Å from the RM center, and a relatively low density carbon-rich region beyond the transition region (Figure 9, upper panel). Some support for both solid and hollow models may be found in this graph, but the transition region – broadened as it is by eccentricity – suggests that nonspherical models must be considered for accurate results, and that simulations are needed to determine the nAOT for an RM from an rg measurement.
Eicke and Rehak reported LS measurements for RMs with W0 values ranging from 2.78 to 44.44 and derived average apparent molecular weight estimates, from which values of nAOT may be calculated. Exponential interpolation of their results for W0 = 7.5 yields nAOT = 64, which is in good agreement with the simulation results.
Numerous estimates of the hydrodynamic radius have been derived from experimental measurement of transport rates.40,44–49 Linear interpolations of these results for W0 = 7.5 yield values for rh ranging from 26 to 31 Å (Table 4). In some of these experimental studies, the thickness of AOT anion layer, rAOT, was used to interconvert rh and a “water pool radius”.6,46,50 However, estimates of rAOT used for this purpose ranged from 7 – 15 Å,6,8,46,47,49,51 and most were based on assumptions that the simulations show to be inaccurate (e.g. an extended conformation or a radial orientation for the aliphatic AOT chains). Nearest distance metrics (Figure 9) show that the density of CH3 groups at the end of AOT (i.e. AOT terminal) anions is maximal 8.5 Å outside of the SO3 groups. Therefore, the thickness of AOT anion layer appears to be 8.5 Å plus the radius of an SO3 head group (~3.1 Å) and the radius of a CH3 group (~2.3 Å), or rAOT ≈ 13.9 Å. To calculate rh, the semi-axes a and c of the RM62 aqueous core were determined as 31.4, 14.5, and 12.3 Å respectively by solving equations 2–4 for a′, b′, and c′. Therefore, the simulations suggest that rh = 30.7 Å (the sum of (a′ c′2)1/3, ~16.8 Å and the rAOT, which is within the range of published experimental values.
Table 4.
Interpolated values of rh for W0 = 7.5 from published experimental studies and the value of rh from the RM62 simulations.*
| rh (Å) | Technique | Reference |
|---|---|---|
| 26 | FRAPP | Chatenay et al.44 |
| 27 | DLS | Bohidar and Behboudnia40 |
| 28 | DLS | Vasquez et al.45 |
| 31 | Viscosity measurements | Kinugasa et al.46** |
| 29 | FCS | Pal et al.47 |
| 30 | DLS | Nazario et al.48 |
| 31 | PCS | Zulauf and Eicke49 |
| 30 | MD simulations | Eskici and Axelsen |
DLS – dynamic light scattering. FRAPP – fluorescence recovery after fringe pattern photobleaching. FCS – fluorescence correlation spectroscopy. PCS – photon correlation spectroscopy.
rh was estimated from Kinugasa et al.46 by assuming rAOT = 13.9 Å.
Extrapolation to other values of W0
The size of an RM “core” is here defined as the locus of points representing the centers of the AOT sulfonate head groups (rcore). This core would contain nwater water molecules, nAOT sodium cations, and approximately half the volume of the nAOT SO3 groups. Assuming an overall density of ρ, the approximate volume of such a core is given by
| (7-a) |
where mwater, msodium, and msulfonate are the molar masses of water, sodium cations, and sulfonate anions, respectively. Given an average molecular volume for core components, v̄, equation 7-a simplifies to
| (7-b) |
given the key assumption that the RM core is spherical in shape. The surface area of this core, Acore, is given by
| (7-c) |
where aAOT is the surface area covered by an AOT anion, and its volume-to-surface-area ratio is given by
| (7-d) |
Equation 7-d illustrates the basis for a linear relationship between W0 and rcore, and the use of linear extrapolations when calculating intermediate results in tabulated data. It follows that the number of AOT per RM is given by
| (7-e) |
Given W0 = 7.5, nAOT = 62 (from this study), and ρ = 1.1 g/cm3 (estimated from 2014 Du et al),52 equation 7-a yields Vcore 18,414 Å2. Equation 7-b yields v̄ = 33 Å3 per molecule, and rcore = 16.4 Å. Equation 7-c yields aAOT = 54.4 Å2, close to the published estimate of 55 Å2.
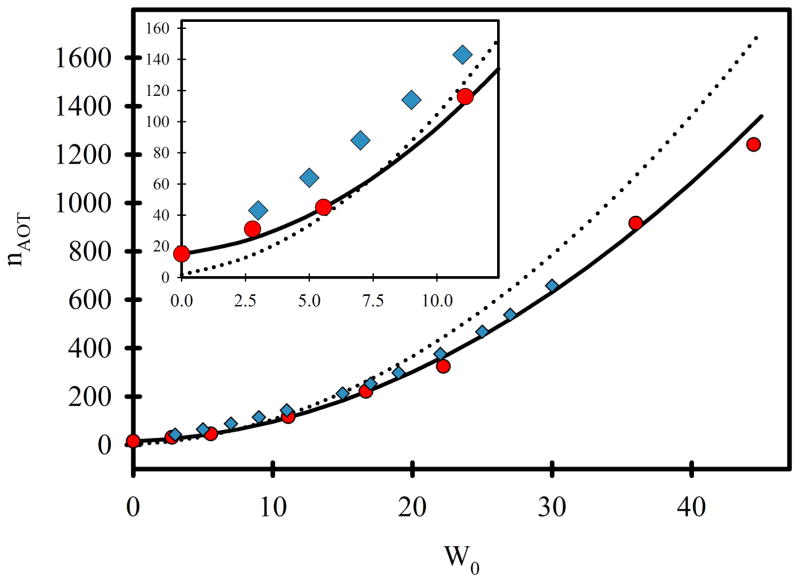
A graph of nAOT versus W0 (equation 7-e, Figure 11, dotted line) compared to the published experimental data of Eicke and Rehak (red dots)53 and of Amararene et al. (blue diamonds)6 shows that agreement away from W0 = 7.5 is poor. In particular, equation 7-e fails to predict the experimentally observed value of nAOT = 15 for W0 = 0, and it overestimates nAOT by 37% for W0 = 45. This discrepancy suggests that a “dry” term must be added to equation 7-e in the form of to correct for the number of AOT molecules in a water-free RM. With that correction, and an increase in aAOT to 59.1 Å2, equation 7-f agrees with the entire range of results from Eicke and Rehak, and the results of Amararene et al. beyond W0 = 15 (Figure 11, solid line).
Figure 11.
Extrapolated results for various W0 and comparison with experimental studies. Solid line – nAOT values obtained from equation 7-f which include the “dry” term and a slightly larger value of aAOT . Dotted line – nAOT values obtained from equation 7-e. Red circles – the published experimental data of Eicke and Rehak.53 Blue diamonds – the published experimental results of Amararene et al.6
| (7-f) |
RM preparations may be characterized experimentally by a radius polydispersity index (γ), and reported values range from 0.065 to 0.30,5–12 although only the value of γ = 0.15 from Amararene et al. was measured in isoO.6 This index may be converted into a standard deviation for the distribution of radii using equation 8:
| (8) |
where σ is the standard deviation of rcore. Assuming that γ = 0.15, equation 8 suggests that σ = 2.5 Å for rcore, while equation 7-f suggests that nAOT ranges from 43 to 79 for RMs with rcore = 16.6 ± 2.5 Å.
DISCUSSION
The chief result of this investigation is quantitative insight into the relationship between W0 and the size of a RM in the commonly used water/AOT/isooctane system. It has long been appreciated that there is a linear relationship between W0 and RM radius, justified largely in geometric terms (as per eq. 7-d) above. However, widely divergent slopes have been proposed for this relationship, and it has not been clear how to infer the number of AOT molecules in an RM from the radius information that such slopes provide. The results in this study suggest that RMs with a W0 = 7.5 most likely contain 62 AOT molecules per RM, which is in agreement with published experimental measurements of SAXS, light scattering, and transport rates after considering the nature of the information provided by these techniques. From this benchmark, nAOT for W0 ranging from 0 to 45 may be predicted from equation 7-f, also in excellent agreement with experimental results. Finally, our analysis suggests that systems with W0 = 7.5 should have a second moment distribution of radii that corresponding to nAOT from 43 to 79 (calculated using equations 7f and 8).
A second important result from this study is a physicochemical explanation for the relationship between W0 and nAOT, and for the expectation that each value of W0 has a value of nAOT where the AOT energy is a minimum. The AOT energy has three main components: (1) the electrostatic repulsion between anionic AOT head groups (Figure 4A), (2) the electrostatic repulsion between sodium cations (Figure 4B), (3) the electrostatic attraction between sodium cations and anionic AOT head groups (Figure 4C). To some extent, the interaction energies between the AOT anion and isoO also favor smaller RMs at constant W0 (Figure 4D). These energies are primarily due to VdW interactions, which may increase in magnitude in smaller RMs because curvature – and hence, the wedge-shaped gaps in the AOT layer into which isoO may penetrate – is greater in smaller RMs. The fits to the data in Figure 4 help illustrate trends in the data, such as the tendency for repulsive interactions to favor smaller RMs, and for attractive interactions to favor larger RMs at constant W0. Overall, results indicate that the size of an RM is determined primarily by a balance between these attractive and repulsive interactions, and the availability of water to screen them (Figure 7).
A third result from this study is the ability to reconcile experimental results that are reported in units that are difficult to interconvert, such as radius-of-gyration, hydrodynamic radius, and aggregation number. Widely discrepant experimental results have been noted for some time,13,23,27 but upon close examination some of these discrepancies may be attributed to differences in solvents46 or temperature.27 Other discrepancies are due to linear interpolation between nAOT vs W0 when a nonlinear interpolation is needed, or to a comparison of rg and rcore without suitable conversion.13 Most of the remaining studies may be reconciled by a well-informed estimation of the surfactant layer thickness. The value of rAOT ≈ 13.9 Å suggested by the simulations helps reconcile published values with each other and revise previously calculated values for rcore . In general, simulations are essential for interpreting experimentally derived values such as rg and rh in terms of the nAOT for an RM.
A fourth result is insight into the shape and internal organization of an RM. Deviations from spherical shape observed in these simulations are significant to an understanding of RM size and other characteristics observed in experimental studies. For example, the simulations show that the distributions of water and AOT overlap to a large extent, so that nAOT and hence, the size of an RM in terms of the number of its component molecules, is not easily derived from any of the experimentally derived radii defined in Table 2.
A fifth result is insight into the mechanism of water exchange between RMs. Intermicellar exchange has been demonstrated experimentally, but has not been reported in previous all-atom RM simulations.23–25,27,45 It has been suggested that the mechanism of intermicellar water exchange involves sequential fusion and fission of RMs,54 or channels forming during micellar collisions.55,56 However, the simulations demonstrate that the AOT anion facilitates the loss and gain of individual water molecules from an RM, most likely by creating a population of water molecules with an energy that is intermediate between the aqueous and isooctane phases. This population is evident from the nearest distance metrics which show extensive overlap of the water, AOT anion, and isoO distributions (Figure 9).
It should be noted that the simulations in this study were performed nominally at 300K, but they are being compared to experimental studies at 293 or 298K. While it would have been a simple matter to adjust the simulation temperature to the temperatures of the experiments, the simulation parameters have been optimized for 300K. There is no simple way to adjust a parameter set so that is valid at other temperatures. More importantly, perhaps, there may be no need to make this adjustment because experimentally determined rh values did not change over temperatures ranging from 288°K to 318°K.48,49 The accuracy of common parameter sets has also been questioned because of the high concentrations found in RM systems,57 although the reported inaccuracies were manifest in properties not examined in this study.
Finally, this study provides a starting point for the accurate simulation of materials encapsulated in RMs. There are significant differences in the interpretation of RM properties, with or without protein inside, in the literature. Although many experimental studies are interpreted with the assumption of an idealized spherical geometry of the RM, most computational studies support the conclusion that encapsulated materials do not experience the conditions of a hard spherical confinement.25,32 Moreover, encapsulated material will likely increase the volume and surface area of an RM. The need for extra surfactant to cover the increased surface area may be met by (1) the coalescence of RMs with same W0 ratio, which would result in a larger RM with same W0 ratio (2) the acquisition of surfactant from other RMs, which would result in a smaller W0, (3) the replacement of water with the encapsulated material, which would negate the need for additional surfactant but result in a smaller W0, or (4) situating portions of the encapsulated material at the interface to substitute for surfactant. In any of these possibilities, the AOT energy would be determined by not only by electrostatic interactions between surfactant, sodium cations, and water but also by the physicochemical characteristics of the encapsulated material. Simulation studies of encapsulation are needed to explore these possibilities.
CONCLUSION
An RM with W0 = 7.5 appears to be most stable when nAOT = 62, and this relationship is determined by a balance of electrostatic forces that are modulated by the dielectric effect of encapsulated water. Most importantly, the RM62 system corresponds precisely to most of the experimental data available for RMs made with AOT and a W0 = 7.5. From this benchmark value, nAOT may be calculated for a wide range of W0 values in close agreement with experimental data. The information obtained from simulations about RM structure and organization enables helps reconcile many of the seemingly inconsistent experimental results about RM size.
Acknowledgments
This work used the Extreme Science and Engineering Discovery Environment (XSEDE), which is supported by National Science Foundation grant number ACI-1053575. Primary research support provided by GM76201 from the NIGMS. Valuable discussions with Kim Sharp and Steve Harvey are gratefully acknowledged.
Footnotes
Conflict of Interest
The authors declare that they have no conflicts of interest with the content of this article.
References
- 1.Walde P, Giuliani AM, Boicelli CA, Luisi PL. Phospholipid-Based Reverse Micelles. Chem Phys Lipids. 1990;53:265–288. doi: 10.1016/0009-3084(90)90026-n. [DOI] [PubMed] [Google Scholar]
- 2.Zhou HX. Protein Folding in Confined and Crowded Environments. Arch Biochem Biophys. 2008;469:76–82. doi: 10.1016/j.abb.2007.07.013. [DOI] [PMC free article] [PubMed] [Google Scholar]
- 3.Yeung PSW, Eskici G, Axelsen PH. Infrared Spectroscopy of Proteins in Reverse Micelles. BBA Biomemb. 2013;1828:2314–2318. doi: 10.1016/j.bbamem.2012.10.019. [DOI] [PMC free article] [PubMed] [Google Scholar]
- 4.Vandijk MA, Joosten JGH, Levine YK, Bedeaux D. Dielectric Study of Temperature-Dependent Aerosol Ot/Water Isooctane Microemulsion Structure. J Phys Chem. 1989;93:2506–2512. [Google Scholar]
- 5.Ricka J, Borkovec M, Hofmeier U. Coated Droplet Model of Microemulsions - Optical Matching and Polydispersity. J Chem Phys. 1991;94:8503–8509. [Google Scholar]
- 6.Amararene A, Gindre M, Le Huerou JY, Urbach W, Valdez D, Waks M. Adiabatic Compressibility of AOT [Sodium Bis(2-Ethylhexyl)Sulfosuccinate] Reverse Micelles: Analysis of a Simple Model Based an Micellar Size and Volumetric Measurements. Phys Rev E. 2000;61:682–689. doi: 10.1103/physreve.61.682. [DOI] [PubMed] [Google Scholar]
- 7.Kotlarchyk M, Chen SH, Huang JS. Temperature-Dependence of Size and Polydispersity in A 3-Component Micro-Emulsion by Small-Angle Neutron-Scattering. J Phys Chem. 1982;86:3273–3276. [Google Scholar]
- 8.Kotlarchyk M, Chen SH, Huang JS, Kim MW. Structure of 3-Component Microemulsions in the Critical Region Determined by Small-Angle Neutron-Scattering. Phys Rev A. 1984;29:2054–2069. [Google Scholar]
- 9.Robertus C, Philipse WH, Joosten JGH, Levine YK. Solution of the Percus-Yevick Approximation of the Multicomponent Adhesive Spheres System Applied to the Small-Angle X-Ray-Scattering From Microemulsions. J Chem Phys. 1989;90:4482–4490. [Google Scholar]
- 10.Farago B, Richter D, Huang JS, Safran SA, Milner ST. Shape and Size Fluctuations of Microemulsion Droplets - the Role of Cosurfactant. Phys Rev Lett. 1990;65:3348–3351. doi: 10.1103/PhysRevLett.65.3348. [DOI] [PubMed] [Google Scholar]
- 11.Robinson BH, Toprakcioglu C, Dore JC, Chieux P. Small-Angle Neutron-Scattering Study of Microemulsions Stabilized by Aerosol-Ot .1. Solvent and Concentration Variation. J Chem Soc Farad Trans I. 1984;80:13–27. [Google Scholar]
- 12.Yan YD, Clarke JHR. Dynamic Light-Scattering From Concentrated Water-In-Oil Microemulsions the Coupling of Optical and Size Polydispersity. J Chem Phys. 1990;93:4501–4509. [Google Scholar]
- 13.Martinez AV, Dominguez L, Malolepsza E, Moser A, Ziegler Z, Straub JE. Probing the Structure and Dynamics of Confined Water in AOT Reverse Micelles. J Phys Chem B. 2013;117:7345–7351. doi: 10.1021/jp402270e. [DOI] [PMC free article] [PubMed] [Google Scholar]
- 14.Nevidimov AV. Molecular Dynamics Simulation of Reverse Micelles: Standing Problems After 25 Years of Research. Rus J Phys Chem B. 2014;8:554–558. [Google Scholar]
- 15.Faeder J, Ladanyi BM. Molecular Dynamics Simulations of the Interior of Aqueous Reverse Micelles. J Phys Chem B. 2000;104:1033–1046. [Google Scholar]
- 16.Faeder J, Ladanyi BM. Solvation Dynamics in Aqueous Reverse Micelles: A Computer Simulation Study. J Phys Chem B. 2001;105:11148–11158. [Google Scholar]
- 17.Faeder J, Ladanyi BM. Solvation Dynamics in Reverse Micelles: The Role of Headgroup-Solute Interactions. J Phys Chem B. 2005;109:6732–6740. doi: 10.1021/jp045202m. [DOI] [PubMed] [Google Scholar]
- 18.Brodskaya EN, Mudzhikova GV. Molecular Dynamics Simulation of AOT Reverse Micelles. Mol Phys. 2006;104:3635–3643. [Google Scholar]
- 19.Rosenfeld DE, Schmuttenmaer CA. Dynamics of the Water Hydrogen Bond Network at Ionic, Nonionic, and Hydrophobic Interfaces in Nanopores and Reverse Micelles. J Phys Chem B. 2011;115:1021–1031. doi: 10.1021/jp109599q. [DOI] [PubMed] [Google Scholar]
- 20.Rosenfeld DE, Schmuttenmaer CA. Dynamics of Water Confined Within Reverse Micelles. J Phys Chem B. 2006;110:14304–14312. doi: 10.1021/jp060552p. [DOI] [PubMed] [Google Scholar]
- 21.Rodriguez J, Marti J, Guardia E, Laria D. Protons in Non-Ionic Aqueous Reverse Micelles. J Phys Chem B. 2007;111:4432–4439. doi: 10.1021/jp0703410. [DOI] [PubMed] [Google Scholar]
- 22.Pomata MHH, Laria D, Skaf MS, Elola MD. Molecular Dynamics Simulations of AOT-Water/Formamide Reverse Micelles: Structural and Dynamical Properties. J Chem Phys. 2008:129. doi: 10.1063/1.3042275. [DOI] [PubMed] [Google Scholar]
- 23.Abel S, Sterpone F, Bandyopadhyay S, Marchi M. Molecular Modeling and Simulations of AOT-Water Reverse Micelles in Isooctane: Structural and Dynamic Properties. J Phys Chem B. 2004;108:19458–19466. [Google Scholar]
- 24.Chowdhary J, Ladanyi BM. Molecular Dynamics Simulation of Aerosol-OT Reverse Micelles. J Phys Chem B. 2009;113:15029–15039. doi: 10.1021/jp906915q. [DOI] [PubMed] [Google Scholar]
- 25.Abel S, Waks M, Marchi M. Molecular Dynamics Simulations of Cytochrome c Unfolding in AOT Reverse Micelles: The First Steps. Eur Phys J E. 2010;32:399–409. doi: 10.1140/epje/i2010-10635-x. [DOI] [PubMed] [Google Scholar]
- 26.Mills AJ, Wilkie J, Britton MM. NMR and Molecular Dynamics Study of the Size, Shape, and Composition of Reverse Micelles in a Cetyltrimethylammonium Bromide (CTAB)/n-Hexane/Pentanol/Water Microemulsion. J Phys Chem B. 2014;118:10767–10775. doi: 10.1021/jp504585k. [DOI] [PubMed] [Google Scholar]
- 27.Marchi M, Abel S. Modeling the Self-Aggregation of Small AOT Reverse Micelles From First-Principles. J Phys Chem Lett. 2015;6:170–174. doi: 10.1021/jz5023619. [DOI] [PubMed] [Google Scholar]
- 28.Phillips JC, Braun R, Wang W, Gumbart J, Tajkhorshid E, Villa E, Chipot C, Skeel RD, Kale L, Schulten K. Scalable Molecular Dynamics With NAMD. J Comp Chem. 2005;26:1781–1802. doi: 10.1002/jcc.20289. [DOI] [PMC free article] [PubMed] [Google Scholar]
- 29.Foloppe N, MacKerell AD., Jr All-Atom Empirical Force Field for Nucleic Acids: I. Parameter Optimization Based on Small Molecule and Condensed Phase Macromolecular Target Data. J Comp Chem. 2000;21:86–104. [Google Scholar]
- 30.Jorgensen WL, Chandrasekhar J, Madura JD, Impey RW, Klein ML. Comparison of Simple Potential Functions for Simulating Liquid Water. J Chem Phys. 1983;79:926–935. [Google Scholar]
- 31.Tian JH, Garcia AE. Simulations of the Confinement of Ubiquitin in Self-Assembled Reverse Micelles. J Chem Phys. 2011:134. doi: 10.1063/1.3592712. [DOI] [PMC free article] [PubMed] [Google Scholar]
- 32.Martinez AV, Malolepsza E, Rivera E, Lu Q, Straub JE. Exploring the Role of Hydration and Confinement in the Aggregation of Amyloidogenic Peptides A Beta(16–22) and Sup35(7–13) in AOT Reverse Micelles. J Chem Phys. 2014:141. doi: 10.1063/1.4902550. [DOI] [PMC free article] [PubMed] [Google Scholar]
- 33.Darden T, York D, Pedersen L. Particle Mesh Ewald - An N.Log(N) Method for Ewald Sums in Large Systems. J Chem Phys. 1993;98:10089–10092. [Google Scholar]
- 34.Feller SE, Zhang Y, Pastor RW, Brooks BR. Constant Pressure Molecular Dynamics Simulation: the Langevin Piston Method. J Chem Phys. 1995;103:4613–4621. [Google Scholar]
- 35.Towns J, Cockerill T, Dahan M, Foster I, Gaither K, Grimshaw A, Hazlewood V, Lathrop S, Lifka D, Peterson GD, et al. XSEDE: Accelerating Scientific Discovery. Comp Sci Eng. 2014;16:62–74. [Google Scholar]
- 36.Humphrey W, Dalke A, Schulten K. VMD: Visual Molecular Dynamics. J Mol Graph Model. 1996;14:33–38. doi: 10.1016/0263-7855(96)00018-5. [DOI] [PubMed] [Google Scholar]
- 37.Fuglestad B, Gupta K, Wand AJ, Sharp KA. Characterization of Cetyltrimethylammonium Bromide/Hexanol Reverse Micelles by Experimentally Benchmarked Molecular Dynamics Simulations. Langmuir. 2016;32:1674–1684. doi: 10.1021/acs.langmuir.5b03981. [DOI] [PubMed] [Google Scholar]
- 38.Vierros S, Sammalkorpi M. Phosphatidylcholine Reverse Micelles on the Wrong Track in Molecular Dynamics Simulations of Phospholipids in an Organic Solvent. J Chem Phys. 2015;142:094902. doi: 10.1063/1.4914022. [DOI] [PubMed] [Google Scholar]
- 39.van Holde KE, Johnson WC, Ho PS. Principles of Physical Biochemistry. 2. Pearson Prentice Hall; Upper Saddle River, N.J: 2006. [Google Scholar]
- 40.Bohidar HB, Behboudnia M. Characterization of Reverse Micelles by Dynamic Light Scattering. Coll Surf A. 2001;178:313–323. [Google Scholar]
- 41.Yano J, Furedi-Milhofer H, Wachtel E, Garti N. Crystallization of Organic Compounds in Reversed Micelles. I. Solubilization of Amino Acids in Water-Isooctane-AOT Microemulsions. Langmuir. 2000;16:9996–10004. [Google Scholar]
- 42.Yano J, Furedi-Milhofer H, Wachtel E, Garti N. Crystallization of Organic Compounds in Reversed Micelles. II. Crystallization of Glycine and L-Phenylalanine in Water-Isooctane-AOT Microemulsions. Langmuir. 2000;16:10005–10014. [Google Scholar]
- 43.Hirai M, Kawaihirai R, Yabuki S, Takizawa T, Hirai T, Kobayashi K, Amemiya Y, Oya M. Aerosol-Ot Reversed Micellar Formation at Low Water-Surfactant Ratio Studied by Synchrotron-Radiation Small-Angle X-Ray-Scattering. J Phys Chem. 1995;99:6652–6660. [Google Scholar]
- 44.Chatenay D, Urbach W, Nicot C, Vacher M, Waks M. Hydrodynamic Radii of Protein-Free and Protein-Containing Reverse Micelles As Studied by Fluorescence Recovery After Fringe Photobleaching - Perturbations Introduced by Myelin Basic-Protein Uptake. J Phys Chem. 1987;91:2198–2201. [Google Scholar]
- 45.Vasquez VR, Williams BC, Graeve OA. Stability and Comparative Analysis of AOT/Water/Isooctane Reverse Micelle System Using Dynamic Light Scattering and Molecular Dynamics. J Phys Chem B. 2011;115:2979–2987. doi: 10.1021/jp109202f. [DOI] [PubMed] [Google Scholar]
- 46.Kinugasa T, Kondo A, Nishimura S, Miyauchi Y, Nishii Y, Watanabe K, Takeuchi H. Estimation for Size of Reverse Micelles Formed by AOT and SDEHP Based on Viscosity Measurement. Coll Surf A. 2002;204:193–199. [Google Scholar]
- 47.Pal N, Verma SD, Singh MK, Sen S. Fluorescence Correlation Spectroscopy: An Efficient Tool for Measuring Size, Size-Distribution and Polydispersity of Microemulsion Droplets in Solution. Anal Chem. 2011;83:7736–7744. doi: 10.1021/ac2012637. [DOI] [PubMed] [Google Scholar]
- 48.Nazario LMM, Hatton TA, Crespo JPSG. Nonionic Cosurfactants in AOT Reversed Micelles: Effect on Percolation, Size, and Solubilization Site. Langmuir. 1996;12:6326–6335. [Google Scholar]
- 49.Zulauf M, Eicke HF. Inverted Micelles and Microemulsions in the Ternary-System H2O-Aerosol-Ot-Isooctane As Studied by Photon Correlation Spectroscopy. J Phys Chem. 1979;83:480–486. [Google Scholar]
- 50.Maitra A. Determination of Size Parameters of Water Aerosol Ot Oil Reverse Micelles From Their Nuclear Magnetic-Resonance Data. J Phys Chem. 1984;88:5122–5125. [Google Scholar]
- 51.Almgren M, Johannsson R, Eriksson JC. Polydispersity of Aot Droplets Measured by Time-Resolved Fluorescence Quenching. J Phys Chem. 1993;97:8590–8594. [Google Scholar]
- 52.Du CF, He W, Yin TX, Shen WG. Volumetric Properties of Water/AOT/Isooctane Microemulsions. Langmuir. 2014;30:15135–15142. doi: 10.1021/la5041344. [DOI] [PubMed] [Google Scholar]
- 53.Eicke HF, Rehak J. Formation of Water-Oil-Microemulsions. Helv Chim Acta. 1976;59:2883–2891. [Google Scholar]
- 54.Fletcher PDI, Howe AM, Robinson BH. The Kinetics of Solubilisate Exchange Between Water Droplets of A Water-In-Oil Microemulsion. J Chem Soc Farad Trans I. 1987;83:985–1006. [Google Scholar]
- 55.Jada A, LANG J, Zana R. Relation Between Electrical Percolation and Rate-Constant for Exchange of Material Between Droplets in Water in Oil Microemulsions. J Phys Chem. 1989;93:10–12. [Google Scholar]
- 56.Howe AM, Mcdonald JA, Robinson BH. Fluorescence Quenching As A Probe of Size Domains and Critical Fluctuations in Water-In-Oil Microemulsions. J Chem Soc Farad Trans I. 1987;83:1007–1027. [Google Scholar]
- 57.Goh GB, Eike DM, Murch BP, Brooks CL. Accurate Modeling of Ionic Surfactants at High Concentration. J Phys Chem B. 2015;119:6217–6224. doi: 10.1021/acs.jpcb.5b01765. [DOI] [PubMed] [Google Scholar]


