

Abstract
The optimal dose of vitamin D to optimize bone metabolism in the elderly is unclear. We tested the hypothesis a vitamin D, at a dose higher than recommended by the Institute of Medicine (IOM), has a beneficial effect on bone remodeling and mass. In this double blind trial we randomized 257 overweight elderly subjects to receive 1000 mg of elemental calcium citrate/day, and the daily equivalent of 3,750IU/day or 600 IU/day of vitamin D3 for one year. The subjects’ mean age was 71±4 years, body mass index 30±4 kg/m2, 55% were women, and 222 completed the 12-months follow-up. Mean serum 25 hydroxy-vitamin D (25OHD) was 20 ng/ml, and rose to 26 ng/ml in the low dose, and 36ng/ml in the high dose arm, at one year (p<0.05). Plasma parathyroid hormone, osteocalcin, and C-terminal telopeptide (Cross Laps) levels decreased significantly by 20–22% in both arms, but there were no differences between the two groups for any variable, at 6 or 12 months, with the exception of serum calcitriol that was higher in the high-dose group at 12 months. Bone mineral density (BMD) increased significantly at total hip and lumbar spine, but not femoral neck, in both arms, while subtotal body BMD increased in the high-dose group only, at one year. However, there were no significant differences in percent change BMD between the 2 arms at any skeletal site. Subjects with serum 25OHD below 20 ng/ml and PTH level above 76 pg/ml, showed a trend for higher BMD increments at all skeletal sites, in the high-dose group, that reached significance at the hip. Adverse events were comparable in the two study arms. This controlled trial demonstrates little additional benefit in vitamin D supplementation at a dose exceeding the IOM recommendation of 600IU/day on BMD and bone markers, in overweight elderly individuals.
Keywords: Elderly, high dose vitamin D, bone mineral density (BMD), bone markers, IOM
INTRODUCTION
Vitamin D insufficiency is prevalent worldwide, and considered as a public health issue.(1–9) In elderly populations, inadequate vitamin D levels have been associated with low bone density, poor muscle function, increased risk of falls and osteoporotic fractures. Adequate calcium and vitamin D supplementation has been shown to reduce bone loss, and the risk of falls and fractures in older individuals.(10–16) Excess vitamin D supplementation may incur adverse health outcomes and can increase health care costs.(2,17–18)
Serum 25-hydroxyvitamin D (25OHD) concentration is the recommended biomarker for vitamin D nutritional status, but the desirable serum 25OHD concentration to optimize bone health in elderly subjects remains unclear. The Institute of Medicine (IOM) panel identified 19 studies assessing the relationship between serum 25OHD levels and BMD in postmenopausal women and elderly men, and concluded that “there was fair evidence to support an association between serum 25OHD levels and BMD or changes in BMD at the femoral neck”. Indeed, the panel recognized the limitations of the evidence available to make recommendations on desirable vitamin D levels in the elderly with regards to bone mineral density (BMD) and fractures. Serum concentrations of 25OHD below which bone loss at the hip increased ranged from 30 to 80 nmol/L.(18–19) The variability in serum 25OHD levels in randomized trials led the IOM to use observational studies instead to derive their desirable level.(20) Finally, the recommended dose of 400–600IU/day may not be sufficient to raise vitamin D to the desirable range in individuals with baseline low levels.(10,21)
This randomized controlled trial was conducted to test the hypothesis that vitamin D, at a dose higher than recommended by the IOM, would more beneficial to bone health in elderly overweight individuals.
METHODS
Study Design
This study is a randomized double-blind, controlled trial, conducted at the American University of Beirut Medical Center (AUBMC), St Joseph University Hospital, and Rafic Hariri Governmental University Hospital, comparing supplementation with vitamin D at the currently recommended dose by the IOM and a high dose that is below the upper tolerable level.(22) Recruitment, pre-screening, and screening procedures were performed at all centers between January 2011 and July 2013, while enrollment and protocol implementation were exclusively conducted at AUBMC. The study ended in July 2014. The trial identifier on ClinicalTrials.gov is NCT01315366.(23)
Study Drug
All subjects received four tablets of calcium citrate (250 mg Calcium and 125IU vitamin D3/tab) for a total of 1000 mg elemental calcium and 500 IU vitamin D3 taken daily. Additionally, each subject received 2 pills, identical in shape, color, size, smell and taste, to be taken once a week, that consisted of either placebo (low dose group) or 10,000 IU/tab of vitamin D3 [Euro D, 10,000 IU/tab, (high dose group)]. All tablets were provided by Europharm, Canada.
It was previously shown that vitamin D administered daily or weekly, at equivalent daily doses, resulted in comparable serum 25OHD levels in elderly individuals(24). Based on the certificate of analysis provided by Europharm to the Canadian regulatory agencies for all trial lots, the actual average vitamin D content of the calcium citrate/D tablets was 150 IU/pill, and 11,000 IU/pill for the Euro D tablets. Therefore, the total daily intake of vitamin D in the low and high dose groups was 600IU/day and 3,750 IU/day, respectively. The study drugs were stored and dispensed to subjects in identical boxes at the AUBMC central pharmacy.
The randomization and allocation sequence was implemented by the senior pharmacist at AUBMC, with stratification by center and gender.(22) Allocation was based on a simple randomization approach, was concealed, and all study team members and participants were blinded to drug assignment, until trial and data entry completion.
The Institutional Review Board (IRB) at each center approved the protocol, and all participants provided written informed consent. An external Data Safety Monitoring Board, (DSMB, see Acknowledgements), reviewed the final protocol and monitored the trial safety.
Participants
Elderly (defined as ≥65 years), overweight (defined as body mass index (BMI) >25 kg/m2), and ambulatory subjects with a serum 25OHD between 10 and 30 ng/ml at screening, were recruited through the out-patient departments, clinics, and advertisements posted at the three major teaching hospitals, as well as health dispensaries of the Ministry of Social Affairs, in the greater Beirut Area.
Because one of the primary end-points was insulin resistance,(22) exclusion criteria included pre-diabetes if on oral hypoglycemic drugs, diabetes [fasting plasma glucose (FPG)] ≥126 mg/dl or HbA1c ≥ 6.5%), severe chronic diseases, or major organ failure. The latter included severe heart failure (stage III or IV), liver failure and cirrhosis, kidney failure (estimated GFR<30 ml/min), cancer, and autoimmune diseases. Subjects were also excluded if they had conditions, or were on medications, known to affect bone metabolism, had osteomalacia, a history of kidney stones, fragility fractures, or a 10 years fracture risk for major osteoporotic fractures exceeding 10% based on FRAX Lebanon risk calculator at study entry using FRAX version 3.08 (https://www.shef.ac.uk/FRAX/tool.jsp).
Study Visits and Measurements
Enrolled subjects came in for visits every three months, during which height, weight and vital signs were measured, questionnaires administered, study drug bottles returned, and refills provided. Participants were also contacted by phone every 2 weeks to reinforce compliance with study drug. Information on adverse events, intake of medications, and study drug pill counts were obtained at each visit (0, 3, 6 and 12 months). Compliance was measured as a percentage of the full possible dose using pill count [(total number of study drugs pills taken/total number of pills provided for time intervals between study visits) ×100].
DXA measurements of the spine, hip, forearm and total body composition for fat mass and lean mass assessment are made on a Hologic 4,500A Horizon machine are (Hologic, Bedford, MA, USA). Precision estimates were based on duplicate scans obtained daily for each skeletal site, at our center. Precision estimates, expressed as CV%, were as follows: lumbar spine=0.34±0.26%, total hip=0.36±0.27%, and femoral neck 1.21±1.09%. These are well within the ISCD quality assurance recommendations.(25)
Routine chemistries, calciotropic hormones, and bone remodeling markers, were assayed at 0, 3, 6 and 12 months, depending on the variable. Blood samples were allowed to clot for 30 minutes, centrifuged for 20 minutes, and immediately processed for routine studies, or stored at −20°C within 2 hours, and then at −80°C, depending on the assay. Serum 25OHD was run using Liquid Chromatography Mass Spectroscopy (LCMS) at the Mayo Clinic Laboratories, Mayo, USA. The laboratory participates in 2 vitamin D quality assurance programs, DEQAS and the CDC VDSP. The LCMS methodology in that laboratory is directly traceable to NIST, Mayo Lab = 0.9599×NIST − 1.3716, R2 = 0.9922. Hormonal assays were run in batches at study completion, and samples drawn at serial time points for each hormone were included within the same assay, for each study subject (Appendix I for assay details).
Study Outcomes
The trial had two primary outcomes, indices of insulin resistance at 12 months, recently reported,(22) and of bone metabolism at 12 months we report here-in (bone mineral density and bone remodeling).(23)
The main outcome of interest is the difference in percent change in femoral neck BMD between the two treatment arms, a difference on which sample size calculations were performed, and is expressed as % change in FN BMD. The effect of vitamin D replacement on BMD was compared within and across the two treatment doses and, additionally, in pre-specified subgroup analyses, by: a) gender, and b) baseline vitamin D deficiency status, based on 25OHD and parathyroid hormone (PTH) thresholds of 20 ng/ml and 76pg/ml, respectively. We had previously shown in a prospective cohort of elderly individuals, with comparable baseline demographic characteristics, that combining vitamin D and PTH levels, was superior to 25OHD level alone, in predicting bone loss in the subgroup with baseline 25OHD < 20 ng/ml and PTH > 76 pg/ml. (26)
Sample size calculation
We calculated the sample size based on post-hoc analyses from a calcium vitamin D trial conducted in overweight elderly Caucasian subjects. (27) Based on an anticipated between-arms mean (standard deviation) difference in the femoral neck BMD of 3% (SD=5%), a power of 80%, and a significance level of 0.025 (taking into account 2 primary outcomes), the total sample size is 56 subjects per arm. Allowing for a possible estimated drop-out rate of 30%, we would need 75 subjects per arm. However, we enrolled 257 subjects to accommodate the larger sample size calculation requirements for the other primary outcome of insulin resistance.(22)
Statistical analyses
Given the nature of the primary outcome, % change FN BMD at 12 months, and the fact that we only measured BMD at baseline and 12 months only, with no interim analyses in between, we could not perform imputation analyses for missing data using the frequently used last observation carried forward approach. Furthermore, the number of subjects who dropped out were equally distributed between the 2 arms, and their characteristics similar to the total cohort. We therefore considered the planned intention-to-treat (ITT) analyses equivalent to the per-protocol analysis.
We used descriptive statistics, parametric (paired and independent t-tests, chi-squared test), non-parametric tests, and analysis of variance (ANOVA) to test for time trends, between and within treatment arms, (repeated measures ANOVA), as indicated. Results are expressed as means ± SD or N (%), for normally distributed variables. Normal distribution was evaluated by visual inspection of histograms and stem leaf plots, and log-transformation was performed, when appropriate. We implemented regression models to further investigate the impact of vitamin D treatment on the percent change total hip BMD at 1 year, after adjustment for relevant predictors, namely, age, baseline BMI, baseline 25OHD level, creatinine level at study entry. IBM SPSS software version 22.0 (SPSS, Chicago, Illinois), and SigmaPlot 12.0 (Systat Software Inc., San Jose, CA) were used. P<0.05 were considered statistically significant, and were not adjusted for multiplicity of testing for secondary outcomes.
RESULTS
Subjects and Baseline Characteristics
In total 129 elderly subjects were randomly assigned to receive high dose vitamin D and 128 to low dose vitamin D; 35 subjects (14%) did not complete the study with no outcome data available post study discontinuation (Figure 1, CONSORT). Patient characteristics, baseline data and co-morbidity in the 222 subjects did not differ from the original randomized group (data not shown). These were also similar for the low (N=112) versus high (N=110) dose vitamin D arms (Table 1; all comparisons non-significant). Briefly, subjects were 71.1±4.8 years old, had a BMI of 30.2±4.5 kg/m2, and 55% were females. Mean baseline 25OHD level was 20.4±7.4 ng/ml, and mean femoral neck T-score was −1.7±0.8, and the FRAX calculated 10 years risk for major osteoporotic fracture (MOF) was 5.4±2.6%, and for hip fracture and 1.9±1.5%. All other biochemical, skeletal and hormone levels, were comparable across treatment arms, in the overall group, and in the pre-specified sub-groups by gender and vitamin insufficiency at study entry (Table 1).
Figure 1.
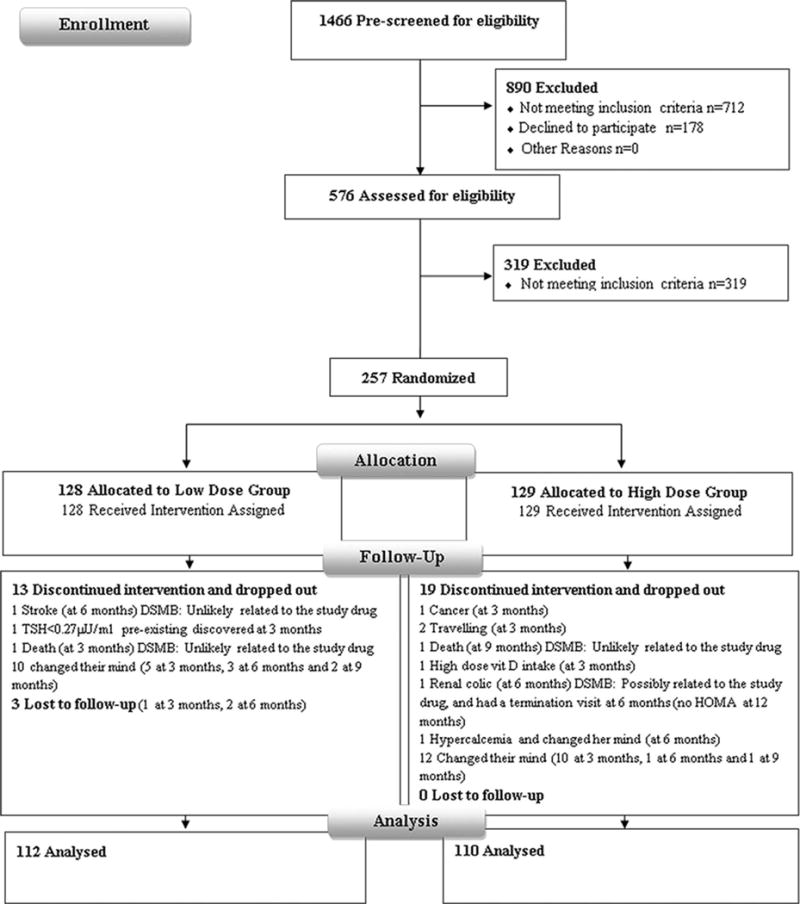
CONSORT flow diagram detailing recruitment status from pre-screening to study completion.
Table 1.
Baseline characteristics of the study subjects, overall, and by vitamin D dose allocation, in the total cohort or pre-specified subgroups*.
| Vitamin D Supplementation | Overall N=222 | Low Dose N=112 | High Dose N=110 | |
|---|---|---|---|---|
| Overall | N (%) or Mean ± SD | |||
|
| ||||
| Gender Female/Male | N | 123/99 | 60/52 | 63/47 |
| Age (years) | 71.1 ± 4.8 | 71.0 ± 4.7 | 71.2 ± 4.8 | |
| BMI (kg/m2) | 30.2 ± 4.5 | 29.7 ± 4.6 | 30.6 ± 4.4 | |
| Calcium & Vitamin D Supplement | 22 (10) | 11 (10) | 11 (10) | |
| Dietary Ca intake (mg/day) | 425 ± 292 | 453 ± 323 | 397 ± 257 | |
| Serum 25OHD (ng/ml) | 20.4 ± 7.4 | 20.0 ± 7 | 20.9 ± 8.2 | |
|
| ||||
| Sub-group by Gender | Overall | Low Dose | High Dose | |
|
| ||||
| Male | N | 99 | 52 | 47 |
|
| ||||
| Age (years) | 72.4 ± 5.5 | 72.1 ± 5.2 | 72.8 ± 5.8 | |
| BMI (kg/m2) | 28.7 ± 3.2 | 28.56 ± 3.16 | 28.89 ± 3.38 | |
| Calcium & Vitamin D Supplement | 1 (1) | 1 (1.9) | 0 (0) | |
| Dietary Ca intake (mg/day) | 413 ± 267 | 411 ± 256 | 415 ± 281 | |
| Serum 25OHD (ng/ml) | 19.5 ± 6.3 | 18.6 ± 6 | 20.4 ± 6.6 | |
|
| ||||
| Overall | Low Dose | High Dose | ||
|
| ||||
| Female | N | 123 | 60 | 63 |
|
| ||||
| Age (years) | 69.9 ± 3.7 | 69.9 ± 3.8 | 70 ± 3.6 | |
| BMI (kg/m2) | 31.5 ± 4.9 | 31.1 ± 5.3 | 31.8 ± 4.5 | |
| Calcium & Vitamin D Supplement | 21 (17.1) | 10 (16.6) | 11 (17.4) | |
| Dietary Ca intake (mg/day) | 425 ± 295 | 470 ± 342 | 384 ± 239 | |
| Serum 25OHD (ng/ml) | 21.1 ± 8.2 | 21.3 ± 7.5 | 20.9 ± 8.8 | |
|
| ||||
| Sub-group by Vitamin D-PTH cut-offs | Overall | Low Dose | High Dose | |
|
| ||||
| Vitamin D<20ng/ml and PTH>76pg/ml | N | 37 | 17 | 20 |
|
| ||||
| Age (years) | 71.2 ± 4.1 | 71.3 ± 4.2 | 71.2 ± 4.1 | |
| BMI (kg/m2) | 32.2 ± 5.2 | 31.28 ± 4.77 | 32.96 ± 5.54 | |
| Calcium & Vitamin D Supplement | 1 (2.7) | 0 (0) | 1(5) | |
| Dietary Ca intake (mg/day) | 419 ± 234.7 | 445 ± 202.4 | 397 ± 262 | |
| Serum 25OHD (ng/ml) | 14.1 ± 3.6 | 14.1 ± 3.1 | 14 ± 3.9 | |
There was no significant difference in any of the baseline characteristics by treatment group in the overall cohort or sub-groups.
p= independent t-test for continuous variables and chi-square for categorical variables between the two doses were not significant for any of the variables listed in the table.
Response to Vitamin D supplementation
Compliance with study drug, based on data in completers, was > 90%, for both calcium and vitamin D pills, overall, and by study visit, for both treatment arms. There was no change in mean weight, or BMI, by treatment allocation, at intermediate visits, or study completion (data not shown).
Serum 25OHD levels at 12 months
Compared to baseline levels, mean serum 25OHD levels had increased substantially by six months, with little additional increase by 12 months, in both groups. The levels increased from 20.9±8.2 to 36±9.7 ng/ml (p<0.0001) in the high dose group, and from 20.0±7.0 to 25.9±6.9 ng/ml (p<0.0001) in the low dose group, with more substantial increments in the former (p<0.0001) (Table 2, Fig 2). Serum 25OHD levels ≥20 ng/ml were achieved in a larger proportion of subjects in the high dose group (98%) as compared to the low dose group (83%, p<0.0001). The same was true for a cut off of ≥ 30 ng/ml, and it was reached by 70% of subjects in the high dose, and 25% of subjects in the low dose arm.
Table 2.
Biochemical and bone mineral density variables by study group at baseline, 12 months, and their changes at one year.
| Vitamin D Supplementation | |||||||
|---|---|---|---|---|---|---|---|
|
| |||||||
| Low dose | High dose | Independent T-test | |||||
|
| |||||||
| Baseline | 12 months | %change 12months† | Baseline | 12 months | %change 12months | p-value % change Hi vs Lo | |
| a. Biochemical Variables | |||||||
|
| |||||||
| Serum 25OHD ng/ml | 20.0 ± 7 | 25.9 ± 6.9* | 44.0 ± 58.22 | 20.9 ± 8.2 | 36.0 ± 9.7* | 95.5 ± 91.8 | <0.0001 |
| Calcium (mg/dl) | 9.4 ± 0.4 | 9.5 ± 0.4 | 1.1 ± 4.2 | 9.5 ± 0.4 | 9.6 ± 0.4 | 1.1 ± 3.5 | 0.912 |
| Creatinine (mg/dl) | 0.8 ± 0.2 | 0.9 ± 0.3 | 7.1 ± 18.3 | 0.8 ± 0.2 | 0.9 ± 0.3 | 6.9 ± 27.3 | 0.937 |
| Phosphorus (mg/dl) | 3.4 ± 0.5 | 3.4 ± 0.5 | 0.8 ± 14.3 | 3.4 ± 0.4 | 3.4 ± 0.4 | −0.8 ± 10.9 | 0.324 |
| 1,25 (OH)2 D (pg/ml) | 48.6 ± 15.4 | 40.9 ± 12.3 | −9.0 ± 31.8 | 50.4 ± 17.9 | 45.3 ± 12.8 | −2.3 ± 31.7 | 0.171 |
| Parathyroid Hormone (pg/ml) | 69 ± 33 | 57.4 ± 23.2* | −9.8 ± 33.0 | 67 ± 33 | 54 ± 25.3* | −9.4 ± 41.3 | 0.938 |
| Osteocalcin (ng/ml) | 23.8 ± 9 | 18.5 ± 6.9* | −19.7 ± 22.4 | 23.2 ± 7.8 | 19.1 ± 6.1* | −12.2 ± 33.9 | 0.059 |
| Cross Laps (ng/ml) | 0.37 ± 0.16 | 0.284 ± 0.139* | −19.4 ± 34.9 | 0.39 ± 0.15 | 0.317 ± 0.139* | −13.4 ± 41.8 | 0.253 |
|
| |||||||
| b. Bone Mineral Density | |||||||
|
| |||||||
| Left Hip | |||||||
| Total Hip BMD (g/cm2) | 0.826 ± 0.119 | 0.831 ± 0.121 | 0.5 ± 2.26* | 0.824 ± 0.118 | 0.828 ± 0.118 | 0.47 ± 2.22* | 0.909 |
| Femoral Neck BMD (g/cm2) | 0.676 ± 0.102 | 0.682 ± 0.100 | 0.55 ± 3.78 | 0.671 ± 0.101 | 0.675 ± 0.099 | 0.66 ± 4.16 | 0.833 |
| Lumbar spine BMD (g/cm2) | 0.886 ± 0.154 | 0.901 ± 0.162 | 1.34 ± 3.42* | 0.890 ± 0.150 | 0.900 ± 0.145 | 1.65 ± 3.21* | 0.512 |
| Subtotal BMD (g/cm2)** | 0.890 ± 0.120 | 0.893 ± 0.129 | 0.19 ± 2.66 | 0.882 ± 0.108 | 0.892 ± 0.114 | 1.18 ± 4.13* | 0.037 |
% change 12 months represents (12-0/0)*100
p<0.05 by paired t-test within groups baseline and 12 months for biochemical variables and by one sample t-test for % change BMD at 12 months
Whole body less head
Figure 2.
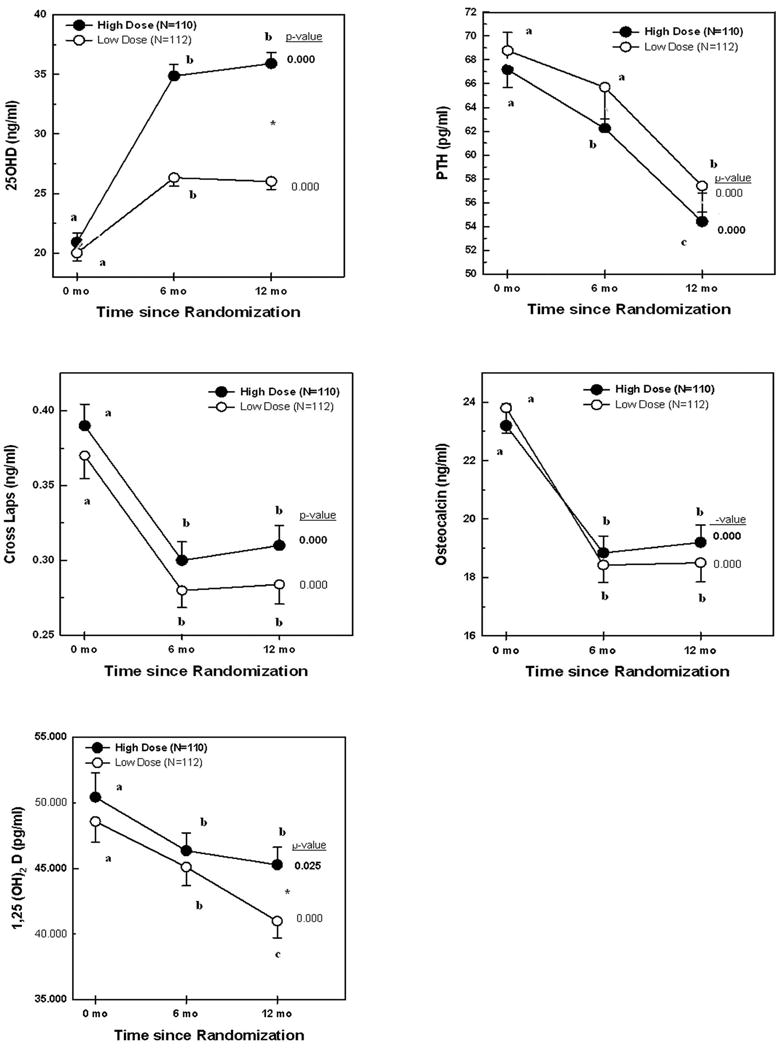
25OHD, PTH, Cross Laps, osteocalcin, and 1,25(OH)2D levels by vitamin D supplementation high dose (closed circles) and low dose (open circles) groups. Numbers expressed as mean ± SEM. P-values depicted in the Figure are derived from repeated measures ANOVA within each treatment group. Values within each treatment group depicted with different letters are significantly different from each other in post-hoc analyses by ANOVA. *p<0.05 by independent t-test for 25OHD and 1,25(OH)2 D at 12 months.
Calciotropic Hormones and Bone Markers
PTH, osteocalcin, and C-terminal telopeptide (Cross Laps) levels decreased significantly by 20–22% in both arms, but there were no significant differences between the two groups, either considering mean levels or % change from baseline, for any variable, both at 6 or 12 months; with the exception of serum calcitriol that was higher in the high dose compared to the low dose group, at 12 months (Table 2, Figure 2). Repeated measure ANOVA, within each arm, revealed that mean hormonal values at 6 and 12 months did not differ for all variables, with the exception of PTH and 1,25(OH)2D levels that gradually decreased at 6, and more so at 12 months, in the low dose arm (Figure 2).
Bone Mineral Density
Compared to baseline, there were significant increments in percent change BMD at the total hip and lumbar spine, but not femoral neck at 12 months, in both arms (Table 2), while percent change BMD at the subtotal body increased significantly in the high dose group only (Table 2). There were no significant difference between the two arms in the primary outcome, namely % change in femoral neck BMD, nor in % change BMD at the total hip and lumbar spine between the two groups (Table 2, Figure 3). In contrast, the mean % change subtotal body BMD was substantially higher in the high compared to the low dose group, (p=0.037, Table 2, Figure 3).
Figure 3.
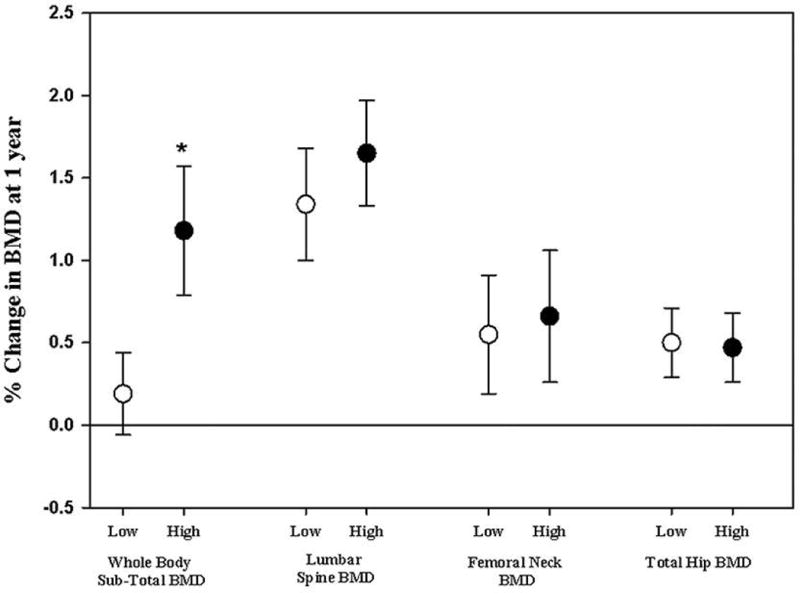
Percent change in BMD at 12 months, at various skeletal sites, by vitamin D treatment dose. Numbers expressed as mean ± SEM. BMD increased significantly at 12 months both at spine and total hip in both treatment groups, and at the sub-total BMD in the high dose treatment arm only. * p<0.05 for the % change at 12 months low dose vs. high dose by independent t-test.
Pre-specified sub-group analyses by gender or 25OHD-PTH level group at study entry
The mean increments in serum 25OHD levels at 12 months were similar in the two arms across the pre-specified subgroup analyses (data not shown). There were no significant differences in any of the bone markers between the 2 arms, with the exception of Cross Laps, levels being higher at 12 months in the high dose group, 0.33±1.5 ng/ml, as compared to the low dose group 0.27±1.2 ng/ml, p-value =0.048.
There were no differences between the two arms in % change BMD at 12 months, at any skeletal site, in either gender (data not shown). Subjects with serum 25OHD below 20 ng/ml and PTH level above 76 pg/ml showed a trend for a higher % BMD at 12 months at all skeletal sites, in the high compared to the low dose group, that reached significance only at the total hip (p= 0.05, Figure Appendix). Conversely, there was no such difference in BMD between the two treatment doses, in the 2 other subgroups (25OHD < 20 ng/ml and PTH level < 76 pg/ml, and 25OHD level >20 ng/ml, at 12 months (data not shown).
Similarly, exploratory regression analyses also revealed no significant interaction effect between baseline 25OHD and baseline PTH levels on percent change in BMD at any skeletal site (data not shown).
Multivariate linear regression analyses, adjusting for age, BMI, baseline serum 25OHD, and creatinine using, showed no difference in the percent change total hip BMD (the only significant site in sub-group analyses) at 12 months between the two study arms. Serum creatinine at baseline was a significant negative predictor of % change total hip BMD at 12 months, in the high risk group (25OHD < 20 ng/ml and PTH > 76 pg/ml).
Subject retention and adverse events
A total of 35 subjects, 14% of original randomized cohort, did not complete the study, the drop-out rate was similar in both groups, most of it occurred early in the study, and was in large part due to patients having changed their mind about study participation (Figure 1).(22) Two patients died, one in each treatment group. The DSMB unanimously adjudicated both deaths as unlikely to be related to study drug.(22). Compliance could not be assessed in non-completers as they did not complete a termination visit and did not return their bottles.
The SAEs included, in addition to events reported above, were comparable between two treatment arms (Figure 1).(22) There were 11 serious adverse events (SAEs), 6 in the low dose and 5 in the high dose groups. These included one event for each of the following: in the low dose group thrombophlebitis, glaucoma, hemorrhoids, and disc surgery; and in the high dose group, high blood pressure, retinal detachment, and arthroscopic surgery. One subject in the high dose group had a calcium level of 10.6 mg/dl, and a 25OHD of 30 ng/ml, at 6 months, and decided to drop out. One subject in the low dose group had a creatinine of 1.4 mg/dl and was managed as per algorithm.(22) His creatinine on follow-up was back to the baseline value of 1.3 mg/dl, and he completed the study.
DISCUSSION
At the time this study was launched, and until today, the adequate dose of vitamin D supplementation to minimize age-related bone loss in the elderly is unclear. Our findings reveal that there is little benefit in increasing vitamin D supplementation above 600IU/day, both on BMD and bone markers. No adverse effects could be detected in the high compared to the low dose vitamin D groups.
Several studies have compared vitamin D supplementation to placebo, and scarce are the trials that examined the benefits and risks of high versus low dose vitamin D supplementation on BMD and bone markers, beyond few weeks. When comparing vitamin D to placebo, significant improvement in BMD was consistently reported at various doses.(28–30) The increase in total body BMD in our trial is consistent with findings from an open label randomized controlled trial of 590 women from Finland, mean age 67.4±2 years, and baseline 25OHD of 20±7 ng/ml, who received 1000 mg of calcium with 800IU of vitamin D, or no intervention, over three years.(29)
Few studies systematically have compared the IOM recommended vitamin D dose to larger supplements. Our study, comparing high-dose vitamin D supplements, at a dose equivalent to 3,750 IU/d, to the IOM recommended dose of 600 IU/day showed no significant increase in bone mineral density at 12 months, with the exception of total body. Our results are similar to those from three recent randomized trials. One among 230 postmenopausal women in the US, mean age 61 years, 25OHD of 21±3 ng/ml, that showed no benefit from high dose vitamin D (equivalent to 3,333 IU/day) as compared to 800 IU/day, on BMD at the lumbar spine, total hip, femoral neck (secondary outcomes), nor on muscle mass, function, or falls;(31) and the other, on 297 postmenopausal women in Norway, comparing supplementation with 1000 mg of calcium and 800 IU/day of vitamin D, with an addition of a vitamin D dose of 6,500 IU/day for one year, that showed no significant change in lumbar spine or total hip BMD measurements.(32) An additional one-year dose-ranging trial, randomized 312 subjects from Norway, aged 21–70 years, with a mean baseline 25OHD serum level of 24 ng/ml, to 500 mg calcium daily and vitamin D3 40,000 IU/week (equivalent to 5,714 IU/day), vitamin D3 20,000 IU/week (2,857 IU/day) or placebo, also showed no difference in BMD between the three arms.(33) In contrast, one study comparing daily 3000 mg calcium carbonate and 1,400 IU vitamin D supplementation, with 200 IU supplementation over 1 year, in 122 elderly Danish men and women, with a baseline 25OHD of 15.9±7 ng/ml and recent low-energy fractures, reported a significant increase in lumbar spine BMD in the high dose group. The effect was more pronounced in patients below the age of 70 years.(28) Discrepancies between this trial,(28) our study, and the three negative ones(31–33) may in part be explained by differences in the severity of vitamin D deficiency at study entry, and subjects’ baseline characteristics, including age and frailty. Indeed, a recent meta-analysis of 23 trials, that included 4,083 participants, 92% women, mean weighted age 59 years, and mean duration of 23.5 months, reported a small increase in BMD at the femoral neck, but not at other sites, that the authors attributed to chance.(34) The meta-analysis included 19 double-blinded trials, 18 were placebo controlled, and it was characterized by heterogeneity, a relative young age of subjects, and variability in the vitamin D doses used (< 800 IU/day in 10 trials). The authors could not detect any significant effect of subject’s age, study duration, calcium supplementation, on BMD outcomes; but a beneficial effect was noted in subjects with low baseline 25 OHD levels, and at doses < 800 as compared to > 800 IU/day.(34) Fractures being the ultimate outcome of interest, and 25OHD serum levels being quite variable across trials, formulating firm conclusions regarding desirable 25OHD levels for this outcome both by the IOM and Endo society based on trial data(20) remain a challenging task.
Potential limitations of our study include the lack of a placebo arm, but we considered a study design with a placebo to be unethical in our high-risk population. The significant decrease in the serum levels of bone remodeling markers within each treatment arm, and the lack of difference between the two arms, may well be explained by the large dose of calcium (1,000 mg elemental) taken in combination with vitamin D. Osteoporosis was not an entry criterion, hence limiting the potential for further gain in bone density. BMI index above 25 kg/m2 may not be considered as representative of the elderly population in general. Study intervention was limited to one year, hence limiting extrapolation for long-term benefits and hazards. However, our study has several important strengths, including its double-blind randomized nature, an adequate power for the primary outcome that is femoral neck BMD, the inclusion of elderly participants, a relatively low 25OHD at entry (half of subjects with 25OHD< 20 ng/ml), the higher than usual vitamin D dose administered over a year, a high compliance rate (all be it only assessed on study completers), pre-specified analyses by vitamin D status at entry, and the use of LC-MS for serum 25OHD measurements.
The current recommendation for daily vitamin D dose in elders (>65 years) issued by the Scientific Food Council of the European Commission,(35) the World Health Organization (WHO),(36) and the Institute of Medicine (IOM) (18) in the US is 400–600 IU/day, is validated by our study findings, and the accumulating body of evidence from recent large trials, and a recent meta-analysis with regards to BMD outcomes.(29,31–34)
In conclusion, vitamin D at a dose equivalent to 3,750 IU/d given over a year, did not improve bone mineral density or bone markers, as compared to the IOM recommended daily allowance (RDA) of 600 IU/d, in elderly overweight subjects, with a mean 25OHD of 20 ng/ml. Our study findings are relevant to the growing literature on the adequate dose of vitamin D to prevent bone loss in overweight non-frail elderly with similar characteristics from the region and worldwide. They provide further evidence for the lack of additional skeletal benefits in vitamin D doses that exceed 600 IU/day in such populations.
Supplementary Material
Figure Appendix Percent change in BMD at the four skeletal sites at 12 months, in the sub-group with 25OHD < 20 ng/ml and PTH >76 pg/ml at study entry, in the high dose group (solid bar graph) versus low dose group (open bar graph). *p<0.005 between the two groups.
Acknowledgments
The authors are grateful to study subjects for their participation, and thank administrators at the Lebanese Ministry of Social Affairs dispensaries, local dispensaries, senior pharmacist at AUB, Mrs. Ulfat Usta, research staff, Mr. Nadeem Abu Arraj, Samir Hannoun, and laboratory technicians for their time and dedication and making the study possible. The authors greatly appreciate the time and input of members of the data safety monitoring board, Heike Bischoff-Ferrari MD, DrPH (University of Zurich, Switzerland), Christopher Gallagher, MD (Creighton University, USA) and Reinhold Vieth PhD, FCACB (Mt Sinai Hospital, Montreal, Canada). The authors thank Euro-Pharm Canada for providing the vitamin D/identical placebo tablets and calcium citrate supplements.
This trial was supported by grants from the American University of Beirut AUB, St Joseph University, and the Lebanese Council for National Scientific Research. Assays performed outside AUB were made in part possible thanks to institutional grants from the Mayo Clinic, Rochester, Minnesota, USA, and Odense University, Odense, Denmark. Research reported in this publication was in part supported by the Fogarty International Center and Office of Dietary Supplements of the National Institutes of Health under Award Number D43 TW009118; PI Ghada El-Hajj Fuleihan. The content is solely the responsibility of the authors and does not necessarily represent the official views of the National Institutes of Health.
Funding*: AUB, St Joseph University, LNCSR, Mayo Clinic, and NIH
*See details below in acknowledgments
TRIAL REGISTRATION ClinicalTrials.gov Identifier: NCT01315366
Footnotes
Authors’ Contributions: The contributions of the authors were as follows: trial concept and study design G El-Hajj Fuleihan, R Baddoura, R Habib and Z Mahfoud, subject recruitment M Rahme, D Bassil, K Ferkh, M Hoteit, R Baddoura, and G Halaby, A Arabi, trial execution M Rahme, D Bassil, K Ferkh, M Hoteit, data entry and analyses M Rahme, R Habib and G El-Hajj Fuleihan, manuscript write up M Rahme, SL Sharara, and G El-Hajj Fuleihan. All authors reviewed and approved the final version of the manuscript
All authors state that they have no conflict of interest
Contributor Information
Maya Rahme, Department of Internal Medicine, Division of Endocrinology, Calcium Metabolism and Osteoporosis Program, WHO Collaborating Center for Metabolic Bone Disorders, American University of Beirut Medical Center, Beirut-Lebanon.
Sima-Lynn Sharara, Department of Internal Medicine, Division of Endocrinology, Calcium Metabolism and Osteoporosis Program, WHO Collaborating Center for Metabolic Bone Disorders, American University of Beirut Medical Center, Beirut-Lebanon.
Rafic Baddoura, Department of Rheumatology, Hotel Dieu de France, Beirut- Lebanon.
Robert H Habib, Department of Internal Medicine, American University of Beirut Medical Center, Beirut-Lebanon.
Georges Halaby, Department of Endocrinology, Hotel Dieu de France, Beirut- Lebanon.
Asma Arabi, Department of Internal Medicine, Division of Endocrinology, Calcium Metabolism and Osteoporosis Program, WHO Collaborating Center for Metabolic Bone Disorders, American University of Beirut Medical Center, Beirut-Lebanon.
Ravinder J Singh, Division of Clinical Biochemistry and Immunology, Mayo Clinic, Rochester, Minnesota, United States of America.
Moustapha Kassem, Department of Endocrinology and Metabolism, University Hospital of Odense, Denmark.
Ziyad Mahfoud, Department of Healthcare Policy and Research, Weill Cornell Medicine, NY, USA Weill Cornell Medicine, Doha, Qatar.
Maha Hoteit, Department of Internal Medicine, Division of Endocrinology, Calcium Metabolism and Osteoporosis Program, WHO Collaborating Center for Metabolic Bone Disorders, American University of Beirut Medical Center, Beirut-Lebanon.
Rose T Daher, Department of Pathology & Laboratory Medicine, American University of Beirut Medical Center, Beirut-Lebanon.
Darina Bassil, Department of Internal Medicine, Division of Endocrinology, Calcium Metabolism and Osteoporosis Program, WHO Collaborating Center for Metabolic Bone Disorders, American University of Beirut Medical Center, Beirut-Lebanon.
Karim El Ferkh, Department of Internal Medicine, Division of Endocrinology, Calcium Metabolism and Osteoporosis Program, WHO Collaborating Center for Metabolic Bone Disorders, American University of Beirut Medical Center, Beirut-Lebanon.
Ghada El-Hajj Fuleihan, Department of Internal Medicine, Division of Endocrinology, Calcium Metabolism and Osteoporosis Program, WHO Collaborating Center for Metabolic Bone Disorders, American University of Beirut Medical Center, Beirut-Lebanon.
References
- 1.Cashman KD, Dowling KG, Škrabáková Z, Gonzalez-Gross M, Valtueña J, De Henauw S, et al. Vitamin D deficiency in Europe: pandemic? Am J Clin Nutr. 2016;103(4):1033–44. doi: 10.3945/ajcn.115.120873. [DOI] [PMC free article] [PubMed] [Google Scholar]
- 2.Manson JE, Brannon PM, Rosen CJ, Taylor CL. Vitamin D Deficiency - Is There Really a Pandemic? N Engl J Med. 2016;375(19):1817–1820. doi: 10.1056/NEJMp1608005. [DOI] [PubMed] [Google Scholar]
- 3.Lips P. Worldwide status of vitamin D nutrition. J Steroid Biochem Mol Biol. 2010;121(1–2):297–300. doi: 10.1016/j.jsbmb.2010.02.021. [DOI] [PubMed] [Google Scholar]
- 4.Mithal A, Wahl DA, Bonjour JP, et al. Global vitamin D status and determinants of hypovitaminosis D. Osteoporos Int. 2009;20(11):1807–20. doi: 10.1007/s00198-009-0954-6. [DOI] [PubMed] [Google Scholar]
- 5.Wahl DA, Cooper C, Ebeling PR, et al. A global representation of vitamin D status in healthy populations. Arch Osteoporos. 2012;7:155–72. doi: 10.1007/s11657-012-0093-0. [DOI] [PubMed] [Google Scholar]
- 6.Looker AC, Johnson CL, Lacher DA, Pfeiffer CM, Schleicher RL, Sempos CT. Vitamin D status: United States, 2001–2006. NCHS Data Brief. 2011;(59):1–8. [PubMed] [Google Scholar]
- 7.Hilger J, Friedel A, Herr R, et al. A systematic review of vitamin D status in populations worldwide. Br J Nutr. 2014;111(1):23–45. doi: 10.1017/S0007114513001840. [DOI] [PubMed] [Google Scholar]
- 8.Palacios C, Gonzalez L. Is vitamin D deficiency a major global public health problem? J Steroid Biochem Mol Biol. 2014;144(Pt A):138–45. doi: 10.1016/j.jsbmb.2013.11.003. [DOI] [PMC free article] [PubMed] [Google Scholar]
- 9.El-Hajj Fuleihan G, Rahme M, Bassil D. Do Desirable Vitamin D Levels Vary Globally? First. Springer Science, Business Media; 2013. [Google Scholar]
- 10.Arabi A, Baddoura R, Awada H, Salamoun M, Ayoub G, El-Hajj Fuleihan G. Hypovitaminosis D osteopathy: is it mediated through PTH, lean mass, or is it a direct effect? Bone. 2006;39(2):268–75. doi: 10.1016/j.bone.2006.01.140. [DOI] [PubMed] [Google Scholar]
- 11.Dawson-Hughes B, Harris SS, Krall EA, Dallal GE. Effect of calcium and vitamin D supplementation on bone density in men and women 65 years of age or older. N Engl J Med. 1997;337(10):670–6. doi: 10.1056/NEJM199709043371003. [DOI] [PubMed] [Google Scholar]
- 12.Holick MF. Vitamin D deficiency. N Engl J Med. 2007;357(3):266–81. doi: 10.1056/NEJMra070553. [DOI] [PubMed] [Google Scholar]
- 13.Chapuy MC, Pamphile R, Paris E, Kempf C, Schlichting M, Arnaud S, et al. Combined calcium and vitamin D3 supplementation in elderly women: confirmation of reversal of secondary hyperparathyroidism and hip fracture risk: the Decalyos II study. Osteoporos Int. 2002;13(3):257–64. doi: 10.1007/s001980200023. [DOI] [PubMed] [Google Scholar]
- 14.Murad MH, Elamin KB, Abu Elnour NO, Elamin MB, Alkatib AA, Fatourechi MM, et al. Clinical review: The effect of vitamin D on falls: a systematic review and meta-analysis. J Clin Endocrinol Metab. 2011;96(10):2997–3006. doi: 10.1210/jc.2011-1193. [DOI] [PubMed] [Google Scholar]
- 15.Reid IR. Short-term and long-term effects of osteoporosis therapies. Nat Rev Endocrinol. 2015;11(7):418–28. doi: 10.1038/nrendo.2015.71. [DOI] [PubMed] [Google Scholar]
- 16.Bolland MJ, Grey A, Gamble GD, Reid IR. The effect of vitamin D supplementation on skeletal, vascular, or cancer outcomes–authors’ reply. Lancet Diabetes Endocrinol. 2014;2(5):364–5. doi: 10.1016/S2213-8587(14)70100-7. [DOI] [PubMed] [Google Scholar]
- 17.Sanders KM, Nicholson GC, Ebeling PR. Is high dose vitamin D harmful Calcif Tissue Int. 2013;92(2):191–206. doi: 10.1007/s00223-012-9679-1. [DOI] [PubMed] [Google Scholar]
- 18.Ross AC, Manson JE, Abrams SA, et al. The 2011 report on dietary reference intakes for calcium and vitamin D from the Institute of Medicine: what clinicians need to know. J Clin Endocrinol Metab. 2011;96(1):53–8. doi: 10.1210/jc.2010-2704. [DOI] [PMC free article] [PubMed] [Google Scholar]
- 19.IOM (Institute of Medicine) Dietary Reference Intakes for Calcium and Vitamin D. Washington, DC: The National Academies Press; 2011. 2011; (Accessed in Jan 2017): https://www.ncbi.nlm.nih.gov/books/NBK56070/pdf/Bookshelf_NBK56070.pdf. [PubMed] [Google Scholar]
- 20.El-Hajj Fuleihan G, Bouillon R, Clarke B, Chakhtoura M, Cooper C, McClung M, et al. Serum 25-Hydroxyvitamin D Levels: Variability, Knowledge Gaps, and the Concept of a Desirable Range. J Bone Miner Res. 2015;30(7):1119–33. doi: 10.1002/jbmr.2536. [DOI] [PubMed] [Google Scholar]
- 21.Lips P, Hosking D, Lippuner K, et al. The prevalence of vitamin D inadequacy amongst women with osteoporosis: an international epidemiological investigation. J Intern Med. 2006;260(3):245–54. doi: 10.1111/j.1365-2796.2006.01685.x. [DOI] [PubMed] [Google Scholar]
- 22.El-Hajj Fuleihan G, Baddoura R, Habib RH, et al. Effect of vitamin D replacement on indexes of insulin resistance in overweight elderly individuals: a randomized controlled trial. Am J Clin Nutr. 2016;104(2):315–23. doi: 10.3945/ajcn.116.132589. [DOI] [PMC free article] [PubMed] [Google Scholar]
- 23.ClinicalTrials.gov Identifier: NCT01315366. https://clinicaltrials.gov/ct2/show/NCT01315366.
- 24.Ish-Shalom S, Segal E, Salganik T, Raz B, Bromberg IL, Vieth R. Comparison of daily, weekly, and monthly vitamin D3 in ethanol dosing protocols for two months in elderly hip fracture patients. J Clin Endocrinol Metab. 2008;93(9):3430–5. doi: 10.1210/jc.2008-0241. [DOI] [PubMed] [Google Scholar]
- 25.Lewiecki EM, Binkley N, Morgan SL, Shuhart CR, Camargos BM, Carey JJ, et al. Best Practices for Dual-Energy X-ray Absorptiometry Measurement and Reporting: International Society for Clinical Densitometry Guidance. J Clin Densitom. 2016;19(2):127–40. doi: 10.1016/j.jocd.2016.03.003. [DOI] [PubMed] [Google Scholar]
- 26.Arabi A, Baddoura R, El-Rassi R, El-Hajj Fuleihan G. PTH level but not 25 (OH) Vitamin D level Predicts Bone Loss rates in the Elderly. Osteoporos Int. 2012;23:971–980. doi: 10.1007/s00198-011-1659-1. [DOI] [PubMed] [Google Scholar]
- 27.Dawson-Hughes B, Harris S, Krall E, Dallal G. Effect of calcium and vitamin D supplementation on bone density in men and women 65 years of age or older. N Engl J Med. 1997;337:670–676. doi: 10.1056/NEJM199709043371003. [DOI] [PubMed] [Google Scholar]
- 28.Hitz MF, Jensen JE, Eskildsen PC. Bone mineral density and bone markers in patients with a recent low-energy fracture: effect of 1 y of treatment with calcium and vitamin D. Am J Clin Nutr. 2007;86(1):251–9. doi: 10.1093/ajcn/86.1.251. [DOI] [PubMed] [Google Scholar]
- 29.Karkkainen M, Tuppurainen M, Salovaara K, et al. Effect of calcium and vitamin D supplementation on bone mineral density in women aged 65–71 years: a 3-year randomized population-based trial (OSTPRE-FPS) Osteoporos Int. 2010;21(12):2047–55. doi: 10.1007/s00198-009-1167-8. [DOI] [PubMed] [Google Scholar]
- 30.Zhu K, Bruce D, Austin N, Devine A, Ebeling PR, Prince RL. Randomized controlled trial of the effects of calcium with or without vitamin D on bone structure and bone-related chemistry in elderly women with vitamin D insufficiency. J Bone Miner Res. 2008;23(8):1343–8. doi: 10.1359/jbmr.080327. [DOI] [PubMed] [Google Scholar]
- 31.Hansen KE, Johnson RE, Chambers KR, Johnson MG, Lemon CC, Vo TN, et al. Treatment of Vitamin D Insufficiency in Postmenopausal Women: A Randomized Clinical Trial. JAMA Intern Med. 2015;175(10):1612–21. doi: 10.1001/jamainternmed.2015.3874. [DOI] [PMC free article] [PubMed] [Google Scholar]
- 32.Grimnes G, Joakimsen R, Figenschau Y, Torjesen PA, Almas B, Jorde R. The effect of high-dose vitamin D on bone mineral density and bone turnover markers in postmenopausal women with low bone mass–a randomized controlled 1-year trial. Osteoporos Int. 2012;23(1):201–11. doi: 10.1007/s00198-011-1752-5. [DOI] [PubMed] [Google Scholar]
- 33.Jorde R, Sneve M, Torjesen PA, Figenschau Y, Hansen JB, Grimnes G. No significant effect on bone mineral density by high doses of vitamin D3 given to overweight subjects for one year. Nutr J. 2010;9:1. doi: 10.1186/1475-2891-9-1. [DOI] [PMC free article] [PubMed] [Google Scholar]
- 34.Reid IR, Bolland MJ, Grey A. Effects of vitamin D supplements on bone mineral density: a systematic review and meta-analysis. Lancet. 2014;383(9912):146–55. doi: 10.1016/S0140-6736(13)61647-5. [DOI] [PubMed] [Google Scholar]
- 35.European Food Safety Authority (EFSA) Scientific Opinion on the Tolerable Upper Intake Level of vitamin D. EFSA Panel on Dietetic Products, Nutrition and Allergies (NDA) 2016 (Accessed in Jan 2017) https://www.efsa.europa.eu/sites/default/files/consultation/160321.pdf.
- 36.WHO Vitamin and mineral requirements in human nutrition Second edition. (Accessed in Jan 2017) http://apps.who.int/iris/bitstream/10665/42716/1/9241546123.pdf?ua=1.
Associated Data
This section collects any data citations, data availability statements, or supplementary materials included in this article.
Supplementary Materials
Figure Appendix Percent change in BMD at the four skeletal sites at 12 months, in the sub-group with 25OHD < 20 ng/ml and PTH >76 pg/ml at study entry, in the high dose group (solid bar graph) versus low dose group (open bar graph). *p<0.005 between the two groups.