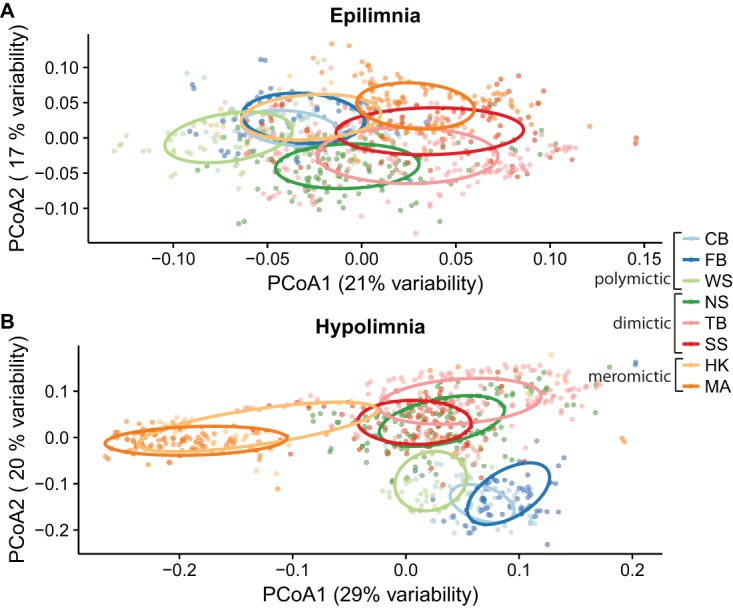
FIG 2 .

Principal-coordinate analysis of samples by layer. Weighted UniFrac distance values were used to perform principal-coordinate analysis on epilimnion (A) and hypolimnion (B) samples. The percentage of variance explained by the first two axes is reported in the axis labels. In both layers, samples cluster significantly by lake and mixing regime as tested using PERMANOVA (Table S2). (See Table 1 for lake abbreviations.) Data represented by ellipses indicating the clustering of each lake were calculated on the basis of standard errors using a 95% confidence interval. Differences in bacterial community composition between lakes and mixing regimes are more pronounced in hypolimnia than epilimnia. Additional plots of this ordination colored by other factors are shown in Fig. S5.
