

Abstract
Aerobic bacteria often live in thin fluid layers near solid–air–water contact lines, in which the biology of chemotaxis, metabolism, and cell–cell signaling is intimately connected to the physics of buoyancy, diffusion, and mixing. Using the geometry of a sessile drop, we demonstrate in suspensions of Bacillus subtilis the self-organized generation of a persistent hydrodynamic vortex that traps cells near the contact line. Arising from upward oxygentaxis and downward gravitational forcing, these dynamics are related to the Boycott effect in sedimentation and are explained quantitatively by a mathematical model consisting of oxygen diffusion and consumption, chemotaxis, and viscous fluid dynamics. The vortex is shown to advectively enhance uptake of oxygen into the suspension, and the wedge geometry leads to a singularity in the chemotactic dynamics near the contact line.
Keywords: bioconvection, chemotaxis, singularity, Bacillus subtilis
The interplay of chemotaxis and diffusion of nutrients or signaling chemicals in bacterial suspensions can produce a variety of structures with locally high concentrations of cells, including phyllotactic patterns (1), filaments (2), and concentrations in fabricated microstructures (3). Less well explored are situations in which concentrating hydrodynamic flows actually arise from these ingredients. Here we report a detailed experimental and theoretical study of an intriguing mechanism termed the “chemotactic Boycott effect.” Described briefly before (4), it is intimately associated with buoyancy-driven flows, metabolite diffusion, and slanted air–water menisci. The ubiquity of contact lines and their transport singularities (5) suggest importance of these observations in biofilm formation (6). The large-scale stirring created by these flows illustrate important advective contributions to intercellular signaling, as in quorum sensing (7).
The chemotactic Boycott effect takes its name from a phenomenon in sedimentation (8) that occurs when the chamber containing a fluid with settling particles is tilted from vertical. Settling depletes the fluid near the upper wall, making it buoyant relative to nearby fluid, whereupon it rises. This boundary flow stirs up the entire medium, greatly accelerating the settling process. In the chemotactic version, negatively buoyant aerobic bacteria swim up to the free surface of a sessile drop and slide down the slanted meniscus, producing high concentrations of cells near the three-phase contact line. In earlier work where this was observed (4), the detailed nature of hydrodynamic flows near the contact line was unclear. Here, by direct visualization and particle-imaging velocimetry (PIV), we show that the sliding surface layer drives a circulating hydrodynamic vortex in the meniscus region that is central to the microecology. Although counterintuitive in viscous flows, persistent circulation driven by forcing at the free surface is consistent with the classic analysis for vortex generation in wedge geometry (9).
The initial discussion of the chemotactic Boycott effect lacked a quantitative explanation in terms of the coupled dynamics of oxygen transport and consumption, chemotaxis, and viscous fluid dynamics. Here we present numerical and analytical results on one such model and show that they provide a good accounting of the major experimental observations. The characteristic fluid velocity U and length scale L associated with the vortex are both significantly larger than those of a single bacterium. In comparing the relative importance of advective to diffusive transport of a solute, it is natural to incorporate U, L, and the diffusion constant D into the dimensionless Peclet number Pe = UL/D, with Pe << 1 indicating that diffusion is the dominant transport mechanism and Pe >> 1 is the advection-dominated regime. We find that the Boycott-like flows lead to Pe >> 1, just the opposite of the situation at the scale of a single bacterium. In addition, by analogy with evaporative singularities in sessile drops (5, 10), we find a singularity in the oxygen-uptake rate at the contact line. Along with the large-scale stirring of fluid in the drop, this flow significantly enhances the overall oxygen concentration in the medium, showing that collective effects can improve the viability of the population, as demonstrated by remarkable collective activity (4) of the extremely concentrated organisms near the drop edge.
Materials and Methods
Experiments were conducted with Bacillus subtilis strain 1085B. Samples were prepared by adding 1 ml of -20°C stock to 50 ml of terrific broth (TB) (Ezmix Terrific Broth, Sigma; 47.6 g of broth mix and 8 ml of glycerin in 1 liter of distilled water) and incubating for 18 h (VWR model 1217 shaker bath; 37°C, 100 rpm), after which 1 ml of the bacterial suspension was added to 50 ml of TB and incubated for 5 h. The 5-h culture was then slowly added to the chamber with a syringe (21-gauge needle). The -20° stock was prepared by adding spores on sand to 10 ml of TB at room temperature in a Petri dish and allowing for ≈24 h of growth. One milliliter of 24-h stock was added to 50 ml of TB and incubated for 18 h. One milliliter of the 18-h culture was added to 50 ml of TB and incubated for 5 h. Aliquots composed of 0.75 ml of 5-h culture mixed gently with 0.25 ml of glycerin were placed in cold storage. The chambers (Fig. 1A) were constructed from microscope slides cemented together with UV curing adhesive (Norland, Cranbury, NJ); care was taken to remove excess adhesive to avoid interference with visualizations near the contact line and to seal the chamber adequately to avoid evaporation and associated flows. The space between the vertical slides that form the front and back of the chamber was typically 1 mm. Imaging was achieved with a digital charge-coupled device camera [Hamamatsu (Ichinocho, Japan) C7300; 1,024 × 1,024 pixels; 12 bit] under computer control (National Instruments, Austin, TX) attached to a macrophotography bellows (PB-6, Nikon) with a 105-mm f/2.8 lens. Dark-field illumination was a 4-cm-diameter fiber-optic ring light (Navitar, Rochester, NY) behind the sample chamber. PIV measurements were conducted by adding 5 μl of fluorescent microspheres (Molecular Probes, F8825 carboxylate modified, 1.0 μm, Nile red) to 1 ml of suspension, illuminating with a DPSS laser (100 mW, 532 nm) reflected from a dichroic mirror (Z542RDC, Chroma Technology, Rockingham, VT), and visualizing through a long-pass filter (HQ542LP, Chroma Technology). Analysis was performed with PIV software (Dantec Dynamics, Skovlunde, Denmark).
Fig. 1.

Construct for quantitative analysis of bacterial dynamics at a slanting interface. (A) Apparatus for simultaneous dark-field and fluorescence imaging of fluid drops: laser (L), shutter (S), beam-expander lenses (L1 and L2), dichroic beam splitter (D), long-pass filter (LPF), fiber-optic ring light (RL), and digital camera (C). The chamber has antireflection areas (AR) to reduce glare and hydrophobic areas (H) to pin the drop. (B) Boundary conditions and coordinates in the wedge (described in Mathematical Model).
Results
Fig. 2 A–C shows images of the main stages of the chemotactic Boycott effect. After a drop of well mixed suspension is placed in the chamber, the first spatial structure that forms is a “depletion layer” of thickness  below the fluid–air interface, which appears dark in our imaging method because of the absence of cells. This region arises from the consumption of dissolved oxygen by the uniformly dispersed cells, followed by their chemotactic migration up the oxygen gradient to the source of oxygen: the free surface. No cellular motion is seen below the depletion layer, suggesting that the oxygen concentration there has fallen to the critical value, denoted c*, below which motility vanishes. In a flattened sessile drop, the bottom of the depletion layer follows the shape of the air–water meniscus, displaced downward by the layer thickness. This layer forms within 100 s, consistent with consumption of the saturation-dissolved oxygen concentration cs ≈ 1017 cm-3 by cells at concentration n0 ≈ 109 cm-3, with a consumption rate κ ≈ 106 oxygen molecules per second. This interval is also consistent with the time
  for a cell with a typical chemotactic velocity vc ≈ 10 μm/s to traverse the thickness
  . Ultimately, the cells congregate in a narrow surface “accumulation layer,” whose thickness d ≈ 100 μm.
Fig. 2.

Stages leading to self-concentration in a sessile drop, observed experimentally (A–C) and by numerical computations with the model described in text (A′–C′). (A and A′) Drop momentarily after placement in the chamber. (B and B′) Formation of depletion zone after 150 s, before appreciable fluid motion. (C and C′) Lateral migration of accumulation layer toward drop edges and creation of vortex (shown in Fig. 3) after 600 s. The color scheme describes the rescaled bacteria concentration ρ as defined in Appendix. (Scale bar, 0.5 mm.)
Although the accumulation layer slides along the meniscus to the contact line, it is unstable to plume formation on a length scale comparable to the layer thickness, consistent with the fundamental instability of bioconvection in fluids with a horizontal meniscus (11). The Boycott effect occurs at the slant region; the resultant surface and return flows distort the plumes that would otherwise fall straight down. This surface flow is opposite to that of the conventional Boycott effect, but the depletion layer here is buoyantly forced in the usual direction, creating a unique shear double layer. Typical fluid velocities at the free surface are in the range of 20–200 μm/s, accelerating as the meniscus slope increases near the contact line. Finally, because of incompressibility requirements, a well developed vortex appears near each of the contact lines and shows persistence over many tens of minutes. The closed streamlines (Fig. 3A) show the sense of circulation created by the downward gravitational forcing on the accumulation layer and the recirculation into the bulk required by fluid incompressibility. Despite the outward flow at the bottom of the vortex, the optical density indicates that cells are trapped near the contact line.
Fig. 3.

Hydrodynamic vortex near three-phase contact line. (A) Velocity contours obtained from PIV measurements, averaged over 750 frames acquired at intervals of 0.2 s. (Scale bar, 1 mm.) The region immediately above the PIV contours is the curved fluid–air interface beyond the slice viewed in cross section. (B) Numerical results obtained from finite-element calculations by using the model in Eqs. 1, 2, 3. Closed streamlines are shown along with velocity magnitude in color.
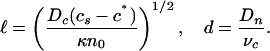
Mathematical Model. The dynamics of the oxygen concentration c, cell concentration n, and fluid velocity u are described by coupled partial differential equations (12),
 |
[1] |
 |
[2] |
 |
[3] |
In Eq. 1 the oxygen-diffusion constant is Dc ≈ 2 × 10⁻⁵ cm2/s, and the dimensionless function f(c) modulates the oxygen consumption rate κ, asymptoting to unity at large c but vanishing as c → 0. Because the experimental time scales are minutes and the cell division time is ≈100 min, the dynamics (Eq. 2)of n conserve the total number of cells. The bacterial diffusion constant Dn arises as a consequence of the random swimming trajectories and is estimated to be Dn ≈ 10-6 to 10-5 cm2/s. Chemotaxis is described by the second term on the right-hand side of Eq. 2, with a velocity proportional to the oxygen gradient (13); the coefficient μ may be interpreted as μ = av0/cs, so that the chemotactic velocity is v0 when the gradient is cs/a, where a is a characteristic length. Like the function f(c), the motility function r(c) is unity at large c and vanishes rapidly for c below the motility cutoff c*; we approximate it and f(c) by the step function Θ(c - c*). Subject to incompressibility,  , the fluid equations (Eq. 3) use the Boussinesq approximation in which the density variations caused by bacteria appear only in the buoyant forcing, with Δρ = ρb - ρ, where Vb and ρb are the bacterial volume and density, respectively, and ρ is the pure fluid density. In the Appendix we provide a nondimensionalization of these equations convenient for numerical studies.
The boundary conditions on c, n, and u are central to the global flows and possible singularities. As shown in Fig. 1B, there is no flux (of cells or oxygen) through the substrate, under the drop and to its side, and no cell flux through the fluid–air interface. That interface is stress-free, whereas the fluid–glass boundary has no slip. Because the oxygen-diffusion coefficient in the air is three orders of magnitude larger than that in the fluid, the oxygen concentration outside the drop can be assumed equal to its saturation value cs inside the fluid and on the free surface. Oxygen diffusion in the drop is equivalent to that in the enlarged space, the bottom of which is the reflection of the meniscus across the fluid–glass interface. This lens-shaped region has a sharp point that is the source of a chemotactic singularity in the same way that a pointed electrical conductor produces a singular electric field.
Comparison with Experiment. The phenomena shown in Figs. 2 and 3 can now be explained, beginning with formation of the depletion and accumulation layers. Forming first in the absence of fluid flow, we need only consider Eqs. 1 and 2 with u = 0, and even more simply in a one-dimensional vertical cut through the drop. Quasi-steady-state profiles of c and n are found in which c varies exponentially down from the free surface until it intercepts c*. From this result, taking into account only bacterial motility, one deduces
 |
[4] |
The result  can be verified by a dilution experiment. Fig. 4 B and C show two drops, the first from the standard bacterial suspension with cell concentration n0 and the second a dilution to 0.4 n0. The increase in
  is apparent. Vertical traces of the optical intensity through the height of the drop, averaged over 40 s, yield profiles similar to that shown in Fig. 4D, from which
  is determined. We see good agreement with the numerical results in Fig. 4A, although at the very high cell concentrations in the accumulation layer the optical intensity saturates, the likely explanation for the relatively small intensity there. With the parameters discussed above, we fit
  for the undiluted solution with c* = 0.3 cs, and then
  of the diluted solution lies accurately on the prediction (Fig. 4E).
Fig. 4.

Depletion layers in sessile drops. (A) Numerical solution of Eqs. 1 and 2 for the rescaled cell concentration as a function of rescaled height. (B) Depletion layer forming in stock solution. (C) Depletion layer forming in a 40% dilution. (Scale bar, 0.5 mm.) (D) Averaged intensity trace in the stock solution, normalized to intensity at bottom of the drop. (E) Depletion layer thickness as a function of relative concentration. Dashed line, theoretical prediction.
Numerical studies of the partial differential equations with a curved fluid–air interface are readily accomplished with finite-element methods. Calculations were performed with femlab (Comsol, Los Angeles). The coupled partial differential equations were handled by using the “general” form, with high-order Lagrange elements (quintic for Eqs. 1 and 2 and quartic-quadratic for Eq. 3), on a triangular mesh consisting of ≈1,000 nodes, and a fifth-order time-integration scheme in the nonlinear time-dependent solver. We focus here on two-dimensional dynamics, equivalent to the assumption of translational invariance with respect to the direction along the contact line. The essential features of the flow are found as well in numerical studies by using Darcy's law for flow between the vertical plates of the experimental chamber. Overhead views of sessile drops reveal that in the third dimension the vortex breaks up into a radial form of bioconvective plumes (4). A further analysis of this globally driven instability is needed. Our two-dimensional computations, shown in Figs. 2 A′–C′, reproduce the observations: the depletion layer tracing the shape of the meniscus, the variations in thickness of the accumulation layer over the boundary of the drop, and the plume instability. Fig. 3B shows that the vortex is also captured accurately.
Except close to the contact line, the accumulation layer is very thin compared to the depth of the drop, so the gravitational forcing that acts on it is essentially concentrated at the surface. When combined with the no-slip boundary condition at the bottom of the drop, this forcing defines one of the scenarios in Moffatt's analysis of viscous eddies in sharp corners (9). Theory predicts a set of progressively smaller vortices adjacent to the main vortex. We have not seen evidence of these vortices in either experiment or simulations, but they are expected to be extremely weak and are likely outside the resolution of both approaches. Theory also suggests that the conditions under which vortices develop can depend sensitively on the far-field conditions and the wedge angle. Our numerical results indicate the existence of a vortex at least over a range of angles from π/4 to π/2.
The velocities U in the vortex can reach 0.01 cm/s, with a size of 0.1 cm, so the Peclet number can approach ≈102. Numerical studies show that the combination of accumulated bacteria and greatly enhanced stirring in the wedge lead to (i) a near-singular variation in oxygen flux near the contact line (Fig. 5A) and (ii) an increase in oxygen uptake into the drop. Fig. 5B shows that the average oxygen concentration initially drops precipitously as consumption dominates, but it slowly returns to a high value as stirring enhances the uptake from the air above. Without the hydrodynamic coupling between cell concentration and buoyancy, the oxygen concentration remains low after the initial consumptive drop. Not only oxygen but also nutrients will be ferried to the contact-line region from areas in the bulk of the drop.
Fig. 5.

Oxygen dynamics from numerical studies. (A) Inward flux of oxygen along upper surface of a drop, in units of Dccs/L, as a function of distance r from the contact line, showing near-singular behavior. (B) Average oxygen concentration in the drop as a function of rescaled time s, normalized to the initial value.
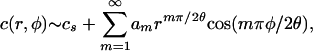
Chemotactic Singularity. Some insight into the oxygen flux near the contact line is obtained by making use of the electrostatic analogy mentioned above. Close enough to the contact line the numerics indicate that the velocity along the upper free surface tends to zero, so advective contributions vanish asymptotically there. The simplest steady-state oxygen-diffusion problem, for which  inside the drop and c = cs on the free surface, is mathematically equivalent to the equation defining the electrostatic potential in that same region, the exterior of the drop being a conductor (5). This mapping reveals (14) that a singularity arises from a solution of the form
 |
[5] |
with polar coordinates (r, ϕ) as shown in Fig. 1B. This form enforces the condition c = cs on the drop surface (ϕ = θ) and the no-flux condition on the glass substrate (ϕ = 0). After successive differentiation, the potentially most singular term is m = 1, and we expect a1 < 0 because c ≤ cs in the drop interior. Noting that 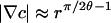 and
and 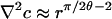 , singularities appear in two cases:
θ > π/2, an overhanging meniscus. This case is like the familiar “lightning-rod” effect. Both the Fick's law oxygen flux,
 , and the chemotactic flux,
  , diverge as r → 0, leading to a singular accumulation at the contact line.
π/4 < θ < π/2, as shown in Figs. 2, 3, 4. Here,
 is finite as r → 0 but has a diverging slope. Expanding the chemotaxis term in the dynamics (Eq. 3), we see terms of the form
 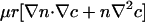 , the former implying a potential cusp in the cell concentration n. Although weaker than case 1, there still is a singular accumulation driven by the diffusional singularity of oxygen.
Let us consider in more detail the typical case θ < π/2. There is a positive, bidirectional feedback loop involving the chemotactic response to the oxygen singularity. The singularity is reinforced by the accumulation of bacteria that consume the oxygen. A rough idea of this can be gleaned by examining a steady-state balance between the dominant terms in the chemotaxis equation (Eq. 2), setting 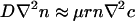 to find a distribution n ≈ exp(-Γrπ/2θ), with Γ > 0, that decays away from the contact line very sharply. Because the local oxygen consumption rate is proportional to n, the inward flux of oxygen mirrors the bacterial concentration distribution, as shown in Fig. 5B. Although a more precise treatment requires a fully self-consistent calculation of the coupled oxygen and bacterial concentrations, this result illustrates the dramatic accumulation of bacteria in the contact region.
The development of the self-trapping vortex and the associated high concentration of bacteria near the contact line depend crucially on the no-flux boundary conditions at the substrate. A dramatic demonstration of this phenomenon is seen in the flows in a “supported” drop. This geometry was achieved by turning over the experimental chamber, allowing a previously sessile drop to slide down from the chamber base toward the opening at the opposite end. Surface tension supports the drop, with free uptake of oxygen around the whole meniscus. As shown in Fig. 6, the bottom interface is very flat, giving an effective contact angle exceeding π/2, but with no substrate the dynamics are nonsingular. We see the key stages in the chemotaxis and fluid instabilities in this geometry. Development of the depletion zone occurs rather symmetrically around the entire perimeter of the drop, producing the nonmotile region in the center. Later, plumes descend from above, and the accumulation layer slides down the drop meniscus, producing a clearly visible enhancement of concentration at the bottom of the meniscus beyond the local chemotactic concentration. The computations quantitatively reproduce these features.
Fig. 6.

Self-concentration in a thin droplet, confined between glass plates and surrounded by air. Experimental observations and numerical results presented are as described for Fig. 2, with A and A′ at time t = 0, B and B′ at 200 s, and C and C′ at 360 s. (Scale bar, 0.5 mm.)
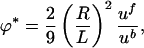
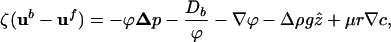
At the high concentrations found near the contact line of sessile drops or at the bottom of supported drops, the viscous drag between the fluid and bacteria is comparable to that of the fluid on itself. A simple estimate gives the volume fraction ϕ* at which this transition takes place. The drag force per unit volume on the suspension is ζubϕ/Vb, with ζ = 6πηR the drag coefficient of an equivalent sphere of radius R, ub the bacterial velocity, and Vb = 4πR3/3 the equivalent volume of a bacterium. The viscous drag force on the fluid per unit volume is ηuf/L2, where L is a characteristic scale of the flow and uf is the fluid velocity. Equating these two gives
 |
[6] |
independent of viscosity. Taking R ≈ 2 μm as a representative bacterium radius and L ≈ 100 μm, the thickness of the accumulation layer, and uf/ub ≈ 5 (4), then ϕ* ≈ 5 × 10⁻⁴, corresponding to a concentration n ≈ 5 × 108 cm-3, comparable to a typical initial homogeneous concentration in the drop. For volume fractions in excess of ϕ*, the fluid and bacterial velocities should be treated equally; one method to accomplish this objective uses two-phase fluid flow (15). With the low Reynolds numbers of the typical flows, the coupled dynamics of the bacterial and fluid velocities ub and uf are
 |
[7] |
 |
[8] |
with the continuity condition, 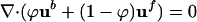 . Numerical investigations of Eqs. 1 and 2 coupled to the oxygen dynamics (1) show qualitatively similar results for the overall bioconvective flows to those obtained with the Navier–Stokes equations (3) but also provide a more quantitatively correct description of the dense regime.
Conclusions
We have shown that the interplay of chemotaxis, buoyancy, and meniscus geometry is responsible for persistent fluid circulation and high cell densities in the neighborhood of contact lines. This circulation is strong enough to render advection dominant over diffusion and enhance the overall oxygen uptake into the medium. Driven entirely by chemotaxis and metabolism of individual cells, no explicit cell–cell communication is necessary for these phenomena to occur. Of course, one may view mutual consumption as accidential communication. Nevertheless, the creation of a microecological structure by a self-organized dynamic will likely influence concurrent cell–cell communication, which is necessary for such processes as quorum sensing and subsequent biofilm formation (16), with its well known complex transition from planktonic to sessile cells (17). The geometrically mediated concentrative mechanism described here results in approximately close-packed bacteria exhibiting rapid coherent chaotic dynamics, including collectively driven flow of fluid through the array (4). Our experiments have shown (unpublished data) that the shallow fluid–air–substrate contact is a geometric constraint immobilizing bacteria. Initial cells nucleate a growing immobile assembly. The chaos of swimming, concentrated planktonic cells undoubtedly transports molecular nutrients and facilitates quorum signaling adjacent to sessile individuals, supplies recruits to the sessile population, and transports tumbling, eventually settling, chunks of biofilm generated elsewhere. This scenario is a setting for biofilm progression, inward from the wetting region. It is of special interest that the flow of fluid adjacent to the initially adherent cells is driven only by the dynamics of the huge number of adjacent bacteria dispersing molecular information, unlike the situation presented by Egland et al. (18), in which communication in an imposed flow depends on immediate adjacency. The possibility (19) that anoxia can be a negative signal for surface adhesion in Escherichia coli provides additional evidence that advective contributions from large-scale flows might play a role in the formation of biofilms.
Acknowledgments
We are grateful to K. Glasner for important discussions. This work was supported in part by National Science Foundation Grant MCB0210854 (to L.C., C.D., J.O.K., and R.E.G.); National Science Foundation Grant MCB 0327716 and National Institutes of Health Grant R01 GM072004 (to C.W.W.); and Spanish Ministerio de Ciencia y Tecnologia Contract BFM2000-1108 (CONOCE) (to I.T.).
Appendix
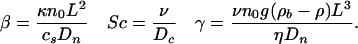
Here we discuss some mathematical details involving the nondimensionalization of the governing equations. We rescale Eqs. 1, 2, 3 to identify the dimensionless control parameters. If L ≈ 0.1 cm is the depth of the drop, we define the rescaled variables x = r/L, s = Dnt/L2, χ = c/cs, ρ = n/n0, π = L2p/ηDn, and v = Lu/Dn. Defining δ = Dc/Dn ≈ 1 - 10, and α = av0/Dn ≈ 10, we have
 |
[9] |
 |
[10] |
 |
[11] |
where
 |
[12] |
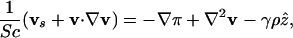
The time L2/Dn ≈ 103 s is that for diffusion across the drop, β ≈ 10 is the ratio of the bacterial diffusion time to that for oxygen consumption, and the Schmidt number Sc ≈ 103 measures the ratio of kinematic viscosity to diffusion of oxygen. Finally, γ ≈ 103 is analogous to the Rayleigh number in thermal convection (11).
Author contributions: J.O.K. and R.E.G. designed research; I.T., L.C., C.D., C.W.W., J.O.K., and R.E.G. performed research; I.T., L.C., C.D., C.W.W., J.O.K., and R.E.G. analyzed data; and I.T., L.C., C.D., C.W.W., J.O.K., and R.E.G. wrote the paper.
This paper was submitted directly (Track II) to the PNAS office.
Abbreviation: PIV, particle-imaging velocimetry.
References
- 1.Budrene, E. O. & Berg, H. C. (1995) Nature 376, 49-53. [DOI] [PubMed] [Google Scholar]
- 2.Betterton, M. D. & Brenner, M. P. (2001) Phys. Rev. E Stat. Phys. Plasmas Fluids Relat. Interdiscip. Top. 64, 061904-1-15.
- 3.Park, S., Wolanin, P. M., Yuzbashyan, E. A., Silberzan, P., Stock, J. B. & Austin, R. H. (2003) Science 301, 188. [DOI] [PubMed] [Google Scholar]
- 4.Dombrowski, C., Cisneros, L., Chatkaew, S., Kessler, J. O. & Goldstein, R.E. (2004) Phys. Rev. Lett. 93, 098103-1-4. [DOI] [PubMed] [Google Scholar]
- 5.Deegan, R. D., Bakajin, O., Dupont, T. F., Huber, G., Nagel, S. R. & Witten, T. A. (1997) Nature 389, 827-829. [DOI] [PubMed] [Google Scholar]
- 6.O'Toole, G., Kaplan, H. B. & Kolter, R. (2000) Annu. Rev. Microbiol. 54, 49-79. [DOI] [PubMed] [Google Scholar]
- 7.Bassler, B. L. (2002) Cell 109, 421-424. [DOI] [PubMed] [Google Scholar]
- 8.Boycott, A. E. (1920) Nature 104, 532. [Google Scholar]
- 9.Moffatt, H. K. (1964) J. Fluid Mech. 18, 1-18. [Google Scholar]
- 10.Deegan, R. D., Bakajin, O., Dupont, T. F., Huber, G., Nagel, S. R. & Witten, T. A. (2000) Phys. Rev. E Stat. Phys. Plasmas Fluids Relat. Interdiscip. Top 62, 756-765. [DOI] [PubMed] [Google Scholar]
- 11.Pedley, T. J. & Kessler, J. O. (1992) Annu. Rev. Fluid Mech. 24, 313-358. [Google Scholar]
- 12.Hillesdon, A. J., Pedley, T. J. & Kessler, J. O. (1995) Bull. Math. Biol. 57, 299-344. [DOI] [PubMed] [Google Scholar]
- 13.Keller, E. F. & Segel, L. A. (1971) J. Theor. Biol. 30, 225-234. [DOI] [PubMed] [Google Scholar]
- 14.Jackson, J. D. (1962) Classical Electrodynamics (Wiley, New York).
- 15.Drew, D. A. & Segel, L. A. (1971) Stud. Appl. Math. 50, 205-231. [Google Scholar]
- 16.Davies, D. G., Parsek, M. R., Pearson, J. P., Iglewski, B. H., Costerton, J. W. & Greenberg, E. P. (1998) Science 280, 295-298. [DOI] [PubMed] [Google Scholar]
- 17.Costerton, B. (2004) Proc. Natl. Acad. Sci. USA 101, 16983-16984. [DOI] [PMC free article] [PubMed] [Google Scholar]
- 18.Egland, P. G., Palmer, R. J., Jr., & Kolenbrander, P. E. (2004) Proc. Natl. Acad. Sci. USA 101, 16917-16922. [DOI] [PMC free article] [PubMed] [Google Scholar]
- 19.Landini, P. & Zehnder, A. J. B. (2002) J. Bacteriol. 184, 1522-1529. [DOI] [PMC free article] [PubMed] [Google Scholar]