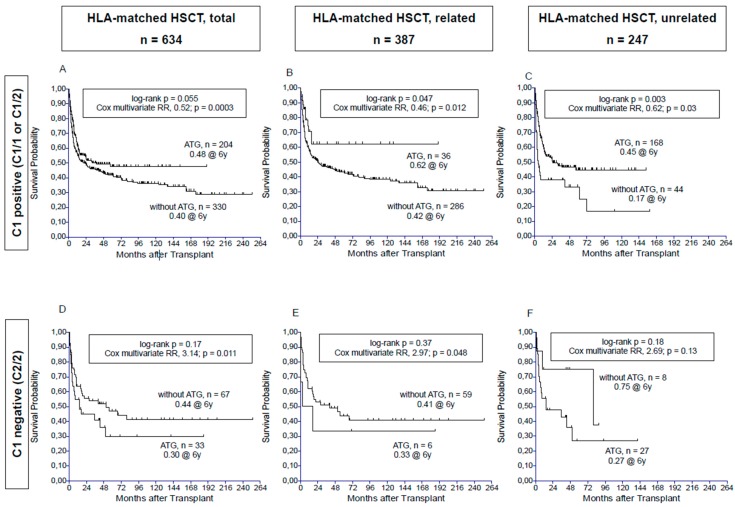
Figure 1.
Probability of overall survival after HLA-matched transplants, according to the use of ATG, for the C1 positive (C1/1 or C1/2) KIR-L cohort (A–C) and for the C2/2 cohort (D–F). Figure 1A,D show the Kaplan-Meier curves for the entire cohorts, Figure 1B,E for related, and Figure 1C,E for unrelated transplants. The indicated log-rank p-values refer to the univariate comparison of the ATG versus no-ATG curves, and impact of ATG within the respective Cox multivariable model is also indicated.

