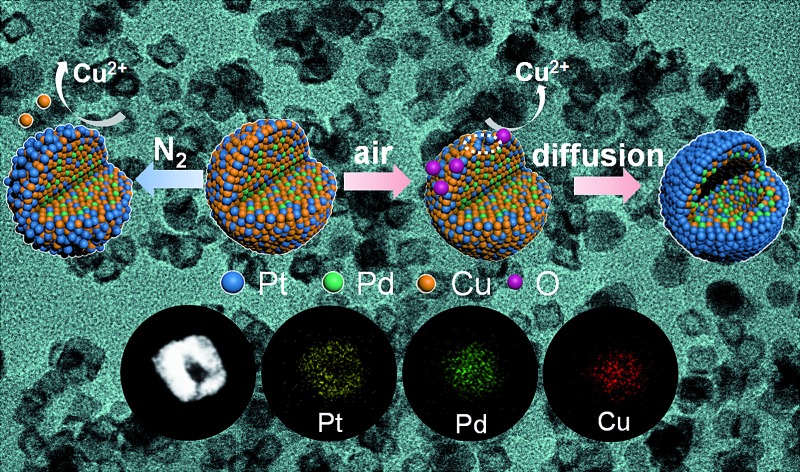
 Hollow PtPdCu nanoparticles with a Pt-enriched surface, formed by the dealloying action of acetic acid, exhibit superior durability and catalytic activity toward the ORR.
Abstract
Hollow alloyed nanoparticles (NPs) represent one kind of promising fuel cell electrocatalyst. However, the formation of single-cavity hollow structures by a dealloying process is quite challenging owing to the random leaching/dissolution of transition metals, surface passivation and the limited diffusion distance of the noble metals. Here we present a facile method to prepare hollow PtPdCu NPs derived from monodisperse alloy NPs by an acetic acid-assisted dealloying process. Here, acetic acid not only acts as a chemical etching agent but also plays an important role in the removal of the residual surfactants for colloidal NPs. Our findings rectify the current knowledge that hollow alloyed NPs cannot be prepared by a dealloying strategy and provide further understanding of the dealloying process in a ternary system. Such unique hollow ternary PtPdCu NPs exhibit outstanding durability and improved catalytic activity toward the oxygen reduction reaction.
Introduction
The major obstacles to the development of proton exchange membrane fuel cells are the high cost of Pt and the sluggish kinetics of the oxygen reduction reaction (ORR).1 The strategies to develop a low cost, effective and robust Pt-based alloy electrocatalyst involve engineering the surface Pt thickness, the surface Pt atomic arrangement and the microscopic morphology of the nanoparticles (NPs).2 The surface Pt thickness influences the ORR kinetics through the ensemble/strain effects from a thin Pt layer and the strain effect alone from a thick Pt layer.3 Surface Pt atomic arrangement basically refers to the exposed crystal facet effect owing to the surface atomic coordination number difference.4 The microscopic morphology effect of the NPs reflects surface skin/skeleton structures5 or porous/hollow structures.6 In some cases, all the three factors generally work together synchronously and co-impact the observed catalytic activity. Among the various architectures, hollow structures, which have a unique structure and better access to the reactants through permeation over their solid counterparts, have attracted great interest.7 Pt hollow nanostructures, especially, have emerged as highly desirable structures for electrocatalysis as they introduce cavities to expose more active sites and increase Pt utilization, as expected.8
One best-known approach for fabricating hollow structures is the template directed method.9 In particular, for preparing monometallic Pt hollow structures, there have been many successes based on the galvanic replacement starting from reactive sacrificial metallic templates relying on the driving force derived from the difference in reduction potentials between the two metals involved.10 Nevertheless, in most cases, the galvanic replacement method was finitely utilized to prepare alloyed hollow structures, especially hollow PtM (M = transition metals, Fe, Co, Ni and Cu) NPs owing to the technology limitations.10b,11
On the other hand, (electro)chemical dealloying is considered as a facile and promising method for the preparation of core/shell and porous nanocatalysts.12 It has been reported that the formation of a porous structure in a binary system relied on the particle size and the key size cut-off for the formation of porosity upon dealloying was around 15 nm.12d Below this critical size, the porous structure was not present even in an air atmosphere where the oxygen helped the formation of a porous structure due to the higher open circle potential relative to that in a nitrogen atmosphere. In those cases, however, a porous structure instead of a hollow structure was selectively obtained. The formation of an alloyed hollow structure through chemical dealloying remains elusive.
Herein, we present a facile method to prepare PtPdCu hollow NPs from alloyed PtPdCu NPs via a chemical dealloying process, during which the less-noble metal Cu was selectively leached out in acetic acid. Unlike previous reports on porous structures obtained by (electro)chemical dealloying and hollow structures obtained by galvanic replacement, a unique hollow ternary PtPdCu nanostructure with a Pt enriched shell and a PdCu enriched subsurface was produced. Yet, there is a key size limitation where the formation of a porous/hollow structure above 10–15 nm via chemical dealloying is inapplicable for this ternary system. In this work, we use acetic acid as a chemical etching agent for leaching Cu and as a cleaner for removing the residual surface capping agents from the colloidal NPs.13 We reveal a previously unreported formation mechanism of hollow PtPdCu nanostructures via a relatively mild acid. On the basis of these findings, we address the activity and stability issues toward the ORR through the rational design and synthesis of this kind of alloyed hollow structure with a Pt enriched surface.
Results and discussion
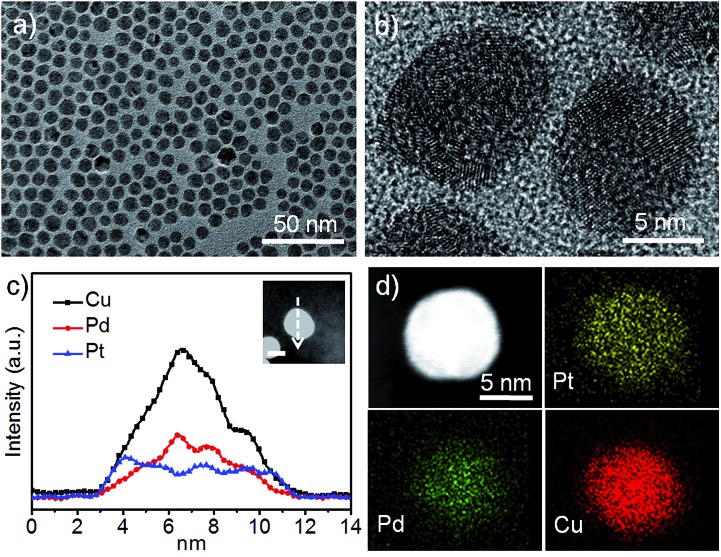
A series of monodisperse PtPdCux (x = 1, 3, 6 and 9) NPs were synthesized as the starting materials by chemical reduction of the precursors Pt(acac)2, PdCl2 and Cu(acac)2 in oleylamine and oleic acid (see the ESI† for the details). To decrease the utilization of costly Pt, smaller sized NPs below 10 nm were obtained when the concentration of the copper precursor was increased to 9 times that of the Pt precursor (Pt : Pd : Cu, 1 : 1 : 9), as shown in Fig. 1a. Moreover, ∼17 nm sized PtPdCu1, 13 nm sized PtPdCu3 and 9 nm sized PtPdCu6 NPs were synthesized as well for comparison (Fig. S1a–c, ESI†). The initial molar ratio of the Pt, Pd and Cu precursors was adjusted to control the bulk composition of the starting materials. Basically, a linear relationship between them was confirmed by inductively coupled plasma mass spectrometry (ICP) (Fig. S2a, ESI†). Yet, the Cu precursor seems to be a particle size controller, which means that a higher concentration of Cu precursor in the synthesis of Pt-based alloys results in the formation of, unlike the reported results, smaller sized NPs.14 The variations in crystalline structure, composition and particle size are reflected in the distinctly different XRD patterns, where the sample produced with a higher Cu content shows an obvious shift of the (111) peak and the smaller particle sized one presents a broader half-peak width (Fig. S3a, ESI†).
Fig. 1. (a) TEM and (b) HRTEM images of the initial PtPdCu9 NPs. (c) The EDX line-scan profile of a randomly chosen PtPdCu9 NP. The inset shows the corresponding HAADF-STEM image with the white arrow indicating the line scan direction. The scale bar is 5 nm. (d) Elemental mapping of a PtPdCu9 NP.
Besides the particle size effect, the composition distribution of a NP has a direct effect on the geometric morphology of the post-treated NP upon chemical leaching, like compositional segregation.15 The HRTEM image from Fig. 1b shows that the PtPdCu9 NPs have atomic disorder. The element distribution in the PtPdCu9 NPs was further studied by STEM-EDX line-scan and mapping, as shown in Fig. 1c and d. The results suggested that the surface was Pt-enriched, the core was Pd-enriched, and Cu was distributed in the whole region for the PtPdCu9 NP. We further clarified the element distribution from the surface to the core region by comparing XPS and ICP data (Fig. S2c and S2a, ESI†). Based on the estimated sampling depth of ∼2 nm for XPS, the measured data was referred to as the composition in the surface region. The data from ICP was adopted as the bulk composition. The atomic ratio of Pt is much higher at the surface than in the bulk of the NPs indicating that Pt is apt to be located on the surface of the NPs compared with Pd and Cu.
We hypothesize that the inhomogeneity throughout the NP with a Pt enriched surface relies on the formation of PdCu-rich nuclei from the initial thermolytic reduction of the Pd and Cu precursors followed by the reduction of the Pt precursor. The fast nucleation tendency of Pd is possibly explained by the presence of the ligand PdCl2.16 Cu salt is more likely to be reduced faster than the Pt precursor because of the difference in reduction potential which has a high dependence on the precursor concentration in the reaction.17
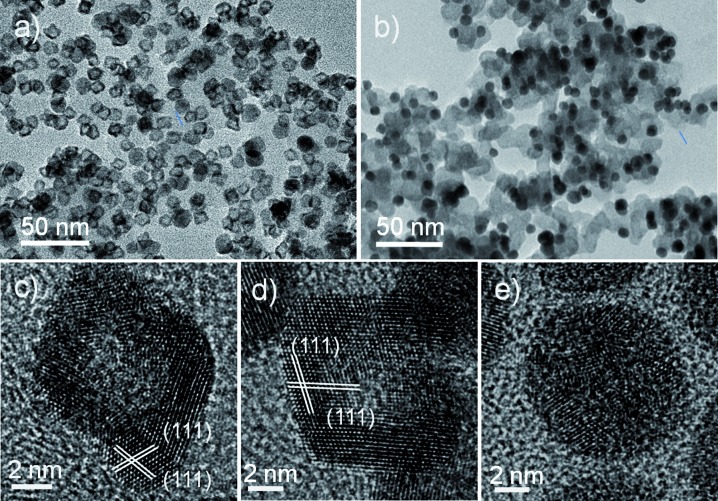
To avoid the aggregation of the NPs after removal of the surfactant, the pristine PtPdCu NPs were supported on carbon for chemical leaching in acetic acid in air for 24 h under continuous magnetic stirring. The four treated samples in air are referred to as Dair–PtPdCu1, Dair–PtPdCu3, Dair–PtPdCu6, and Dair–PtPdCu9 (Fig. S1d–f, ESI and 2a†). After chemical etching, the bulk compositions were changed to Pt32Pd34Cu34, Pt21Pd24Cu55, Pt24Pd27Cu49, and Pt29Pd33Cu38, respectively (Fig. S2b, ESI†). There was a slight decrease in the content of Cu for Dair–PtPdCu1 and Dair–PtPdCu3 whereas there was a sharp depletion of Cu for Dair–PtPdCu6 and Dair–PtPdCu9. This result is in good agreement with the XRD results shown in Fig. S3b,† where the main peaks shift toward a lower degree obviously while the Cu content drops severely. The crystalline domain sizes of these dealloyed nanocrystals were roughly calculated from the XRD data as 13.2, 12.3, 8.5 and 6.1 nm, respectively (using the Scherrer equation), which are close to those obtained from analysis of the TEM images. The higher Pt content of PtPdCu1 and PtPdCu3 would help to passivate the surface and prevent further leaching in deep layers.6b Although the particle size was about 17 nm, bigger than the reported key particle size of 15 nm, solid NPs were obtained as shown in Fig. S1d.† However, for the PtPdCu6 and PtPdCu9 samples with a lower Pt content, the leaching rate is so fast that the surface Pt atoms cannot passivate the surface, leaving pores/channels for acid to penetrate the surface and enter the core region. Under this condition, hollow NPs can be achieved (Fig. 2a) even though the particle size is about 8 nm, which is far below the key particle size. The size and shape of the NPs after leaching is retained very well, implying that the surface atoms are inert and immovable owing to the presence of the Pt-enriched surface. Besides the particle size and the bulk composition, the compositional segregation plays an important role in the hollow formation and retention of the rhombic-like shape. It is worth noting that the obtained hollow NPs are composed of multiple single crystalline (111) domains (Fig. 2c and d) and show a smoother surface from the HADDF-STEM images (Fig. S4a and S4b, ESI†). Previous studies have demonstrated that a smooth surface is inherently more highly active toward the ORR than a rough surface with a high density of undesirable low-coordination sites, which can influence the interaction between exposed Pt atoms and the adsorbed species.18 On the other hand, to clarify the atmosphere effect, exemplified using the PtPdCu9 NPs, we performed chemical leaching under N2 gas for comparison. The corresponding product is named DN2–PtPdCu9. Clearly, unlike in air, the catalyst retained solid (Fig. 2b) and disordered structures (Fig. 2e). The potential difference in chemical leaching when carried out in air and in N2 could be the free corrosion potential or open circuit potential. The leaching in air has a higher corrosion potential and thus a higher corrosion ability.12d The final dealloyed composition in N2 is Pt12Pd16Cu72 (Fig. S2b, ESI†), very close to that of the initial NPs, which means that a little fraction of Cu was etched, showing a severe contrast to the result of chemical leaching in air, consistent with the XRD patterns (Fig. S3c, ESI†).
Fig. 2. TEM images of carbon supported Dair–PtPdCu9 (a) and DN2–PtPdCu9 NPs (b). HRTEM images of Dair–PtPdCu9 NPs (c and d) and a DN2–PtPdCu9 NP (e).
Thereafter, the leaching solution was collected after centrifugation for comparison. The color of the top solution is shown in Fig. S3d.† Obviously, the more Cu that was dissolved, the more blue the top solution would be. In addition, in order to confirm the composition of the dissolved species, we used ICP to analyse the top blue solution. Negligible Pt and Pd, but much Cu, was detected (Table S1, ESI†), implying that only Cu can be dissolved in acetic acid. If acetic acid was replaced with another acid, such as diluted HCl, the NPs were much smaller (Fig. S5, ESI†), hence, we attributed the size decrease to the presence of the Cl–/O2 pair which was responsible for the oxidative etching of Pd as reported.19 Besides, the synthetic protocol can also be modified to prepare unsupported hollow NPs (see the ESI† for the details). Fig. S6† presents TEM images of a series of NPs with four ratios dispersed in hexane. The unsupported DN2–PtPdCu9 NPs also can be obtained in the same way (Fig. S7, ESI†).
To study the Cu composition effect on the dealloying process at 8 nm, we synthesized PtPdCu6 NPs using an increased reaction temperature of 270 °C to get the same sized NPs; about 8 nm PtPdCu6 NPs (Fig. S8a, ESI†). At an increased temperature, the nucleation rate becomes faster so that smaller particles can be obtained. When the same chemical leaching protocol was performed on these 8 nm sized PtPdCu6 NPs, only some of the NPs changed to a hollow structure (yield > 60%), as shown in Fig. S8b.† This result suggests that the initial Cu content is more crucial under the same conditions.
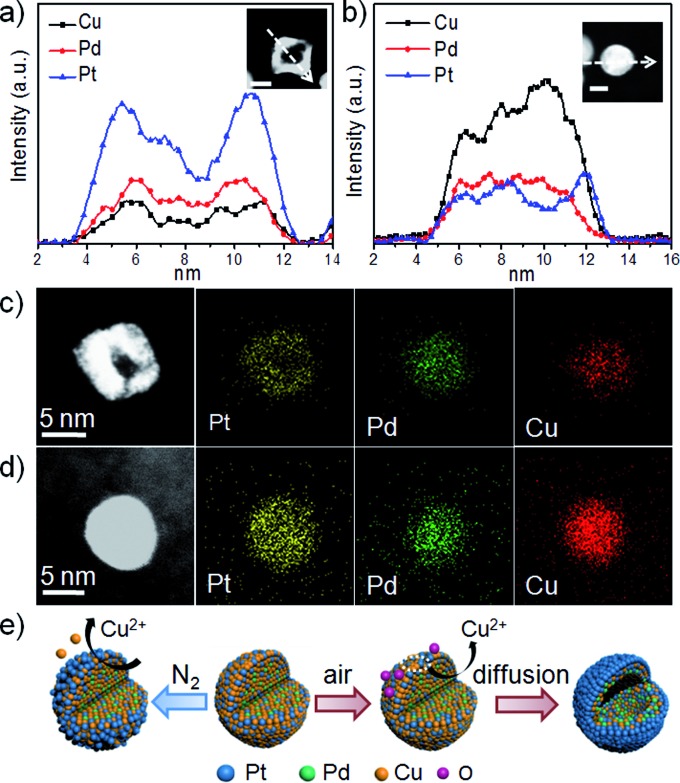
Further evidence was provided to address the fine structure of the chemical leached hollow structure. Fig. 3a shows the EDX line-scan profile measured from an individual hollow Dair–PtPdCu9 NP whose composition is Pt37Pd41Cu22 (Fig. S9a, ESI†). A distinct Pt-enriched surface is formed after acid treatment, and a similar distribution can also be observed in Fig. S9c.† From the elemental mappings shown in Fig. 3c, it can be seen that Pt is enriched on the surface of the NP, while Pd and Cu are in the center, consistent with the line scan profile. Not surprisingly, the XPS results (Fig. S2d, ESI†) clearly show the enhancement of the ratio of Pt and Pd and the drop in the Cu content at the surface after leaching. The residual Cu of the DN2–PtPdCu9 NPs is more than that of the Dair–PtPdCu9 NPs and is not unexpected. This general variation tendency is in close agreement with previously observed phenomena. This comparison can further assist us in better understanding the major factors for the hollow structure evolution. It can be concluded that this acid dealloying process under an oxidizing environment results in hollow NPs with a Pt enriched surface surrounding a PtPdCu core. According to Fig. 3b and d and S9b,† presenting data for a solid DN2–PtPdCu9 NP, the size, distributions, morphology and composition show just a bit of variation. The process here is analogous to the formation of a skeleton type structure in the near-surface region by intentional depletion of the non-noble metal from the surface, whereas the NP central region did not suffer much change.5b
Fig. 3. (a and b) EDX line-scan profiles of a selected hollow Dair–PtPdCu9 NP and a solid DN2–PtPdCu9 NP. The scale bars in the insets are 5 nm. (c and d) STEM images and element mappings of another Dair–PtPdCu9 NP and DN2–PtPdCu9 NP. (e) Schematic representation of PtPdCu alloy NP evolution during the acid dealloying under different atmospheres for the as prepared PtPdCu9 NP.
We proposed a dealloying mechanism as illustrated in Fig. 3e. As we know, acetic acid is not strong enough to dissolve Cu at room temperature. Thus, under a N2 atmosphere, just some of the surface Cu atoms can be oxidized and leached out in the acetic acid, but the inner Cu atoms can't be reached leading to the skeleton-like structure. However, this low Pt content alloy pristine material underwent a different process in the presence of O2. In our reaction system, vacancies can be easily formed due to the oxophilicity of Cu atoms on the surface and then the copper oxide quickly reacts with acetic acid. The fast dissolution of Cu on the surface and the adsorption of oxygen, allowing the reaction to occur deep in the Cu center, accelerate the migration of inner Cu outwards. The migration rate is so fast that the surface Pt atoms cannot passivate the surface. Then the successive migration of the inner Cu atoms outwards from the Cu enriched interior generates a flux of vacancies diffusing, leading to a cavity located in the center of the initial NPs and producing Pt-protected hollow structures. The nonuniform composition distribution is responsible for the sufficient supply of massive inner Cu atoms to diffuse outwards, instead of random leaching. Owing to the XPS in Fig. S2c,† we proposed that the content of Cu on the surface, which is determined by the initial adding ratio (above 75%), is of great importance for influencing the final shape in air. Otherwise it is not fast enough to suppress Pt surface diffusion, resulting in the surface passivated with Pt. Therefore, we outline that the compositional segregation, the initial Cu composition and the atmosphere have pivotal roles in determining the formation of the PtPdCu hollow structures.
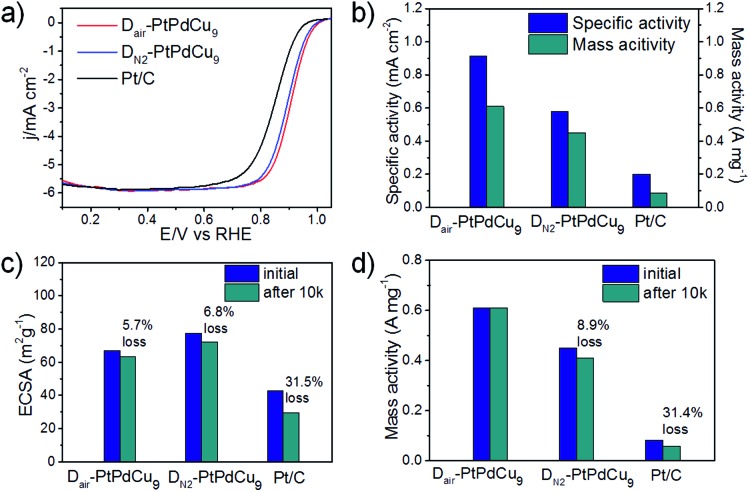
To investigate the effect of the surface structure on the catalytic activity toward the ORR, the as-prepared dealloyed samples were loaded on a rotation disk electrode and measured in a 0.1 M HClO4 solution. In the very initial CV measurement of the activated process (Fig. S10b, ESI†), the DN2–PtPdCu9 catalyst showed a distinct faradic-current peak, which is attributed to the dissolution of surface Cu, suggesting that the surface Cu atoms were not totally dissolved and some of them still remained on the surface in the absence of O2. However, the CV profile of typical Pt surface features shown in Fig. S10a† indicates the presence of a Pt-enriched surface of Dair–PtPdCu9. The electrochemical surface areas (ECSAs) evaluated from the CV profile shown in Fig. S11a,† were 67.1, 77.4, and 42.9 m2 g–1, respectively. The slightly smaller ECSA compared to the DN2–PtPdCu9 might be attributed to some closed hollows rather than open pores. ORR polarization curves for the catalysts in Fig. 4a show that both dealloyed catalysts exhibit an enhanced activity toward ORR over commercial Pt/C, especially Dair–PtPdCu9. The higher activity may be because of the smoother surface (smaller ECSA)18a and higher surface strain (hollow structure)20 of the Dair–PtPdCu9 relative to DN2–PtPdCu9. As shown in Fig. 4b, Dair–PtPdCu9 (0.61 A mg–1) represents a 1.36 and 7.1 fold enhancement in the mass activity relative to DN2–PtPdCu9 (0.45 A mg–1) and commercial Pt/C (0.086 A mg–1), respectively. Fig. 4c depicts the changes in the ECSAs for the three catalysts before and after the stability test. After 10k cycles, the Dair–PtPdCu9 catalyst lost 5.7% of its initial ECSA, and DN2–PtPdCu9 lost 6.8%, whereas the Pt/C catalyst suffered a severe degradation of 31.5% loss. The corresponding ORR curves before and after 10k cycles are shown in Fig. S11b–d,† revealing the excellent stability of the Dair–PtPdCu9 electrocatalyst. A negligible loss in the mass activity of Dair–PtPdCu9 was observed, much lower than that of DN2–PtPdCu9 (8.9%) and Pt/C (31.4%) (Fig. 4d). Although the Dair–PtPdCu9 catalyst did have a decrease in the number of catalytic surface active sites, a slight improvement in the specific activity after the stability test was observed, which can be attributed to the modified surface electronic structure and the adsorbate-bond energy for the oxygenated species caused by the surface-atomic rearrangement.21 The slightly enhanced specific activity has compensated for the minor loss of ECSA, thus retaining its mass activity constant. From the above, in contrast to commercial Pt/C, both Dair–PtPdCu9 and DN2–PtPdCu9 catalysts display outstanding activity and better durability. However, the unique hollow structure with a smoother Pt enriched surface is conducive to enhancing the durability and activity for the ORR.
Fig. 4. Electrochemical activities of Dair–PtPdCu9, DN2–PtPdCu9 and commercial Pt/C catalysts. (a) ORR polarization curves in O2-saturated 0.1 M HClO4 solution with a sweep rate of 20 mV s–1 and a rotation rate of 1600 rpm. (b) Specific activity and mass activity of these three catalysts. Comparison of ECSAs (c) and mass activities (d) for the catalysts before and after durability testing.
Conclusions
In summary, we present a facile method to prepare hollow ternary PtPdCu NPs derived from monodisperse alloyed PtPdCu NPs by acetic acid dealloying. By carefully controlling the reaction atmosphere and the initial Cu composition, single-cavity hollow ternary PtPdCu NPs with a Pt enriched surface surrounding a PtPdCu core can be prepared. Unlike the formation of porous NPs which are prevalent when above the key size cut-off, the fabrication of hollow NPs has been found to break the size limit in this study. The presence of O2, the high initial Cu content and composition segregation of the initial NPs were demonstrated to be major factors in determining the final hollow morphology. Our findings rectified the current knowledge that hollow alloy NPs cannot be prepared by a dealloying strategy and provided further understanding of the dealloying process in a ternary metallic system. Due to the unique hollow structure with a Pt enriched surface, the obtained trimetallic catalyst showed outstanding durability and improved catalytic activity toward the cathodic oxygen reduction reaction. It is expected that this strategy will be further applied to the rational design and nanoengineering of active and durable Pt-based catalysts in the future.
Acknowledgments
This work is supported by the Ministry of Science and Technology of China (Grants 2014CB931800, 2013CB933900) and the National Natural Science Foundation of China (Grants 21431006, 91227103). This work was also funded by the Deanship of Scientific Research (DSR), King Abdulaziz University, under grant no. (89-130-35-HiCi). The authors, therefore, acknowledge the technical and financial support of KAU.
Footnotes
References
- (a) Debe M. K. Nature. 2012;486:43–51. doi: 10.1038/nature11115. [DOI] [PubMed] [Google Scholar]; (b) Rabis A., Rodriguez P., Schmidt T. J. ACS Catal. 2012;2:864–890. [Google Scholar]
- (a) Guo S., Zhang S., Sun S. Angew. Chem., Int. Ed. 2013;52:8526–8544. doi: 10.1002/anie.201207186. [DOI] [PubMed] [Google Scholar]; (b) Wu J., Yang H. Acc. Chem. Res. 2013;46:1848–1857. doi: 10.1021/ar300359w. [DOI] [PubMed] [Google Scholar]; (c) Ataee-Esfahani H., Liu J., Hu M., Miyamoto N., Tominaka S., Wu K. C. W., Yamauchi Y. Small. 2013;9:1047–1051. doi: 10.1002/smll.201202539. [DOI] [PubMed] [Google Scholar]; (d) Ataee-Esfahani H., Imura M., Yamauchi Y. Angew. Chem., Int. Ed. 2013;52:13611–13615. doi: 10.1002/anie.201307126. [DOI] [PubMed] [Google Scholar]
- (a) Strasser P., Koh S., Anniyev T., Greeley J., More K., Yu C., Liu Z., Kaya S., Nordlund D., Ogasawara H., Toney M. F., Nilsson A. Nat. Chem. 2010;2:454–460. doi: 10.1038/nchem.623. [DOI] [PubMed] [Google Scholar]; (b) Wu J., Li P., Pan Y.-T., Warren S., Yin X., Yang H. Chem. Soc. Rev. 2012;41:8066–8074. doi: 10.1039/c2cs35189g. [DOI] [PubMed] [Google Scholar]; (c) Oezaslan M., Hasché F., Strasser P. J. Phys. Chem. Lett. 2013;4:3273–3291. [Google Scholar]; (d) Guo S., Zhang X., Zhu W., He K., Su D., Mendoza-Garcia A., Ho S. F., Lu G., Sun S. J. Am. Chem. Soc. 2014;136:15026–15033. doi: 10.1021/ja508256g. [DOI] [PubMed] [Google Scholar]; (e) Zhang S., Zhang X., Jiang G., Zhu H., Guo S., Su D., Lu G., Sun S. J. Am. Chem. Soc. 2014;136:7734–7739. doi: 10.1021/ja5030172. [DOI] [PubMed] [Google Scholar]
- (a) Stamenkovic V. R., Fowler B., Mun B. S., Wang G., Ross P. N., Lucas C. A., Marković N. M. Science. 2007;315:493–497. doi: 10.1126/science.1135941. [DOI] [PubMed] [Google Scholar]; (b) Yu T., Kim D. Y., Zhang H., Xia Y. Angew. Chem., Int. Ed. 2011;50:2773–2777. doi: 10.1002/anie.201007859. [DOI] [PubMed] [Google Scholar]; (c) Cui C., Gan L., Li H.-H., Yu S.-H., Heggen M., Strasser P. Nano Lett. 2012;12:5885–5889. doi: 10.1021/nl3032795. [DOI] [PubMed] [Google Scholar]
- (a) Stamenkovic V. R., Mun B. S., Mayrhofer K. J. J., Ross P. N., Markovic N. M. J. Am. Chem. Soc. 2006;128:8813–8819. doi: 10.1021/ja0600476. [DOI] [PubMed] [Google Scholar]; (b) Wang C., Chi M., Li D., Strmcnik D., van der Vliet D., Wang G., Komanicky V., Chang K.-C., Paulikas A. P., Tripkovic D., Pearson J., More K. L., Markovic N. M., Stamenkovic V. R. J. Am. Chem. Soc. 2011;133:14396–14403. doi: 10.1021/ja2047655. [DOI] [PubMed] [Google Scholar]
- (a) Wang D., Yu Y., Xin H. L., Hovden R., Ercius P., Mundy J. A., Chen H., Richard J. H., Muller D. A., DiSalvo F. J., Abruña H. D. Nano Lett. 2012;12:5230–5238. doi: 10.1021/nl302404g. [DOI] [PubMed] [Google Scholar]; (b) Snyder J., McCue I., Livi K., Erlebacher J. J. Am. Chem. Soc. 2012;134:8633–8645. doi: 10.1021/ja3019498. [DOI] [PubMed] [Google Scholar]; (c) Chen C., Kang Y., Huo Z., Zhu Z., Huang W., Xin H. L., Snyder J. D., Li D., Herron J. A., Mavrikakis M., Chi M., More K. L., Li Y., Markovic N. M., Somorjai G. A., Yang P., Stamenkovic V. R. Science. 2014;343:1339–1343. doi: 10.1126/science.1249061. [DOI] [PubMed] [Google Scholar]; (d) Yamauchi Y. J. Ceram. Soc. Jpn. 2013;121:831–840. [Google Scholar]
- Li Y., Shi J. Adv. Mater. 2014;26:3176–3205. doi: 10.1002/adma.201305319. [DOI] [PubMed] [Google Scholar]
- (a) Yu X., Wang D., Peng Q., Li Y. Chem. Commun. 2011;47:8094–8096. doi: 10.1039/c1cc12416a. [DOI] [PubMed] [Google Scholar]; (b) Zhang H., Jin M., Liu H., Wang J., Kim M. J., Yang D., Xie Z., Liu J., Xia Y. ACS Nano. 2011;5:8212–8222. doi: 10.1021/nn202896q. [DOI] [PubMed] [Google Scholar]; (c) Wang L., Yamauchi Y. J. Am. Chem. Soc. 2013;135:16762–16765. doi: 10.1021/ja407773x. [DOI] [PubMed] [Google Scholar]
- (a) Liu Y., Goebl J., Yin Y. Chem. Soc. Rev. 2013;42:2610–2653. doi: 10.1039/c2cs35369e. [DOI] [PubMed] [Google Scholar]; (b) Ataee-Esfahani H., Nemoto Y., Wang L., Yamauchi Y. Chem. Commun. 2011;47:3885–3887. doi: 10.1039/c0cc05233g. [DOI] [PubMed] [Google Scholar]
- (a) Li H. H., Cui C. H., Zhao S., Yao H. B., Gao M. R., Fan F. J., Yu S. H. Adv. Energy Mater. 2012;2:1182–1187. [Google Scholar]; (b) Xia X., Wang Y., Ruditskiy A., Xia Y. Adv. Mater. 2013;25:6313–6333. doi: 10.1002/adma.201302820. [DOI] [PubMed] [Google Scholar]
- Gilroy K. D., Farzinpour P., Sundar A., Hughes R. A., Neretina S. Chem. Mater. 2014;26:3340–3347. [Google Scholar]
- (a) Oezaslan M., Heggen M., Strasser P. J. Am. Chem. Soc. 2011;134:514–524. doi: 10.1021/ja2088162. [DOI] [PubMed] [Google Scholar]; (b) Wang R., Xu C., Bi X., Ding Y. Energy Environ. Sci. 2012;5:5281–5286. [Google Scholar]; (c) Gan L., Heggen M., Rudi S., Strasser P. Nano Lett. 2012;12:5423–5430. doi: 10.1021/nl302995z. [DOI] [PubMed] [Google Scholar]; (d) Gan L., Heggen M., O'Malley R., Theobald B., Strasser P. Nano Lett. 2013;13:1131–1138. doi: 10.1021/nl304488q. [DOI] [PubMed] [Google Scholar]
- Li D., Wang C., Tripkovic D., Sun S., Markovic N. M., Stamenkovic V. R. ACS Catal. 2012;2:1358–1362. [Google Scholar]
- Ahrenstorf K., Albrecht O., Heller H., Kornowski A., Görlitz D., Weller H. Small. 2007;3:271–274. doi: 10.1002/smll.200600486. [DOI] [PubMed] [Google Scholar]
- Cui C., Gan L., Heggen M., Rudi S., Strasser P. Nat. Mater. 2013;12:765–771. doi: 10.1038/nmat3668. [DOI] [PubMed] [Google Scholar]
- (a) Shevchenko E. V., Talapin D. V., Schnablegger H., Kornowski A., Festin Ö., Svedlindh P., Haase M., Weller H. J. Am. Chem. Soc. 2003;125:9090–9101. doi: 10.1021/ja029937l. [DOI] [PubMed] [Google Scholar]; (b) Ortiz N., Skrabalak S. E. Angew. Chem., Int. Ed. 2012;51:11757–11761. doi: 10.1002/anie.201205956. [DOI] [PubMed] [Google Scholar]
- Min Y., Kwak J., Soon A., Jeong U. Acc. Chem. Res. 2014;47:2887–2893. doi: 10.1021/ar500133w. [DOI] [PubMed] [Google Scholar]
- (a) Koenigsmann C., Zhou W.-p., Adzic R. R., Sutter E., Wong S. S. Nano Lett. 2010;10:2806–2811. doi: 10.1021/nl100718k. [DOI] [PubMed] [Google Scholar]; (b) Liu X.-J., Cui C.-H., Gong M., Li H.-H., Xue Y., Fan F.-J., Yu S.-H. Chem. Commun. 2013;49:8704–8706. doi: 10.1039/c3cc44503h. [DOI] [PubMed] [Google Scholar]
- Zheng Y., Zeng J., Ruditskiy A., Liu M., Xia Y. Chem. Mater. 2014;26:22–33. [Google Scholar]
- Wang J. X., Ma C., Choi Y., Su D., Zhu Y., Liu P., Si R., Vukmirovic M. B., Zhang Y., Adzic R. R. J. Am. Chem. Soc. 2011;133:13551–13557. doi: 10.1021/ja204518x. [DOI] [PubMed] [Google Scholar]
- (a) Cui C.-H., Liu X.-J., Li H.-H., Gao M.-R., Liang H.-W., Yao H.-B., Yu S.-H. ChemCatChem. 2012;4:1560–1563. [Google Scholar]; (b) Cui C.-H., Li H.-H., Cong H.-P., Yu S.-H., Tao F. Chem. Commun. 2012;48:12062–12064. doi: 10.1039/c2cc35822k. [DOI] [PubMed] [Google Scholar]
Associated Data
This section collects any data citations, data availability statements, or supplementary materials included in this article.


