Abstract
Accurate quantification of chemical exchange saturation transfer (CEST) effects, including dipole-dipole mediated relayed nuclear Overhauser enhancements (rNOE) saturation transfer, is important for applications and studies of molecular concentration and transfer rate (and thereby pH or temperature). Although several quantification methods, such as Lorentzian difference (LD) analysis, multiple-pool Lorentzian fits, and the three-point method, have been extensively used in several preclinical and clinical applications, the accuracy of these methods has not been evaluated. Here we simulated multiple-pool Z-spectra containing the pools that contribute to the main CEST and rNOE saturation transfer signals in brain, and numerically fit them using the different methods, and then compared their derived CEST metrics with the known solute concentrations and exchange rates. Our results show that the LD analysis overestimates contributions from amide proton transfer (APT) and intermediate exchanging amine protons; the three-point method significantly underestimates both APT and rNOE saturation transfer at −3.5 ppm (NOE(−3.5)). In contrast, the multiple-pool Lorentzian fit is more accurate than the other two methods, but only at lower irradiation powers (< 1 μT at 9.4 T) within the range of our simulations. At higher irradiation powers, this method is also inaccurate because of the presence of a fast exchanging CEST signal that has a non-Lorentzian lineshape. Quantitative parameters derived from in vivo images of rodent brain tumor obtained using an irradiation power of 1 μT were also compared. Our results demonstrate that all three quantification methods show similar contrasts between tumor and contralateral normal tissue for both APT and the NOE(−3.5). However, the quantified values of the three methods are significantly different. Our work provides insight into the fitting accuracy obtainable in a complex tissue model and provides guidelines for evaluating other newly developed quantification methods.
Keywords: Chemical exchange saturation transfer (CEST), Amide proton transfer (APT), Nuclear Overhauser Enhancement (NOE), Lorentzian fit
Graphical abstract
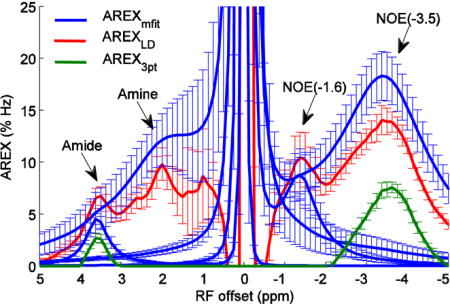
Accurate quantification of CEST and rNOE saturation transfer signals is important, but challenging. In this work, we evaluated the accuracy of several CEST quantification methods, including multiple-pool Lorentzian fit, Lorentzian difference (LD) analysis, and three-point method, and found that the three-point method (AREX3pt) significantly underestimates APT and NOE(−3.5), the LD analysis (AREXLD) overestimates APT and underestimates NOE(−3.5). In contrast, the multiple-pool Lorentzian fit (AREXmfit) is more accurate than the other two methods, but only at low irradiation powers of <= 1 μT.
INTRODUCTION
Chemical exchange saturation transfer (CEST), including relayed nuclear Overhauser enhancements (rNOE) mediated by chemical exchange, can indirectly detect solute molecules in the millimolar range as well as reflect their chemical environment (e.g. pH, temperature) through measurement of water signal changes caused by a cumulative transfer effect from saturated protons 1,2. CEST or rNOE saturation transfer thus provides amplification processes and have potential for high-sensitivity molecular and pH imaging. In CEST or rNOE saturation transfer experiments, a Z-spectrum (the water signal as a function of saturation frequency offset) is usually acquired so that the effects of exchange or dipolar interactions at a specific frequency are identified by corresponding dips. In vivo, these dips indicate saturation transfer effects from small metabolites or macromolecules that may vary with pathology and, hence, have clinical relevance. Amide proton transfer (APT), a variation of CEST at 3.5 ppm from the water peak, can detect mobile protein/peptide concentrations 3 and pH 4–6 and has been applied to studies of tumors 3,7–10 and ischemic stroke 11–14. Amine-water proton transfer effects between 2 and 3 ppm have been used to detect creatine 15–17 and glutamate 18 and have shown potential for diagnosing muscular and neurological diseases. rNOE saturation transfer centered at −3.5 ppm (NOE(−3.5)) was reported to reflect both proteins and membrane lipids 19 and has been applied in diagnosing tumors 20–22. More recently, a new rNOE saturation transfer signal at around −1.6 ppm (NOE(−1.6)) was reported that varies between normal brain and tumor or ischemia 23,24.
However, both CEST and rNOE saturation transfer indirectly detect solute molecules by observing water signal changes caused by chemical exchange or relayed NOEs, and thus depend on multiple non-specific tissue parameters including water longitudinal relaxation time (T1w), direct water saturation (DS), semi-solid MT effects, and other nearby CEST or rNOE saturation transfer effects. Therefore, direct comparisons of CEST and rNOE saturation transfer signals between normal and pathological tissues may be misinterpreted due to changes in these other confounding factors. Accurate and specific quantification of CEST and rNOE saturation transfer signals is thus important for practical applications, and is also essential for measurements of molecular concentration, transfer rates, and thereby pH or temperature.
To isolate the solute contribution to a CEST or an rNOE saturation transfer signal, a reference signal is traditionally acquired that experiences similar direct DS and MT effects. However, acquisition of an accurate reference signal in a complex biological system is challenging. For example, the commonly used asymmetric analysis (MTRasym) obtains a reference signal at the offset frequency symmetric about the water resonance 2. However, while this method works well for analyzing chemical phantoms with a small number of constituents, it cannot provide an accurate reference signal in vivo because of the presence of multiple pools on both sides of the water peak, including asymmetric semi-solid macromolecular resonances 25. To solve this problem, several alternative approaches, such as the Lorentzian difference (LD) analysis, multiple-pool Lorentzian fit, and three-point method, are used which avoid the use of reference signals 5,17,20,26–34.
In addition to the difficulties of acquiring an accurate reference signal, recent studies have showed that conventional CEST data analyses (subtraction of label and reference signals) cannot fully remove DS and semi-solid MT effects, because CEST, DS, and semi-solid MT signals do not add linearly 35. Instead, an inverse subtraction of label and reference signals may be used to cancel out confounding contributions for spin systems in a steady state. This inverse data analysis has been combined with the multiple-pool Lorentzian fit 26 and the three-point method 33 for quantification of the APT and rNOE saturation transfer in vivo. Although the specificities of these combined methods have been investigated 33,36,37, the absolute accuracies of these three quantification methods have not yet been evaluated. For example, the LD analysis may not provide an accurate reference signal for a specific solute when there are overlapping signals from nearby pools. The multiple-pool Lorentzian fit assumes that each CEST, rNOE saturation transfer, DS, and semi-solid MT signal can be approximated as a Lorentzian lineshape 31. However, the exchange rate of some amine pools is much faster than the NMR time scale and are in the intermediate to fast exchange regime 2. Thus these pools may coalesce with the water pool, and their CEST signals may be difficult to separate from the water signal. In particular, a previous study has reported that the fast exchanging CEST signal cannot be quantified by simple mathematical models (e.g. Lorentzian function) 38. In addition, previous models typically contain a single amine pool at 2 ppm when doing a multiple-pool Lorentzian fit. However, multiple amine pools with different resonance frequency offsets and line widths have been reported 39. Hence, a single Lorentzian function or a three-point method that relies on two nearby signals as a reference may not be accurate. In this paper, we evaluate the accuracies of these three quantification methods through numerical simulations, and compare their fitting results in a rodent brain tumor model.
METHODS
Lorentzian fit of reference signals
We performed Lorentzian fitting of Z-spectra using a non-linear optimization algorithm. Eq. (1) gives the model function of the Lorentzian fit method.
| (1) |
Here, S(Δω) is the CEST signals as a function of irradiation frequency offset from water (Δω); S0 is a control water signal with no RF irradiation; Li(Δω)=Ai/(1+(Δω − Δi)2/(0.5Wi)2), which represents a Lorentzian line with central frequency offset from water (Δi), peak full width at half maximum (Wi), peak amplitude (Ai); N is the number of fitted pools.
We first performed a LD analysis to remove the DS and semi-solid MT effects. In this method, a two-pool (semi-solid and water) model Lorentzian fit was performed to process the Z-spectra with frequency offsets of ±4000, ±3500, ±3000, ±2500 ±200, ±150, ±100, ±50, and 0 Hz (−10 to −6.25 ppm, −0.5 to 0.5 ppm, and 6.25 to 10 ppm on 9.4 T). The fitted spectra were used as reference signals which represent the DS and semi-solid MT effects. CEST residual spectra were then created by subtracting the measured Z-spectra from the two-pool fitted spectra. To further resolve each CEST and rNOE saturation transfer peak, we also performed multiple-pool Lorentzian fits of the Z-spectra. Multiple-pool Lorentzian functions were previously used to fit Z-spectra as a combination of several components: using three pools (solute, water, and background semi-solid pool) 31, four pools (amide, amine, water, and NOE(−3.5)) 30, and five pools (amide, amine, water, NOE(−3.5), and semi-solid MT) 26. Here, we added the NOE(−1.6) pool in the multiple-pool Lorentzian fit. That is, we performed a six-pool (amide, amine, water, NOE(−1.6), NOE(−3.5), and MT) model Lorentzian fit to process the Z-spectra obtained with frequency offsets at ±4000, ±3500, ±3000, ±2500, and from −2000 to 2000 Hz with a step of 50 Hz (−10 to 10 ppm on 9.4 T), except where noted. The reference signals were obtained by setting the fitted amplitude of the target CEST or rNOE saturation transfer pools to zero according to a previous publication 26.
The fitting of each spectrum was performed to achieve the lowest root mean square (RMS) of residuals between the simulated or measured data and the Lorentzian model in the selected segment. All fitting methods for in vivo experiments were performed voxel by voxel with images smoothed by a 3 × 3 median filter before fitting. Table 1 lists the starting points and boundaries of the fit for both the LD analysis and the multiple-pool Lorentzian fit. The goodness of fit was observed by the sum of squared errors.
Table 1.
Starting points and boundaries of the amplitude, width, and offset of the six-pool Lorentzian fit. The unit of peak width and offset is ppm.
| Start | Lower | Upper | |
|---|---|---|---|
| Awater | 0.9 | 0.02 | 1 |
| Wwater | 1.4 | 0.3 | 10 |
| Δwater | 0 | −1 | 1 |
| Aamide | 0.025 | 0 | 0.2 |
| Wamide | 0.5 | 0.4 | 3 |
| Δamide | 3.5 | 3 | 4 |
| Aamine | 0.01 | 0 | 0.2 |
| Wamine | 1.5 | 0.5 | 5 |
| Δamine | 2 | 1 | 3 |
| ANOE(−1.6) | 0.001 | 0 | 0.2 |
| WNOE(−1.6) | 1 | 0 | 1.5 |
| ΔNOE(−1.6) | −1.5 | −2 | −1 |
| ANOE(−3.5) | 0.02 | 0 | 1 |
| WNOE(−3.5) | 3 | 1 | 5 |
| ΔNOE(−3.5) | −3.5 | −4.5 | 2 |
| AMT | 0.1 | 0 | 1 |
| WMT | 25 | 10 | 100 |
| ΔMT | 0 | −4 | 4 |
Three-point fit of reference signals
The three-point method is a simple quantification method which has been used previously to quantify APT and NOE(−3.5) 5,33. Here, a straight line between two points at 3 and 4 ppm on a Z-spectrum was used as reference for APT quantification, and a straight line between two points at −2 and −5 ppm on a Z-spectrum was used as reference for NOE(−3.5) quantification according to a previous publication 33.
Quantification of CEST and rNOE saturation transfer
The previous sections discussed three different approaches for determining the label and reference signals: LD analysis, multiple-pool Lorentzian fit, and the three-point method. In this section, we examine a separate question: how to use the reference and label signals to create a sensitive and specific metric. To quantify the CEST or rNOE saturation transfer signals, a direct subtraction of reference signal (Sref(Δω)) and label signal (Slab(Δω)) with normalization by S0, called magnetization transfer ratio (MTR) (Eq. 2), has been previously proposed 2.
| (2) |
The direct subtraction analysis has been used in the multiple-pool Lorentzian fit (named MTRmfit here), the LD analysis (named MTRLD here), and the three-point method (named MTR3pt here). However, Zaiss et. al. 35 showed the MTR still depends on T1w, DS and semi-solid MT even if accurate reference signals can be obtained, and thus is not specific to the solute. Instead, an inverse subtraction analysis with correction of apparent water longitudinal relaxation rate (R1obs), named apparent exchange-dependent relaxation (AREX), was provided 36,
| (3) |
where fc is the semi-solid MT pool size ratio. The term (1+fc), although is not shown in previous AREX imaging 40, has been recently proved to be able to make the AREX more specific when the semi-solid MT pool is present 36. Here, Rcestex(Δω) is independent of non-specific tissue parameters (e.g. T1w, DS, and semi-solid MT effects), but depends only on solute concentration (fs), solute-water exchange rate (ksw), solute transverse relaxation (R2s), and irradiation power (ω1) 35,36,40, as shown in Eq. (4).
| (4) |
AREX is thus a more specific data analysis method than conventional MTR. In previous works 26,33, AREX has been combined with the three-point method (named AREX3pt here) and the multiple-pool Lorentzian fit method ((named AREXmfit here). Here, we also combine AREX with the Lorentzian difference analysis (named AREXLD here).
Evaluating of the accuracy of the quantification methods
The simple analytic solution to the AREX method in Eq. (4) provides an easy way to evaluate the accuracy of the CEST or rNOE saturation transfer quantification methods through numerical simulations. Specifically, Z-spectra are first created using a multiple-pool model numerical simulation that mimics the biological tissues. AREXmfit, AREXfit, and AREX3pt are then obtained from the simulated Z-spectra, and Rcestex(Δω) are calculated with the same tissue and sequence parameters as those used in the simulations. Comparisons between Rcestex and the three metrics are then performed to evaluate the accuracy of these quantification methods.
Eq. (4) was derived assuming only two pools: a solute (s) and water (w). Hence, differences between the Eq. (3) metric (derived from fitting the seven-pool simulated data) and the Eq. (4) metric (calculated directly using only data from two of the pools) are due to overlapping signal contributions, and hence indicate non-specificity in the corresponding metric.
Numerical simulations
Simulated Z-spectra were created using a seven-pool (amide at 3.5 ppm, fast exchanging amine at 3 ppm, intermediate exchanging amine at 2 ppm, NOE at −1.6 ppm, NOE at −3.5 ppm, semi-solid MT centered at −2.3 ppm 41, and water at 0 ppm) model mimicking complex biological tissues at 9.4 T. The choice of seven pools was inspired by observing in vivo Z-spectra and CEST residual spectra in Figs. 1a and 1b. Although the mechanisms of rNOEs are different from CEST and would in principle require calculation of both dipole-dipole and chemical exchange effects, the net effect is quite similar to a conventional CEST pool 42. Hence, we treated the rNOE saturation transfer pools as CEST pools in the simulations. In addition, we also simulated Z-spectra in which each pool was removed separately. These six-pool model simulations were used to evaluate the influence of one specific pool on the quantification of other pools.
FIG. 1.
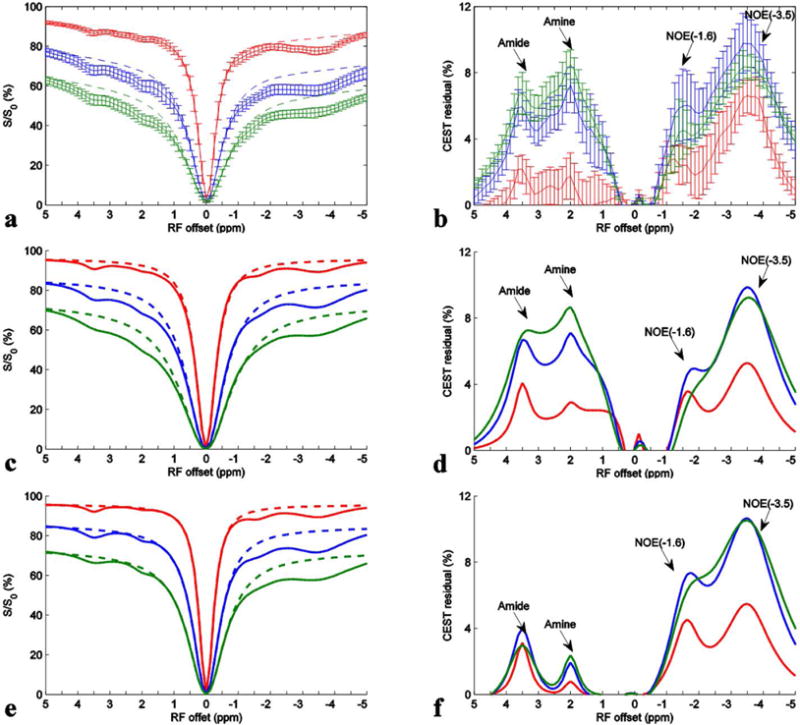
Experimental and simulated Z-spectra (a, c, and e) and CEST residual spectra (b, d, and f) with irradiation powers of 0.5 μT (solid red), 1.0 μT (solid blue), and 1.5 μT (solid green). Dashed lines in (a, c, and e) are the reference signals obtained with the Lorentzian fit of background DS and MT effects. (a and b) are from live rat brain; (c and d) are from the seven-pool model simulations; (e and f) are from a six-pool (without fast exchanging amine) model simulations.
All simulations were performed with irradiation powers of 0.5, 1, and 1.5 μT using the tissue parameters listed in Table 2. To examine the dependence on tissue parameters, we varied the water longitudinal relaxation time T1w=1/R1w (0.5, 1.0, 1.5, 2.0, 2.5 s), water transverse relaxation time T2w=1/R2w (25, 50, 75, 100, 125 ms), fc (0, 0.05, 0.1, 0.15, 0.2), amide longitudinal relaxation time T1s (0.5, 1.0, 1.5, 2.0, 2.5 s), amide transverse relaxation time T2s (1, 2, 5, 10, 20 ms), and fast exchanging amine concentration fn (0, 0.0025, 0.005, 0.0075, 0.01). Each parameter was varied individually, with all other parameters remaining at the value in bold. R1obs was calculated according to Ref 36,
| (5) |
where R1c is the longitudinal relaxation rate of the semi-solid MT pool.
Table 2.
Parameters for the seven-pool numerical simulation with solute concentration (fs), solute-water exchange rate (ksw), longitudinal relaxation time (T1), transverse relaxation time (T2), and solute resonance frequency offset (Δ). Water content was set to be 1.
An additional set of simulations was performed to address the narrow question of the lineshape generated by fast-exchanging amine protons. Specifically, Z-spectra were simulated using a two-pool (fast exchanging amine and water) model with solute resonance frequency offsets at 3, 6, 12, and 21 ppm. The resulting simulated Z-spectra were used as label spectra and corresponding simulated Z-spectra from a one-pool (water) model were used as reference spectra. These two spectra were used to create the simulated fast exchanging amine AREX spectra using Eq. (3). This use of a one-pool model is distinct from the approach used to calculate AREXmfit and AREXLD where the reference signals were obtained by fitting multi-pool simulated Z-spectra and thus may include confounding contributions from multiple exchanging pools. This simulated fast exchanging amine AREX spectra can thus accurately isolate the fast exchanging amine signal from the water signal. Through comparison with Rcestex spectra, we can determine whether the fast exchanging amine signal has a Lorentzian lineshape.
The seven-pool model contains nineteen coupled Bloch equations and can be written as , where A is a 19 × 19 matrix. The water and solute pools each has three coupled equations representing their x, y, and z components. The semi-solid MT pool has a single coupled equation representing the z component, with a Lorentzian absorption lineshape. All numerical calculations of the Z-spectra integrated the differential equations through the continuous wave (CW) sequence using the ordinary differential equation (ODE) solver in MATLAB. Z-spectra with fewer pools were simulated by setting the corresponding pool concentration to zero.
Phantom preparation
Two phantoms, 6 mM creatine and 10 mM glutamate (which are their physiological concentrations), were prepared in commercially available phosphate buffered saline (1 × PBS) buffer (10 mM PO43−, 137 mM NaCl, and 2.7 mM KCl). The pH was titrated to 7 by using NaOH/HCl and measurements were performed at 37°C.
Animal preparation
All animal experiments were approved by Animal Care and Usage Committee in Vanderbilt University. Each rat was injected with 1 × 10⁵ 9L glioblastoma cells in the right brain hemisphere, and was then imaged after 2 to 3 weeks when brain tumor was formed. Seven rats bearing 9L tumor were immobilized and anesthetized with a 2%/98% isoflurane/oxygen mixture. Respiration was monitored to be stable, and a constant rectal temperature of 37°C was maintained throughout the experiments using a warm-air feedback system (SA Instruments, Stony Brook, NY).
MRI
CEST and rNOE saturation transfer measurements were performed by applying a 5 s CW irradiation before a single-shot spin-echo Echo Planar Imaging (SE-EPI) acquisition. Z-spectra were acquired with RF offsets from −4000 Hz to −2000 Hz with step of 500 Hz, −2000 Hz to 2000 Hz with step of 50 Hz, 2000 Hz to 4000 Hz with step of 500 Hz (−10 ppm to 10 ppm on 9.4 T). Control images were acquired with RF offsets of 100000 Hz (250 ppm on 9.4 T). R1obs and fc were obtained using a selective inversion recovery (SIR) method 43. Specifically, a 1 ms inversion hard pulse was applied to invert the free water pool with subsequent longitudinal recovery times of 4, 5, 6, 8, 10, 12, 15, 20, 50, 200, 500, 800, 1000, 2000, 4000, and 6000 ms. SE-EPI was used for the readout scheme followed by a saturation pulse train to shorten total acquisition time as described previously 43,44. A constant delay time of 3.5 s was set between the saturation pulse train and the next inversion pulse. All measurements were performed on a Varian DirectDrive™ horizontal 9.4T magnet with a 38-mm Litz RF coil (Doty Scientific Inc. Columbia, SC). All images were acquired with matrix size 64 × 64, field of view 30 mm × 30 mm, and one acquisition.
Statistics
All statistical analyses were performed using Matlab R2013b (Mathworks, Natick, MA, USA). It was considered to be statistically significant when P < 0.05. Student’s t-test was employed to evaluate the signal difference between tumor and normal tissues.
RESULTS
Multiple CEST and rNOE saturation transfer pools in rat brain
Figs. 1a and 1b show the experimental Z-spectra from normal tissues in rat brains and the corresponding residual spectra after fitting the data between −10 ppm and −6.25 ppm, −0.5 ppm and 0.5 ppm, and 6.25 ppm and 10 ppm (not shown) to Lorentzian MT and DS effects. Signals from five rat brains were acquired with irradiation powers of 0.5 μT (red), 1.0 μT (blue), and 1.5 μT (green). It was found from Fig. 1a that the most distinct CEST and rNOE saturation transfer effects in brain in the range from −5 to 5 ppm arise from amide protons at around 3.5 ppm, amine protons at around 2 ppm, and NOE at around −1.6 and −3.5 ppm. In Fig. 1b, an additional broad peak appears to overlap with both the narrow amide CEST peak at 3.5 ppm and the narrow amine CEST peak at 2 ppm, which is consistent with the presence of multiple amine pools. Previous studies have validated two main metabolites: creatine (15–17) and glutamate (18) which have significant CEST effects from amines at 2 ppm and 3 ppm, respectively. Creatine has an exchange rate of several hundred Hertz, and thus may contribute to the narrow CEST peak at 2 ppm. Glutamate has an exchange rate of several thousands Hertz, and thus may contribute to the broad CEST peak. Here we named the amine pool with narrow peak as the intermediate exchanging amine pool and the amine pool with broad peak as the fast exchanging amine pool. The CEST effect from the fast exchanging amine pool at these irradiation powers is significant, but has not been previously noted.
To further validate the presence of the significant CEST effect from this fast exchanging amine pool at these irradiation powers, we performed multiple-pool numerical simulations with and without the fast exchanging amine pool. Figs. 1c and 1d show a seven-pool (containing all the above mentioned pools) model simulated Z-spectra and CEST residual spectra, respectively, with tissue parameters shown in Table 2. Figs. 1e and 1f show six-pool (without the fast exchanging amine pool) model simulated Z-spectra and CEST residual spectra, respectively, with tissue parameters shown in Table 2. Comparing the residual spectra in Figs. 1b, 1d, and 1f makes clear that a fast exchanging pool (as in Fig 1d) is necessary to qualitatively match the in vivo residuals (in Fig. 1b). The six pool model residuals in Fig. 1f, lacking a fast exchanging pool, are qualitatively different from the in vivo case. While the shape of the residuals using the LD analysis indicates the need for including a fast exchanging pool, the exact size and exchange rate for this pool is not clear. Furthermore, we have glossed over accuracy issues when fitting the DS and semi-solid MT effects in the LD analysis. For both these reasons, we advance to multiple-pool Lorentzian fit.
Figs. 2a and 2b show Z-spectra obtained on creatine (solid red) and glutamate (solid blue) phantoms with physiological concentrations and pH at irradiation power of 1 μT and 1.5 μT, respectively. Compared with the narrow amine peak from creatine, a broad peak from glutamate can be observed, which is consistent with the apparent broad peak in Fig. 1.
FIG. 2.

Z-spectra from creatine (solid red) and glutamate (solid blue) with irradiation power of 1 μT (a) and 1.5 μT (b), respectively. The dashed red and dashed blue curves are the mirror curves of those on the other sides of water resonance.
Quantification of CEST and rNOE saturation transfer signals
Fig. 3 shows the experimental AREXmfit spectra, AREXLD spectra, and AREX3pt spectra from contralateral normal tissues of seven rat brains with irradiation powers of 1.0 μT. It was found that AREXLD > AREXmfit > AREX3pt at 3.5 ppm, AREXmfit > AREXLD > AREX3p at −3.5 ppm, AREXmfit > AREXLD at 2 ppm, and AREXLD > AREXmfit at −1.6 ppm. The different values obtained with these three quantification methods indicate the necessity of evaluating their accuracies.
FIG. 3.
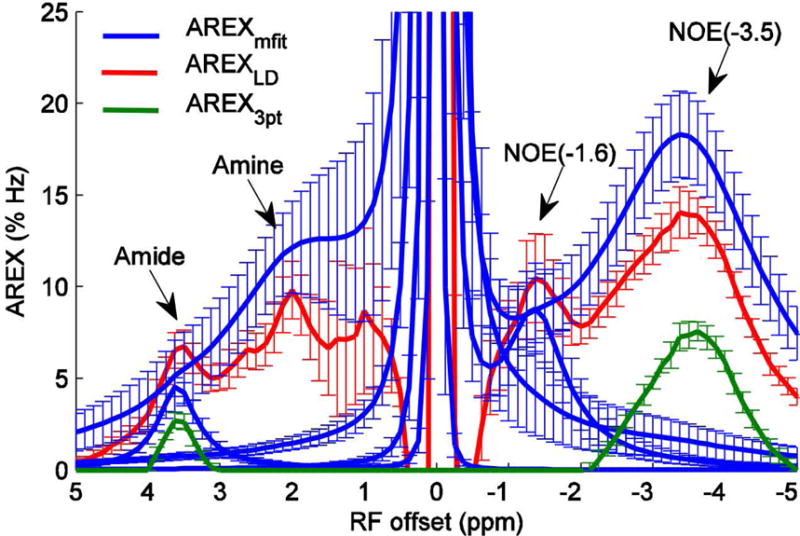
AREXmfit for amide, amine, NOE(−1.6), and NOE(−3.5) (blue) as well as AREXLD (red) and AREX3pt (green) from normal tissue of seven rat brains with irradiation powers of 1.0 μT.
Fig. 4 shows the AREXmfit spectra, AREXLD spectra, and AREX3pt spectra obtained from simulated Z-spectra, as well as the calculated Rcestex spectra from Eq. (4). The tissue parameters used in the simulation and calculation were the same and were from Table 2. The Z-spectra used in Fig. 4a, 4c, and 4e were from the seven-pool model numerical simulation. The Rcestex spectra centered at 2 ppm were calculated with the parameters of the intermediate exchanging amine pool. Table 3 lists the ratio of the peak intensities of the three AREX metrics to Rcestex to indicate how the AREX metrics match or deviate from the Rcestex.. We found that the relative magnitudes of these three metrics in Fig. 4 are in agreement with the experimental results in Fig. 3. In addition, through comparison with the Rcestex spectra, we found that the AREXmfit can correctly estimates APT at irradiation powers of 0.5 and 1.0 μT, but overestimates the APT at 1.5 μT; the AREXmfit also correctly estimates NOE(−3.5), but overestimates intermediate exchanging amine and underestimates NOE(−1.6); the AREXLD overestimates APT and intermediate exchanging amine, but underestimates NOE(−1.6) and NOE(−3.5); the AREX3pt significantly underestimates both APT and NOE(−3.5).
FIG. 4.
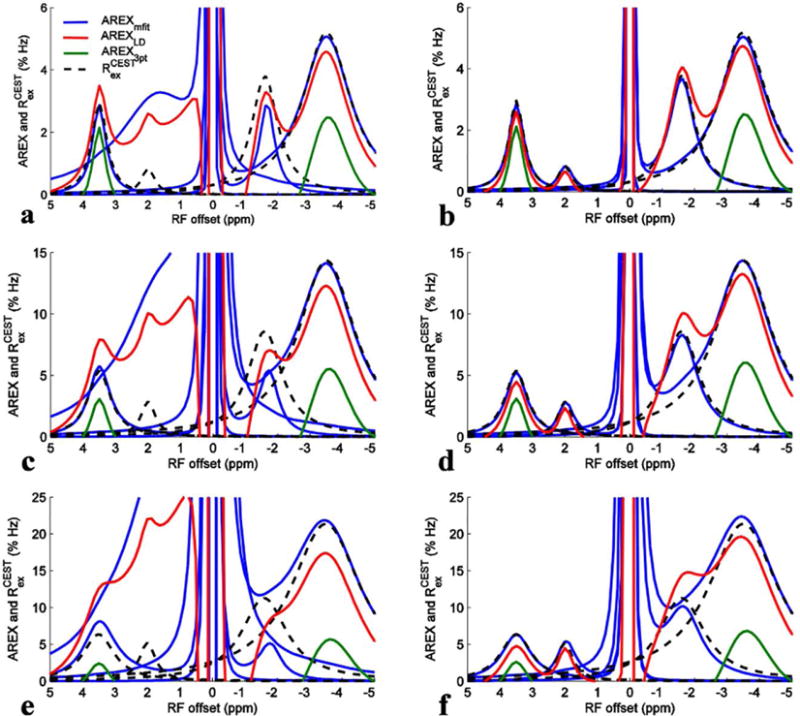
AREXmfit for amide, amine, NOE(−1.6), and NOE(−3.5) (blue) as well as AREXLD (red) and AREX3pt (green) from simulated Z-spectra with irradiation powers of 0.5 μT (a and b), 1.0 μT (c and d), and 1.5 μT (e and f). Calculated Rcestex spectra for amide, amine, NOE(−1.6), and NOE(−3.5) (dashed black) were also plotted for comparison with these three quantification methods. (a), (c), and (e) were from the seven-pool model simulations and (b), (d), and (f) were from a six-pool model (without fast exchanging amine) simulations.
Table 3.
Ratio of the peak intensities of the three AREX metrics to Rcestex at three different irradiation powers. Note that when the AREX metrics match Rcestex well, their ratios are equal to 1.
| Amide (0.5, 1, 1.5μT) | intermediate exchanging amine (0.5, 1, 1.5μT) | NOE(−1.6) (0.5, 1, 1.5μT) | NOE(−3.5) (0.5, 1, 1.5μT) | |
|---|---|---|---|---|
| AREX3pt/Rcestex (7 pool) | 0.7, 0.6, 0.4 | – | – | 0.5, 0.4, 0.3 |
| AREXLD/Rcestex (7 pool) | 1.2, 1.5, 2.0 | 3.1, 3.5, 4.2 | 0.9, 0.8, 0.6 | 0.9, 0.9, 0.8 |
| AREXmfit/Rcestex (7 pool) | 1.0, 1.1, 1.3 | 3.7, 4.2, 5.5 | 0.8, 0.6, 0.4 | 1.0, 1.0, 1.0 |
| AREX3pt/Rcestex (6 pool) | 0.7, 0.6, 0.4 | – | – | 0.5, 0.4, 0.3 |
| AREXLD/Rcestex (6 pool) | 0.9, 0.8, 0.7 | 0.8, 0.8, 0.9 | 1.1, 1.2, 1.3 | 0.9, 0.9, 0.9 |
| AREXmfit/Rcestex (6 pool) | 1.0, 1.0, 1.0 | 1.0, 1.0, 1.0 | 1.0, 1.0, 0.9 | 1.0, 1.0, 1.0 |
To study the origin of the inaccuracy of these quantification methods, we also performed a six-pool model numerical simulation in which each exchanging pool was removed separately (Fig. 4 and Sup. Fig. S1-S4). We found that the fast exchanging amine pool influences the quantification of other pools greatly. Fig. 4b, 4d, and 4f show the six-pool model numerical simulations without fast exchanging amine pool. The AREXmfit spectra for APT at 1.5 μT, intermediate exchanging amine, and NOE(−1.6) which deviate much from Rcestex spectra in the seven-pool model simulations, become close to Rcestex spectra after removal of the fast-exchanging amine pool, suggesting that it is the fast exchanging amine pool which introduces errors with this method. The AREXLD spectra for amide and amine become more close to Rcestex spectra, and the AREXLD spectra for NOE(−1.6) become higher than Rcestex spectra after removal of the fast exchanging amine pool, indicating that they should at the very least have contributions from the fast exchanging amine pool. The AREXLD spectra for NOE(−3.5) still underestimates Rcestex spectra, which indicates that it has smaller influences from fast exchanging amines, but may be influenced by the incorrect fit of the reference due to the extent of the broad NOE(−3.5) signal on the section of Z-spectra used for reference fitting; The AREX3pt still underestimates APT and NOE(−3.5), indicating that this three-point method has less influence from the fast exchanging amine.
To further study how the fast exchanging amine influences the quantification of other pools, we separately study this pool through numerical simulations. Fig. 5a shows the simulated fast exchanging amine AREX spectra and the Rcestex spectra at different resonance frequency offsets. The simulated fast exchanging amine AREX spectrum can show the lineshape of the fast exchanging amine signal by isolating it from water signal. It was found that these two spectra match well when the solute resonance frequency offsets are far from water resonance. However, these two spectra deviate significantly when they are close to water resonance. For the simulated fast exchanging amine AREX spectra at 3 ppm, it can be clearly found that (1) the simulated fast exchanging amine AREX peak is not at 3 ppm, but moves towards the water resonance; (2) the simulated fast exchanging amine AREX signal is clearly not a Lorentzian lineshape. This is caused by the coalescence of the water and amine CEST peaks at small offsets. This result indicates that Eq. (4) cannot model CEST effect in the fast exchange regime. Actually, the weird lineshape has already been previously modeled by a non-Lorentzian function, and is a complicated function of irradiation power, offset, and exchange rate 38. Fig. 5b shows the simulated fast exchanging amine AREX spectra with resonance frequency offset at 3 ppm as well as AREXmfit spectra for the fast exchanging amine and AREXLD spectra. It was found the AREXmfit underestimates the fast exchanging amine signal at 3.5 ppm which may contribute to the overestimation of amide by using this method. It was also found that the AREXLD are negative upfield, which may contribute to the increased AREXLD for NOE(−1.6) after removal of fast exchanging amine. The negative AREXLD upfield may be caused by the incorrect fit of the reference signal due to the extent of the broad fast exchanging amine signal on the section of Z-spectra for reference fitting.
Fig. 5.
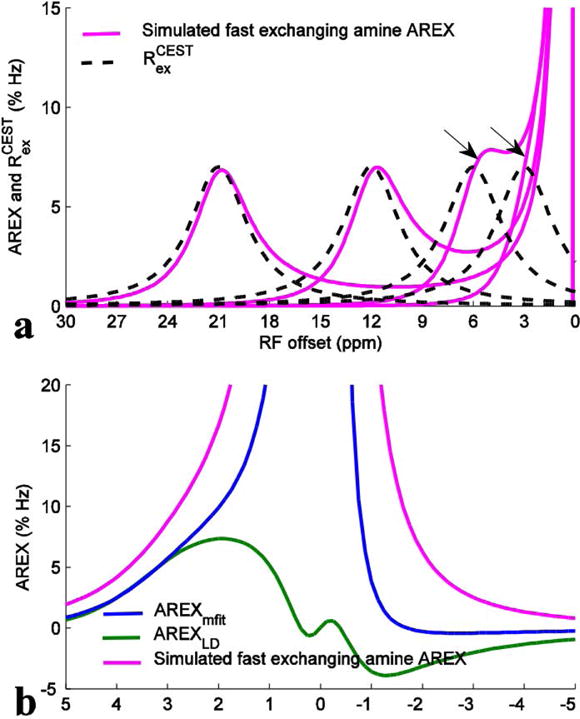
(a) Simulated fast exchanging amine AREX (magenta) and calculated Rcestex (dashed black) spectra with the resonance frequency offsets of the fast exchanging amine pool at 3, 6, 12, and 21 ppm (magenta). (b) Simulated fast exchanging amine AREX spectrum with resonance frequency offset of the fast exchanging amine pool at 3 ppm (magenta) as well as AREXmfit spectra (blue) for the fast exchanging amine and AREXLD spectra (green). The simulated fast exchanging amine AREX spectra were created by inverse subtraction of two-pool model (fast exchanging amine and water) simulated Z-spectra and one-pool model (water) simulated Z-spectra according to Eq. (3), which can accurately isolate the fast exchanging amine signal from water signal. The AREXmfit and the AREXLD spectrum were obtained by processing the two-pool model simulated Z-spectra. Note in (a) that although the simulated fast exchanging amine AREX spectra match the Rcestex spectra well when their solute resonance frequency offsets are far from water resonance, they deviate significantly from the Rcestex spectra when their offsets are close to water resonance (arrows), indicating that the fast exchanging amine CEST signal is not a Lorentzian lineshape. Note in (b) that both the AREXmfit and the AREXLD cannot successfully fit the fast exchanging amine CEST signals.
To confirm our conclusion drawn in Fig. 4 about the accuracy in the quantification of APT and NOE(−3.5) in a general case, we further performed simulations with a variety of tissue parameters. Fig. 6 shows the AREXmfit, AREXLD, AREX3pt, and the calculated Rcestex values for amide from simulated Z-spectra with variation of T1w (a), T2w (b), T1s (c), T2s (d), fm (e), and fn (f) and with irradiation power of 1 μT. It was found that AREX3pt underestimates amide and AREXLD overestimates amide in all cases. In contrast, AREXmfit with this irradiation power can provide better quantification of amide than the other two methods, except when fast exchanging amine concentration is high (see Fig. 6f). The AREX3pt value is relatively closer to the Rcestex value with longer T2s, suggesting that the accuracy of this method depends on CEST peak line width. It was also found that all three metrics are roughly independent on these tissue parameters, except for T2s, supporting the view that inverse analysis has improved specificity. Fig. 7 shows the same simulations as those in Fig. 6, but with irradiation power of 1.5 μT. Similar to Fig. 6, the AREX3pt still underestimates amide and AREXLD still overestimates amide in all cases. However, the AREXmfit with this relatively higher irradiation power overestimates amide in all cases which is different from that in Fig. 6. These general simulations in Fig. 6 and Fig. 7 are consistent with our conclusion drawn from Fig. 4 that the AREXmfit correctly estimates APT at low irradiation powers, but the AREXLD overestimates and the AREX3pt underestimates APT. For the quantification of NOE(−3.5) in a general case, our simulations with a variety of tissue parameters (Sup. Fig. S5 and S6) also confirm the conclusion drawn from Fig. 4 that the AREXmfit correctly estimates NOE(−3.5), but the AREXLD and AREX3pt underestimate NOE(−3.5).
FIG. 6.
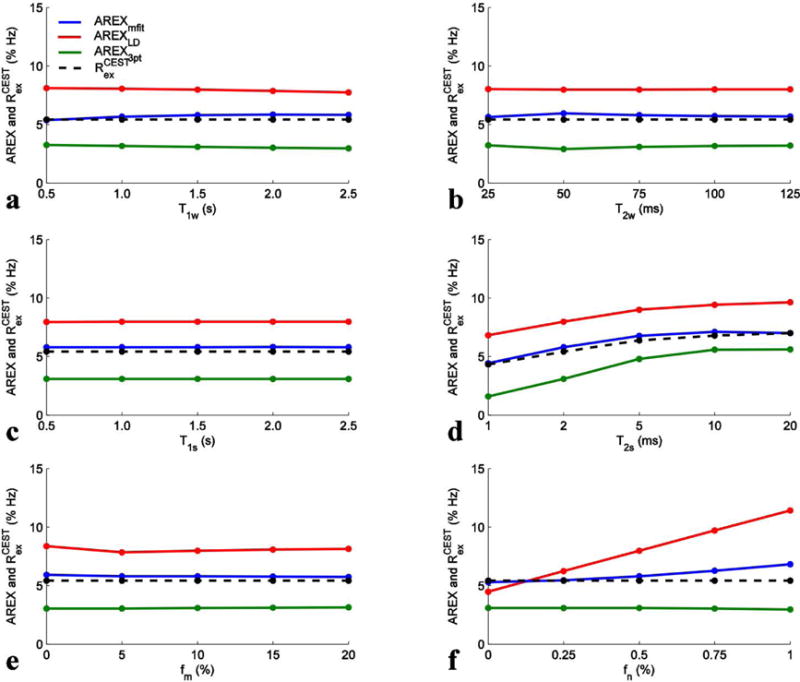
AREXmfit (blue), AREXLD (red), AREX3pt (green), and calculated Rcestex (dashed black) for APT from simulated Z-spectra with variation of T1w (a), T2w (b), T1s (c), T2s (d), fm (e), and fn (f) and with irradiation powers of 1 μT.
FIG. 7.
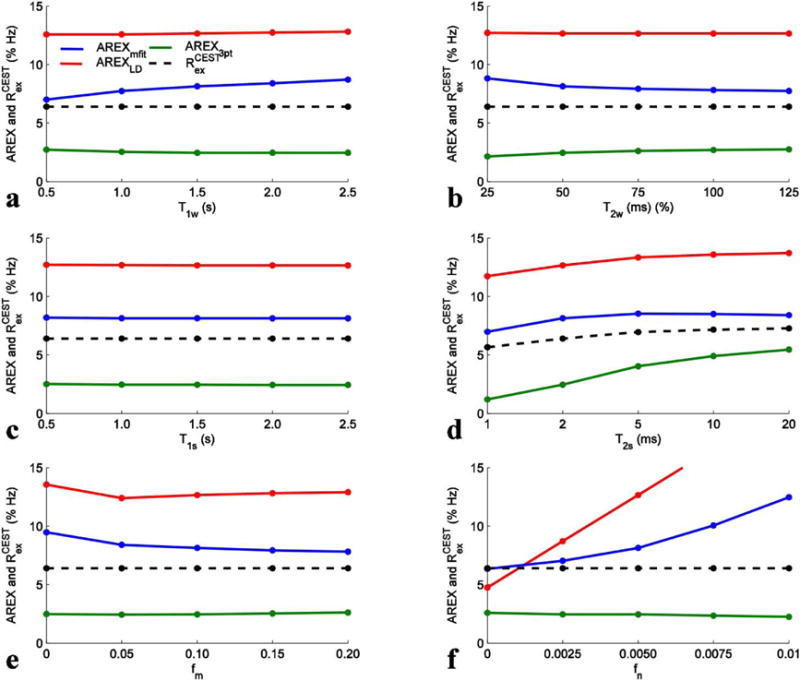
AREXmfit (blue), AREXLD (red), AREX3pt (green), and calculated Rcestex (dashed black) for APT from simulated Z-spectra with variation of T1w (a), T2w (b), T1s (c), T2s (d), fm (e), and fn (f) and with irradiation powers of 1.5 μT.
APT and NOE(−3.5) contrasts in tumors
The above analysis indicates that the multiple-pool Lorentzian fit can quantify APT and NOE(−3.5) at relatively lower irradiation power (e.g. 0.5 and 1 μT at 9.4 T) that better matches Rcestex in comparison to other quantification methods. Here we compared the AREXmfit acquired with irradiation power of 1 μT with the other two quantification methods on animal tumor models. Fig. 8 and Fig. 9 show the statistical differences of MTRmfit, MTRLD, MTR3pt, AREXmfit, AREXLD, and AREX3pt for APT and NOE(−3.5), respectively, between tumor and contralateral normal tissue from seven rat brains. Fig. 10 shows the multi-parametric images (R1obs, R2w, fm, AREXmfit for APT, AREXLD for APT, AREX3pt for APT, AREXmfit for NOE(−3.5), AREXLD for NOE(−3.5), and AREX3pt for NOE(−3.5)) on a representative rat brain bearing 9L tumor. Note in Fig. 8 and Fig. 9 that all these quantification methods with MTR or AREX have similar contrasts between tumor and contralateral tissues: there is statistical difference for all MTR metrics for APT, but no statistical difference for all AREX metrics for APT between tumor and contralateral normal tissue. In contrast, there is no statistical difference for all MTR metrics for NOE(−3.5), but significant statistical difference for all AREX metrics for NOE(−3.5) between tumor and contralateral normal tissue. This result is in agreement with a previous publication 33. However, although these three AREX metrics give similar contrasts between tumors and contralateral normal tissues (see Fig. 10), the quantified values (see Fig. 8 and Fig. 9) among these three methods are significantly different, suggesting the necessity to evaluate their accuracy. Based on our analysis from the simulated results, it is possible that LD and the three-point methods provide inaccurate quantification of CEST or rNOE saturation transfer effects in living tissues, but the multiple-pool Lorentzian fit at 1 μT is likely more accurate than the other two methods.
FIG. 8.
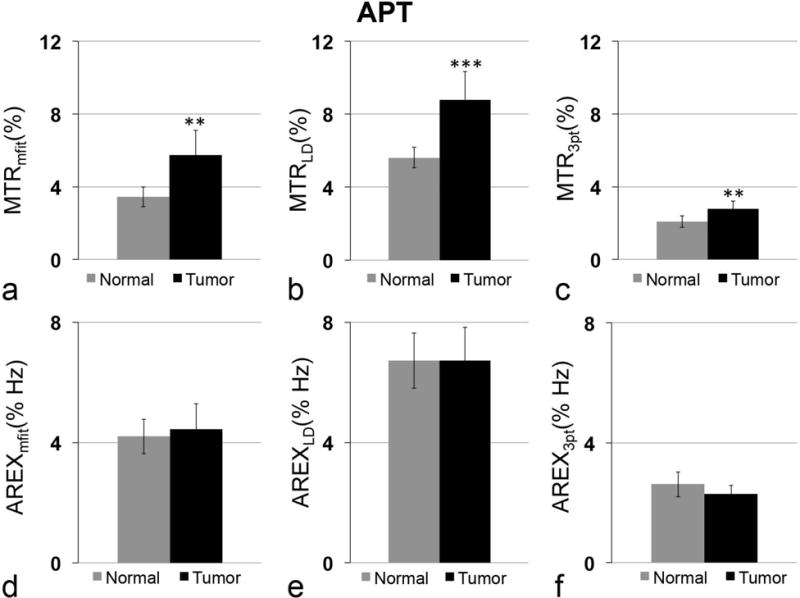
Statistical differences of MTRmfit (a), MTRLD (b), MTR3pt (c), AREXmfit (d), AREXLD (e) and AREX3pt (f) for APT between tumor and contralateral normal tissue in rat brain. Irradiation power is 1 μT. (n=7, **P <0.01, ***P <0.001)
FIG. 9.
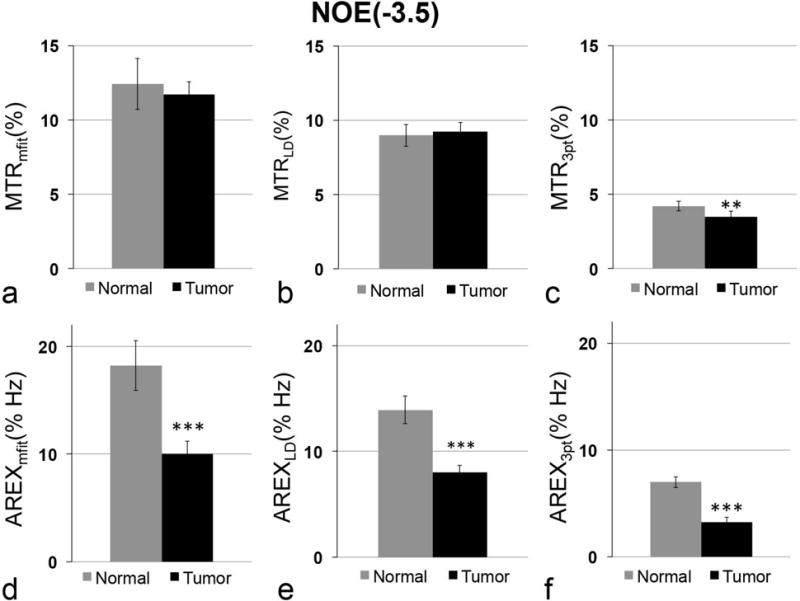
Statistical differences of MTRmfit (a), MTRLD (b), MTR3pt (c), AREXmfit (d), AREXLD (e) and AREX3pt (f) for NOE(−3.5) between tumor and contralateral normal tissue in rat brain. Irradiation power is 1 μT. (n=7, **P <0.01, ***P <0.001)
FIG. 10.
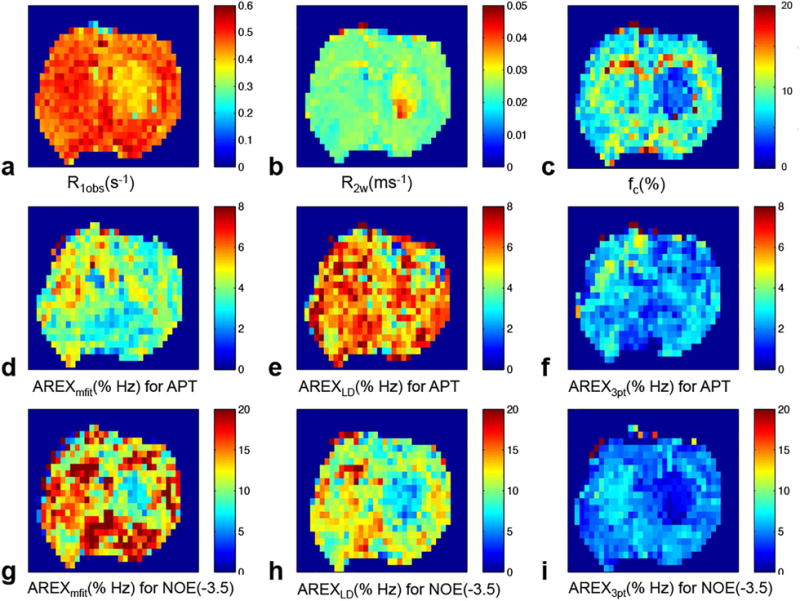
multi-parametric images of R1obs (a), R2W (b), fc (c), AREXmfit for APT (d), AREXLD for APT (e), AREX3pt for APT (f), AREXmfit for NOE(−3.5) (g), AREXLD for NOE(−3.5) (h), AREX3pt for NOE(−3.5) (i). Irradiation power is 1 μT.
DISCUSSION
Accurate quantification of CEST or rNOE saturation transfer signals is important, but is challenging especially in complex biological system where multiple CEST and rNOE saturation transfer pools are present. Here, we evaluated the accuracy of several CEST quantification methods.
Multiple CEST and rNOE saturation transfer pools in live rat brain
At 9.4 T, several CEST and rNOE saturation transfer dips, including the amide, intermediate exchanging amine, and NOE (−3.5), can be resolved in a Z-spectrum. The fast exchanging amine pool has been noticed at very high irradiation powers (>3 μT), but has typically been ignored at lower irradiation powers possibly because that there is no clear dip from this pool on a Z-spectrum at lower irradiation power. However, our animal experiments, phantom experiments, and simulations in Fig.1 and Fig. 2 show that the fast exchanging amine CEST effect is still significant compared with that from other pools at an irradiation power of 1 μT. The fast exchanging amine, which does not maintain the condition of slow exchange relative to offset (Δ >> ksw) 2, produces signal dips that coalesce with water and thus produces signal contributions that cannot be modeled by a Lorentzian lineshape 38. This signal contribution is broad and overlaps with amide and intermediate exchanging amine, and causes inaccuracy in quantification of these pools. The NOE(−1.6) is a new signal that has been overlooked. This signal is close to water resonance and thus may be buried by the DS effect. Thus, it is challenging to observe a clear NOE(−1.6) dip in a Z-spectrum (Fig. 1a). But it can be identified in the CEST residual spectra in which DS was partially removed (Fig. 1b).
Quantification of CEST and rNOE saturation transfer signals
Previously, the LD analysis has been applied to quantify amides 32. However, our study shows that this method has contamination from fast exchanging amines. This contamination is worse at higher irradiation powers where the fast exchanging amine CEST effect is more significant and at lower field where the amine and amide resonance frequencies are closer. Similarly, the NOE(−1.6) is also contaminated by the broad NOE(−3.5) peak which can be observed in Fig. 4b, 4d, and 4f. The overlapping signals indicate the necessity to perform a multiple-pool Lorentzian fit. The accuracy of the LD analysis also depends on the choice of sampling points for reference fitting. The underestimation of amide and NOE(−3.5) signals by using this method in Fig. 4b, 4d, and 4f suggest that signals from −10 to −6 ppm and 6 to 10 ppm still have contributions from NOE(−3.5) and/or fast exchanging amine pools. Farther fitting points from water resonance may avoid these contributions, but will be limited by the non-Lorentzian lineshape of the semi-solid MT 45–47.
The multiple-pool Lorentzian fit can correctly estimate amide, but only at lower irradiation powers. The limited working range of irradiation powers with this method should be considered when performing further quantification of solute concentration and exchange rate, in which multiple irradiation powers are always required. In our study, the multiple-pool Lorentzian fit of amide works well at irradiation powers of 0.5 and 1.0 μT at 9.4 T. At lower field scanners where the amine and amide resonances are closer to each other, the working range of irradiation powers are likely more limited. It was reported that creatine is in the intermediate exchanging range (several hundreds Hertz), and thus may contribute to the narrow amine peak. Previous works have quantified the creatine by using a variation of the multiple-pool Lorentzian fit 17. However, our studies indicate that this method (which contains only a single amine pool in the model) may overestimate the creatine content, due to contamination from the fast exchanging amine pool.
The three-point method has the benefit of being simple. However, it significantly underestimates APT and NOE(−3.5) signal contributions, and is not an accurate method. This method uses a reference signal obtained by averaging two nearby signals, which may fail to capture the full extent of the CEST and rNOE saturation transfer peaks.
Several other methods such as chemical exchange rotation transfer (CERT) 25,48, saturation with frequency alternating RF irradiation (SAFARI) 49, and variable delay multi-pulse train (VDMP) 50,51 et. al. have also been developed to quantify CEST or rNOE saturation transfer. However, although these methods can avoid some contaminations through repeated short-duration pulsed irradiation designed to filter out confounding effects, there is no analytic solution to the Bloch equations with pulsed-irradiations. Therefore, quantification of solute concentration and exchange rate by using these methods is very challenging. Evaluation of the accuracy of these methods is beyond the scope of this paper.
Note that our conclusions are based on multiple-pool numerical simulations, which may not mimic real tissues exactly. For example: 1) the tissue parameters in simulations may be different from those in real tissues and; 2) there may be additional CEST or rNOE saturation transfer pools in real tissues that are not included in our simulations. For the first case, our conclusions were drawn from simulations with a broad range of tissue parameters in Fig. 6 and Fig. 7 which should cover real tissue parameters. For the second case, those pools in our model appear to contribute the main CEST signals in the in vivo Z-spectra and CEST residual spectra in Figs. 1a and 1b. CEST signals from other pools may be present, but are relatively weak compared with the CEST effects from these pools in our model at such irradiation powers. In addition, the broad NOE(−3.5) peak may be composed of several small rNOE saturation transfer peaks 20, but Fig. 1b shows that it can effectively be treated as a single pool with a very short T2s in the experimental conditions examined in this work.
APT and NOE(−3.5) contrasts in tumors
The contradictory statistical results between the MTRmfit and AREXmfit metrics for APT and NOE(−3.5) indicate that the MTR metrics may have contributions from other tissue parameters in addition to chemical exchange or dipolar interactions from the target solutes. Previous publications indicated that variations of T1w and/or MT in tumor may also contribute to the MTR contrast 33,37,52. However, Lee et. al. 53 recently showed that both the increased water content and enhanced T1w in tumors influence the APT signal, and these two effects can be mostly cancelled out; therefore, there is no necessity to normalize by T1w in order to quantify the amide content, but not the fraction of amide pool with the water pool. More recently, a new aromatic rNOE saturation transfer at 3.5 ppm, which overlaps with APT, was reported to account for the disappearance of the AREX contrast between tumor and contralateral normal tissues at 3.5 ppm 54. While we did not include this contribution in the current work, the quantification of this new rNOE saturation transfer signal using the three methods examined in this paper will likely be subject to biases similar to those we have found. Further validation of the abilities of MTR or AREX to detect change of amides (either amide content or the fraction of amide pool with the water pool) in tumors requires accurate quantification of the underlying exchanging pools. The comparison between fitted results from multiple-model simulations with the theoretically calculated results used in this work can be also applied to evaluate the accuracy of other newly developed quantification methods.
CONCLUSION
The accuracy of CEST and rNOE saturation transfer quantification methods is important, but has not been evaluated. Our results demonstrate that the LD analysis overestimates APT and intermediate exchanging amine. The three-point method underestimates APT and NOE(−3.5) signals. In contrast, the multiple-pool Lorentzian fit is more accurate than the other two methods within the range of our simulations, but only at relatively lower irradiation powers.
Supplementary Material
Acknowledgments
This work was funded by National Institutes of Health (NIH) R21 EB17873, R01CA109106, R01CA184693, R01EB017767.
Grant Sponsor: R21 EB17873, R01CA109106, R01CA184693, R01EB017767
Abbreviations
- CEST
chemical exchange saturation transfer
- NOE
nuclear Overhauser enhancement
- rNOE
relayed nuclear Overhauser enhancement
- APT
amide proton transfer
- DS
direct water saturation
- LD
Lorentzian difference
- MTR
magnetization transfer ratio
- MTRLD
MTR obtained by the Lorentzian difference analysis
- MTRmfit
MTR obtained by the multiple-pool Lorentzian fit
- MTR3pt
MTR obtained by the three-point method
- R1obs
apparent water longitudinal relaxation rate
- AREX
apparent exchange-dependent relaxation
- ksw
solute-water exchange rate
- AREXLD
AREX obtained by the Lorentzian difference analysis
- AREXmfit
AREX obtained by the multiple-pool Lorentzian fit
- AREX3pt
AREX obtained by the three-point method
- CW
continuous wave
References
- 1.van Zijl PCM, Yadav NN. Chemical exchange saturation transfer (CEST): what is in a name and what isn’t? Magn Reson Med. 2011;65(4):927–48. doi: 10.1002/mrm.22761. [DOI] [PMC free article] [PubMed] [Google Scholar]
- 2.Zhou J, van Zijl PCM. Chemical exchange saturation transfer imaging and spectroscopy. Prog Nucl Magn Reson Spectrosc. 2006;48(2–3):109–36. doi: 10.1016/j.pnmrs.2006.01.001. [DOI] [Google Scholar]
- 3.Zhou J, Tryggestad E, Wen Z, et al. Differentiation between glioma and radiation necrosis using molecular magnetic resonance imaging of endogenous proteins and peptides. Nat Med. 2011;17(1):130–4. doi: 10.1038/nm.2268. [DOI] [PMC free article] [PubMed] [Google Scholar]
- 4.Zhou J, Payen J-F, Wilson DA, Traystman RJ, van Zijl PCM. Using the amide proton signals of intracellular proteins and peptides to detect pH effects in MRI. Nat Med. 2003;9(8):1085–90. doi: 10.1038/nm907. [DOI] [PubMed] [Google Scholar]
- 5.Jin T, Wang P, Zong X, Kim S-G. MR imaging of the amide-proton transfer effect and the pH-insensitive nuclear overhauser effect at 9.4 T. Magn Reson Med. 2013;69(3):760–70. doi: 10.1002/mrm.24315. [DOI] [PMC free article] [PubMed] [Google Scholar]
- 6.Sun PZ, Cheung JS, Wang E, Lo EH. Association between pH-weighted endogenous amide proton chemical exchange saturation transfer MRI and tissue lactic acidosis during acute ischemic stroke. J Cereb Blood Flow Metab. 2011;31(8):1743–50. doi: 10.1038/jcbfm.2011.23. [DOI] [PMC free article] [PubMed] [Google Scholar]
- 7.Salhotra A, Lal B, Laterra J, Sun PZ, van Zijl PCM, Zhou J. Amide proton transfer imaging of 9L gliosarcoma and human glioblastoma xenografts. NMR Biomed. 2008;21(5):489–97. doi: 10.1002/nbm.1216. [DOI] [PMC free article] [PubMed] [Google Scholar]
- 8.Jones CK, Schlosser MJ, van Zijl PCM, Pomper MG, Golay X, Zhou J. Amide proton transfer imaging of human brain tumors at 3T. Magn Reson Med. 2006;56(3):585–592. doi: 10.1002/mrm.20989. [DOI] [PubMed] [Google Scholar]
- 9.Jia G, Abaza R, Williams JD, et al. Amide proton transfer MR imaging of prostate cancer: a preliminary study. J Magn Reson Imaging. 2011;33(3):647–54. doi: 10.1002/jmri.22480. [DOI] [PMC free article] [PubMed] [Google Scholar]
- 10.Zhou J, Lal B, Wilson DA, Laterra J, van Zijl PCM. Amide proton transfer (APT) contrast for imaging of brain tumors. Magn Reson Med. 2003;50(6):1120–1126. doi: 10.1002/mrm.10651. [DOI] [PubMed] [Google Scholar]
- 11.Sun PZ, Wang E, Cheung JS. Imaging acute ischemic tissue acidosis with pH-sensitive endogenous amide proton transfer (APT) MRI–correction of tissue relaxation and concomitant RF irradiation effects toward mapping quantitative cerebral tissue pH. Neuroimage. 2012;60(1):1–6. doi: 10.1016/j.neuroimage.2011.11.091. [DOI] [PMC free article] [PubMed] [Google Scholar]
- 12.Sun PZ, Zhou J, Sun W, Huang J, van Zijl PCM. Detection of the ischemic penumbra using pH-weighted MRI. J Cereb Blood Flow Metab. 2007;27(6):1129–1136. doi: 10.1038/sj.jcbfm.9600424. [DOI] [PubMed] [Google Scholar]
- 13.Sun PZ, Benner T, Copen WA, Sorensen AG. Early experience of translating pH-weighted MRI to image human subjects at 3 Tesla. Stroke. 2010;41(10 Suppl):S147–51. doi: 10.1161/STROKEAHA.110.595777. [DOI] [PMC free article] [PubMed] [Google Scholar]
- 14.Li H, Zu Z, Zaiss M, et al. Imaging of amide proton transfer and nuclear Overhauser enhancement in ischemic stroke with corrections for competing effects. NMR Biomed. 2015;28(2):200–9. doi: 10.1002/nbm.3243. [DOI] [PMC free article] [PubMed] [Google Scholar]
- 15.Haris M, Singh A, Cai K, et al. A technique for in vivo mapping of myocardial creatine kinase metabolism. Nat Med. 2014;20(2):209–14. doi: 10.1038/nm.3436. [DOI] [PMC free article] [PubMed] [Google Scholar]
- 16.Haris M, Nanga RPR, Singh A, et al. Exchange rates of creatine kinase metabolites: feasibility of imaging creatine by chemical exchange saturation transfer MRI. NMR Biomed. 2012;25(11):1305–9. doi: 10.1002/nbm.2792. [DOI] [PMC free article] [PubMed] [Google Scholar]
- 17.Cai K, Singh A, Poptani H, et al. CEST signal at 2ppm (CEST@2ppm) from Z-spectral fitting correlates with creatine distribution in brain tumor. NMR Biomed. 2015;28(1):1–8. doi: 10.1002/nbm.3216. [DOI] [PMC free article] [PubMed] [Google Scholar]
- 18.Cai K, Haris M, Singh A, et al. Magnetic resonance imaging of glutamate. Nat Med. 2012;18(2):302–306. doi: 10.1038/nm.2615. [DOI] [PMC free article] [PubMed] [Google Scholar]
- 19.van Zijl PCM, Zhou J, Mori N, Payen J-F, Wilson D, Mori S. Mechanism of magnetization transfer during on-resonance water saturation. A new approach to detect mobile proteins, peptides, and lipids. Magn Reson Med. 2003;49(3):440–9. doi: 10.1002/mrm.10398. [DOI] [PubMed] [Google Scholar]
- 20.Jones CK, Huang A, Xu J, et al. Nuclear Overhauser enhancement (NOE) imaging in the human brain at 7T. Neuroimage. 2013;77:114–24. doi: 10.1016/j.neuroimage.2013.03.047. [DOI] [PMC free article] [PubMed] [Google Scholar]
- 21.Paech D, Zaiss M, Meissner J-E, et al. Nuclear overhauser enhancement mediated chemical exchange saturation transfer imaging at 7 Tesla in glioblastoma patients. PLoS One. 2014;9(8):e104181. doi: 10.1371/journal.pone.0104181. [DOI] [PMC free article] [PubMed] [Google Scholar]
- 22.Zaiss M, Windschuh J, Paech D, et al. Relaxation-compensated CEST-MRI of the human brain at 7T: Unbiased insight into NOE and amide signal changes in human glioblastoma. Neuroimage. 2015;112:180–8. doi: 10.1016/j.neuroimage.2015.02.040. [DOI] [PubMed] [Google Scholar]
- 23.Zhang X-Y, Wang F, Jin T, et al. MR imaging of a novel NOE-mediated magnetization transfer with water in rat brain at 9.4 T. Magn Reson Med. 2016 doi: 10.1002/mrm.26396. [DOI] [PMC free article] [PubMed] [Google Scholar]
- 24.Zhang X-Y, Wang F, Afzal A, et al. A new NOE-mediated MT signal at around −1.6ppm for detecting ischemic stroke in rat brain. Magn Reson Imaging. 2016;34(8):1100–6. doi: 10.1016/j.mri.2016.05.002. [DOI] [PMC free article] [PubMed] [Google Scholar]
- 25.Zu Z, Janve VA, Xu J, Does MD, Gore JC, Gochberg DF. A new method for detecting exchanging amide protons using chemical exchange rotation transfer. Magn Reson Med. 2013;69(3):637–47. doi: 10.1002/mrm.24284. [DOI] [PMC free article] [PubMed] [Google Scholar]
- 26.Windschuh J, Zaiss M, Meissner J-E, et al. Correction of B1-inhomogeneities for relaxation-compensated CEST imaging at 7 T. NMR Biomed. 2015;28(5):529–37. doi: 10.1002/nbm.3283. [DOI] [PubMed] [Google Scholar]
- 27.Heo H-Y, Zhang Y, Lee D-H, Hong X, Zhou J. Quantitative assessment of amide proton transfer (APT) and nuclear overhauser enhancement (NOE) imaging with extrapolated semi-solid magnetization transfer reference (EMR) signals: Application to a rat glioma model at 4.7 tesla. Magn Reson Med. 2016;75(1):137–149. doi: 10.1002/mrm.25581. [DOI] [PMC free article] [PubMed] [Google Scholar]
- 28.Dula AN, Dewey BE, Arlinghaus LR, et al. Optimization of 7-T chemical exchange saturation transfer parameters for validation of glycosaminoglycan and amide proton transfer of fibroglandular breast tissue. Radiology. 2015;275(1):255–61. doi: 10.1148/radiol.14140762. [DOI] [PMC free article] [PubMed] [Google Scholar]
- 29.Tietze A, Blicher J, Mikkelsen IK, et al. Assessment of ischemic penumbra in patients with hyperacute stroke using amide proton transfer (APT) chemical exchange saturation transfer (CEST) MRI. NMR Biomed. 2014;27(2):163–74. doi: 10.1002/nbm.3048. [DOI] [PMC free article] [PubMed] [Google Scholar]
- 30.Desmond KL, Moosvi F, Stanisz GJ. Mapping of amide, amine, and aliphatic peaks in the CEST spectra of murine xenografts at 7 T. Magn Reson Med. 2014;71(5):1841–53. doi: 10.1002/mrm.24822. [DOI] [PubMed] [Google Scholar]
- 31.Zaiss M, Schmitt B, Bachert P. Quantitative separation of CEST effect from magnetization transfer and spillover effects by Lorentzian-line-fit analysis of z-spectra. J Magn Reson. 2011;211(2):149–55. doi: 10.1016/j.jmr.2011.05.001. [DOI] [PubMed] [Google Scholar]
- 32.Jones CK, Polders D, Hua J, et al. In vivo three-dimensional whole-brain pulsed steady-state chemical exchange saturation transfer at 7 T. Magn Reson Med. 2012;67(6):1579–89. doi: 10.1002/mrm.23141. [DOI] [PMC free article] [PubMed] [Google Scholar]
- 33.Xu J, Zaiss M, Zu Z, et al. On the origins of chemical exchange saturation transfer (CEST) contrast in tumors at 9.4 T. NMR Biomed. 2014;27(4):406–16. doi: 10.1002/nbm.3075. [DOI] [PMC free article] [PubMed] [Google Scholar]
- 34.Zhang X-Y, Robledo BN, Harris SS, Hu XP. A bacterial gene, mms6, as a new reporter gene for magnetic resonance imaging of mammalian cells. Mol Imaging. 2014;13:1–12. doi: 10.2310/7290.2014.00046. [DOI] [PubMed] [Google Scholar]
- 35.Zaiss M, Bachert P. Exchange-dependent relaxation in the rotating frame for slow and intermediate exchange – modeling off-resonant spin-lock and chemical exchange saturation transfer. NMR Biomed. 2013;26(5):507–18. doi: 10.1002/nbm.2887. [DOI] [PubMed] [Google Scholar]
- 36.Zaiss M, Zu Z, Xu J, et al. A combined analytical solution for chemical exchange saturation transfer and semi-solid magnetization transfer. NMR Biomed. 2015;28(2):217–30. doi: 10.1002/nbm.3237. [DOI] [PMC free article] [PubMed] [Google Scholar]
- 37.Li H, Li K, Zhang X-Y, et al. R1 correction in amide proton transfer imaging: indication of the influence of transcytolemmal water exchange on CEST measurements. NMR Biomed. 2015;28(12):1655–62. doi: 10.1002/nbm.3428. [DOI] [PMC free article] [PubMed] [Google Scholar]
- 38.Zaiss M, Bachert P. Chemical exchange saturation transfer (CEST) and MR Z-spectroscopy in vivo: a review of theoretical approaches and methods. Phys Med Biol. 2013;58(22):R221–69. doi: 10.1088/0031-9155/58/22/R221. [DOI] [PubMed] [Google Scholar]
- 39.Zong X, Wang P, Kim S-G, Jin T. Sensitivity and source of amine-proton exchange and amide-proton transfer magnetic resonance imaging in cerebral ischemia. Magn Reson Med. 2014;71(1):118–32. doi: 10.1002/mrm.24639. [DOI] [PMC free article] [PubMed] [Google Scholar]
- 40.Zaiss M, Xu J, Goerke S, et al. Inverse Z-spectrum analysis for spillover-, MT-, and T1 -corrected steady-state pulsed CEST-MRI–application to pH-weighted MRI of acute stroke. NMR Biomed. 2014;27(3):240–52. doi: 10.1002/nbm.3054. [DOI] [PMC free article] [PubMed] [Google Scholar]
- 41.Hua J, Jones CK, Blakeley J, Smith SA, van Zijl PCM, Zhou J. Quantitative description of the asymmetry in magnetization transfer effects around the water resonance in the human brain. Magn Reson Med. 2007;58(4):786–93. doi: 10.1002/mrm.21387. [DOI] [PMC free article] [PubMed] [Google Scholar]
- 42.Liu D, Zhou J, Xue R, Zuo Z, An J, Wang DJJ. Quantitative characterization of nuclear overhauser enhancement and amide proton transfer effects in the human brain at 7 tesla. Magn Reson Med. 2013;70(4):1070–81. doi: 10.1002/mrm.24560. [DOI] [PMC free article] [PubMed] [Google Scholar]
- 43.Gochberg DF, Gore JC. Quantitative magnetization transfer imaging via selective inversion recovery with short repetition times. Magn Reson Med. 2007;57(2):437–41. doi: 10.1002/mrm.21143. [DOI] [PMC free article] [PubMed] [Google Scholar]
- 44.Xu J, Li K, Zu Z, Li X, Gochberg DF, Gore JC. Quantitative magnetization transfer imaging of rodent glioma using selective inversion recovery. NMR Biomed. 2014;27(3):253–60. doi: 10.1002/nbm.3058. [DOI] [PMC free article] [PubMed] [Google Scholar]
- 45.Tozer D, Ramani A, Barker GJ, Davies GR, Miller DH, Tofts PS. Quantitative magnetization transfer mapping of bound protons in multiple sclerosis. Magn Reson Med. 2003;50(1):83–91. doi: 10.1002/mrm.10514. [DOI] [PubMed] [Google Scholar]
- 46.Morrison C, Stanisz G, Henkelman RM. Modeling magnetization transfer for biological-like systems using a semi-solid pool with a super-Lorentzian lineshape and dipolar reservoir. J Magn Reson B. 1995;108(2):103–13. doi: 10.1006/jmrb.1995.1111. Available at: http://www.ncbi.nlm.nih.gov/pubmed/7648009. Accessed January 5, 2017. [DOI] [PubMed] [Google Scholar]
- 47.Morrison C, Henkelman RM. A model for magnetization transfer in tissues. Magn Reson Med. 1995;33(4):475–82. doi: 10.1002/mrm.1910330404. Available at: http://www.ncbi.nlm.nih.gov/pubmed/7776877. Accessed January 5, 2017. [DOI] [PubMed] [Google Scholar]
- 48.Zu Z, Xu J, Li H, et al. Imaging amide proton transfer and nuclear overhauser enhancement using chemical exchange rotation transfer (CERT) Magn Reson Med. 2014;72(2):471–6. doi: 10.1002/mrm.24953. [DOI] [PMC free article] [PubMed] [Google Scholar]
- 49.Scheidegger R, Vinogradov E, Alsop DC. Amide proton transfer imaging with improved robustness to magnetic field inhomogeneity and magnetization transfer asymmetry using saturation with frequency alternating RF irradiation. Magn Reson Med. 2011;66(5):1275–85. doi: 10.1002/mrm.22912. [DOI] [PMC free article] [PubMed] [Google Scholar]
- 50.Xu J, Yadav NN, Bar-Shir A, et al. Variable delay multi-pulse train for fast chemical exchange saturation transfer and relayed-nuclear overhauser enhancement MRI. Magn Reson Med. 2014;71(5):1798–812. doi: 10.1002/mrm.24850. [DOI] [PMC free article] [PubMed] [Google Scholar]
- 51.Xu X, Yadav NN, Zeng H, et al. Magnetization transfer contrast-suppressed imaging of amide proton transfer and relayed nuclear overhauser enhancement chemical exchange saturation transfer effects in the human brain at 7T. Magn Reson Med. 2016;75(1):88–96. doi: 10.1002/mrm.25990. [DOI] [PMC free article] [PubMed] [Google Scholar]
- 52.Scheidegger R, Wong ET, Alsop DC. Contributors to contrast between glioma and brain tissue in chemical exchange saturation transfer sensitive imaging at 3 Tesla. Neuroimage. 2014;99(1):256–68. doi: 10.1016/j.neuroimage.2014.05.036. Available at. [DOI] [PMC free article] [PubMed] [Google Scholar]
- 53.Lee D-H, Heo H-Y, Zhang K, et al. Quantitative assessment of the effects of water proton concentration and water T1 changes on amide proton transfer (APT) and nuclear overhauser enhancement (NOE) MRI: The origin of the APT imaging signal in brain tumor. Magn Reson Med. 2016:n/a–n/a. doi: 10.1002/mrm.26131. [DOI] [PMC free article] [PubMed] [Google Scholar]
- 54.Zaiss M, Windschuh J, Goerke S, et al. Downfield-NOE-suppressed amide-CEST-MRI at 7 Tesla provides a unique contrast in human glioblastoma. Magn Reson Med. 2017;77(1):196–208. doi: 10.1002/mrm.26100. [DOI] [PubMed] [Google Scholar]
- 55.Wermter FC, Bock C, Dreher W. Investigating GluCEST and its specificity for pH mapping at low temperatures. NMR Biomed. 2015;28(11):1507–17. doi: 10.1002/nbm.3416. [DOI] [PubMed] [Google Scholar]
- 56.Goerke S, Zaiss M, Bachert P. Characterization of creatine guanidinium proton exchange by water-exchange (WEX) spectroscopy for absolute-pH CEST imaging in vitro. NMR Biomed. 2014;27(5):507–18. doi: 10.1002/nbm.3086. [DOI] [PubMed] [Google Scholar]
Associated Data
This section collects any data citations, data availability statements, or supplementary materials included in this article.


