Abstract
Timely and reliable sensing and actuation control are essential in networked control. This depends on not only the precision/quality of the sensors and actuators used but also on how well the communications links between the field instruments and the controller have been designed. Wireless networking offers simple deployment, reconfigurability, scalability, and reduced operational expenditure, and is easier to upgrade than wired solutions. However, the adoption of wireless networking has been slow in industrial process control due to the stochastic and less than 100 % reliable nature of wireless communications and lack of a model to evaluate the effects of such communications imperfections on the overall control performance. In this paper, we study how control performance is affected by wireless link quality, which in turn is adversely affected by severe propagation loss in harsh industrial environments, co-channel interference, and unintended interference from other devices. We select the Tennessee Eastman Challenge Model (TE) for our study. A decentralized process control system, first proposed by N. Ricker, is adopted that employs 41 sensors and 12 actuators to manage the production process in the TE plant. We consider the scenario where wireless links are used to periodically transmit essential sensor measurement data, such as pressure, temperature and chemical composition to the controller as well as control commands to manipulate the actuators according to predetermined setpoints. We consider two models for packet loss in the wireless links, namely, an independent and identically distributed (IID) packet loss model and the two-state Gilbert-Elliot (GE) channel model. While the former is a random loss model, the latter can model bursty losses. With each channel model, the performance of the simulated decentralized controller using wireless links is compared with the one using wired links providing instant and 100 % reliable communications. The sensitivity of the controller to the burstiness of packet loss is also characterized in different process stages. The performance results indicate that wireless links with redundant bandwidth reservation can meet the requirements of the TE process model under normal operational conditions. When disturbances are introduced in the TE plant model, wireless packet loss during transitions between process stages need further protection in severely impaired links. Techniques such as retransmission scheduling, multipath routing and enhanced physical layer design are discussed and the latest industrial wireless protocols are compared.
Keywords: industrial control systems, chemical process control, process resilience, process performance, measurement science, testbed, safety
I. Introduction
Industrial process control is a control problem where various sensing and automation technologies are used to supervise the production activities in a plant. In the past few decades, the use of process control has been growing rapidly in conjunction with various plant management systems, such as inventory management, product quality check, plant safety monitoring and environmental control, for optimizing the entire plant operation [1]. In industrial process control, control strategies are generally built around organizing sensing and actuation to serve comprehensive and complicated control tasks. The control data in process control mainly consists of process variables (PVs) and manipulated variables (MVs), the former being the data acquired from field sensors and the latter the commands that need to be applied to actuation devices. In order to achieve the control objectives, the control data needs to be reliably communicated over secure communications links.
Wired communications has been traditionally adopted for use in control systems, because it provides direct, reliable connections between field instruments and control units by wires/cables, multiplexers and fieldbus protocols. However, wired communications has its own limitations. For example, wired connections do not scale well or support network reconfiguration as the process control evolves, larger networks need to be supported, or more data is generated. As an alternative solution, field instruments equipped with wireless adaptors can communicate with each other and the process controller over the air [2]. Wireless networking offers simple deployment, reconfigurability, scalability, and reduced operational expenditure, and is easier to upgrade than wired solutions. Moreover, it supports flexible communication bandwidth allocation to meet the needs of the control system. Therefore, wireless communications is becoming popular in plants for either reducing the deployment cost to reach the remote nodes in a sparse network or increasing the access capability in a limited space in comparison with cable connectors [3]. Accordingly, a number of wireless industrial communication protocols have been standardized, such as ISA100.11a [4] and WirelessHART [5].
Despite these advantages over their wired peers, the adoption rate of wireless networking has been slow. One popular concern is that the stochastic nature and the less than 100 % reliability of wireless links would impair the control performance [6]. A typical industrial plant is normally built with steel beams and concrete walls and it houses numerous bulky metallic machines, rails and piles of products that make it hard to establish a line-of-sight link between two nodes that need to communicate. The radio signal experiences significant attenuation as it propagates in such a harsh environment. Besides the intrinsic propagation loss, strong co-channel interference is another issue as wireless field instruments, such as Wi-Fi and ZigBee devices, operate in unlicensed spectrum bands, e.g., the 2.4 GHz industrial, scientific and medical (ISM) radio band, and compete for the same scarce spectrum. A number of field studies have been done to verify these concerns. Remley et al. carried out radio frequency (RF) channel measurements in industrial plants and reported that the unique propagation features and radio spectrum activities are strongly shaped by the plant architecture and production schedule [7]. Tanghe et al. proposed a channel model for large-scale and temporal fading in industrial indoor environments based on their RF measurement work [8]. Saifullah et al. analyzed end-to-end delay performance of wireless transmissions in industrial environments [9]. Lo Bello et al. addressed the coexistence of multiple IEEE 802.15.4/Zigbee networks working in adjacent radio channels in industrial plants [10]. The majority of the existing work is still focused on evaluating the wireless channel effects using conventional network performance metrics, such as bit error rate and network throughput. For the plant owners, the real concern is how well the controller behaves when wireless communications are introduced to replace wired connections as well as the installation and operation cost of wireless networks. Therefore, an evaluation of wireless channel effects on the controller performance is sorely needed in order to promote the use of wireless technologies in industrial process control. Currently, this is still an open problem.
In this paper, we study how the control performance is affected by transmissions through wireless links, which are adversely affected by severe propagation loss in harsh industrial environments, co-channel interference, and unintended interference from other devices. These phenomena may result in significant and possibly bursty packet loss, which prevents the controller from tracking the critical performance metrics of the process under control and responding appropriately. We select a chemical process plant as the control process model and identify its communications requirements of connecting various field instruments with the controller through wireless links. We propose two wireless channel models to characterize packet loss patterns in the sensing and actuation links. The process model and the channel model are co-simulated to evaluate the impact of different types of wireless packet loss models on the control performance in various plant operations, such as setpoint change and disturbed operations. Based upon the results, we discuss the adoption of different wireless technologies in process control.
The remainder of the paper is organized as follows. In Section II, the studied process control model is introduced. Two types of wireless channel models are proposed in Section III. The effects of wireless transmissions on control performance are evaluated in Section IV in three different operational scenarios. Finally, we conclude the paper in Section V and discuss possible solutions to improve wireless links in support of control performance.
II. Industrial Process Control Model
We select the Tennessee Eastman Challenge Model (TE) as the model for industrial process control in this paper. The TE process model was first proposed as a simulated chemical plant by Downs and Vogel in 1993 [11]. We chose the TE model for a number of reasons. First, it is a well-known, real-world simulated chemical process model that has many characteristics of a typical dynamic process control study, such as centralized control, networked sensors and actuators, multi-variable optimization, and performance metrics (mainly from the cost perspective) for scenarios with changeable setpoints. The field instruments, being distributed over the plant, need to communicate with the controller over wired or wireless links. Second, the TE model is open-loop unstable, which makes it necessary to periodically update the process variables through the communications links. The adverse effects of the wireless links, in terms of loss or delayed delivery of control data, can significantly degrade the control performance, workplace safety, and economic sustainability. Third, the simulations of the TE process have been well developed so that we can focus on the communications modeling aspect by reusing an existing plant simulation model.
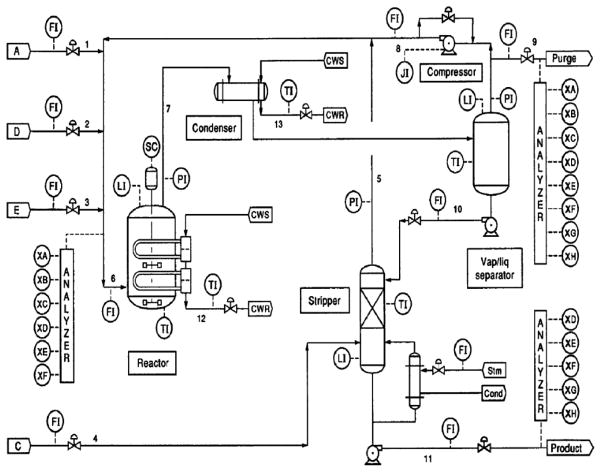
The TE plant, shown in Fig. 1, is designed for producing two liquid products, G and H, from four gaseous reactant inputs, denoted by A, C, D and E. At the same time, two gaseous byproducts, B and F, are also generated within the process. Note that B, F, G, and H are not explicitly shown in the figure. And instead of revealing the actual chemical process in the plant, generic identifiers are used to represent the substances. The total process is irreversible and divided into five operation stages including a reactor, a product condenser, a vapor-liquid separator, a product stripper, and a recycle compressor. The details of the TE process are described in [11].
Figure 1.
Tennessee Eastman process control problem [9]
For plant process control, the TE model provides a number of measurable process variables (XMEAS) and manipulated variables (XMV) for the controller to probe the health of the process and adjust the production according to the programmed setpoints. The forty-one XMEAS variables are of various types including feed flow rate, container status metric (e.g., temperature, pressure and liquid level indicators), and chemical composition metrics at different process steps. The twelve XMV variables, on the other hand, deal with valve control, temperature control and feed/purge control. The process has a total of six operation modes which control the G/H mass ratio (i.e., XMEAS 40 and XMEAS 41 of stream 11) and the production rate from the stripper underflow (i.e., XMEAS 17 through stream 11). In our study, the primary use case is Mode 1, which is also called the base case.
We choose the decentralized TE controller model proposed by N. Ricker [12] with the heat and material balance data for Mode 1 case in [11] due to its multi-loop distributed control architecture and its wide acceptance as the foundation for viable advanced controller design. In the rest of this paper, whenever we mention the TE process model or the TE model, we mean the TE simulated plant model combined with Ricker’s controller model.
III. Communications Channel Model
In the TE process model, there are two types of communications links depending on the transmission direction. In the upstream links, XMEAS variables, e.g., temperature, pressure and flow rate, acquired from field sensors are transmitted to the controller as shown in Fig. 2. The downstream links, on the other hand, carry the control commands in terms of updates of XMV variables to the field actuation devices. Individual XMEAS and XMV variables will be updated once every T second. In this paper, T is set to 1.8 seconds, consistent with Ricker’s Simulink settings [13]. It is assumed that each update will be packed into a separate data packet containing a double variable plus the sampled timestamp. If a data packet gets lost in the communications channel, the receiver will treat that process variable unchanged in the current update and keep using the previous value. Therefore, when wireless communications is used, the packet loss in the wireless channel will have an impact on the process control performance.
Figure 2.
Integrated TE model with communications channel model
The updates through wireless links in both directions are modeled by the following equations,
| (1) |
| (2) |
where the subscript C or P for each process variable denotes whether the variable is associated with the controller or the field instrument in the plant, respectively. E(n) is the indicator random variable for the event that a packet loss occurs at the n-th update through the wireless channel. E(n) is equal to 0 when the packet reaches the destination without error; it is equal to 1 otherwise.
In this paper, we introduce two statistical models to characterize the randomness of the packet loss caused by the wireless channel, namely, an independent and identically distributed (IID) packet loss model and the two-state Gilbert-Elliot (GE) channel model.
A. IID Channel Model
In the IID model, each wireless transmission of a process variable is statistically independent of all others and the probability of a packet not going through is the same at all times. Specifically, the random variables E(n), n = 1, 2, 3, …, are statistically independent and they all have the following probability distribution:
| (3) |
A larger Pe,iid indicates a worse wireless channel so that packets are more likely to get impaired and dropped, which forces the controller to take more time to acquire the process status and respond to any disturbances.
B. Gilbert-Elliott (GE) Channel Model
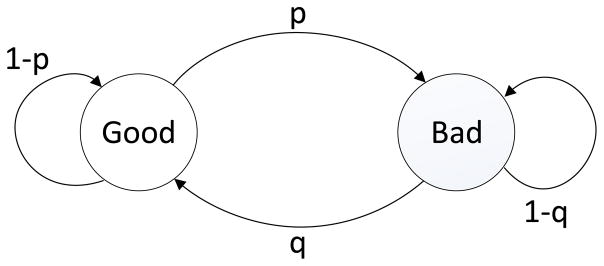
The GE model is appropriate for modelling bursty losses in wireless links [14–16]. As shown in Fig. 3, the GE model has two states, “good” and “bad”, with Pe,G and Pe,B denoting the packet error rate (PER) associated with the good and the bad states, respectively. For any two consecutive observation steps, the channel can stay in the same state or jump from one state to the other according to the transition probabilities, p and q, which characterize the burstiness of the good and bad channel conditions. Since the GE model is mathematically a two-state Markov chain, its stationary distribution of channel states, (πG, πB), can be calculated by the following equations,
Figure 3.
The two-state GE channel model
| (4) |
| (5) |
whose solution is .
The average PER of the GE model is obtained by
| (6) |
Note that the IID model can be viewed as a special case of the GE model under the conditions: 1) p = Pe,iid and q =1 − Pe,iid; 2) Pe,G =0 and Pe,B = 1.
For the rest of this paper we assume that Pe,G =0 and Pe,B =1 in the GE model. In other words, the good channel, or the “all-pass” channel, allows the packet to pass through the wireless link without any errors so that E(n) =0. On the contrary, the bad channel totally blocks the packet transmission and results in the packet being dropped, i.e., E(n) =1. Therefore, the temporal dynamics of whether packets go through or get dropped in the GE model are governed by the following equations:
| (7) |
The average PER of (6) can be simplified as
| (8) |
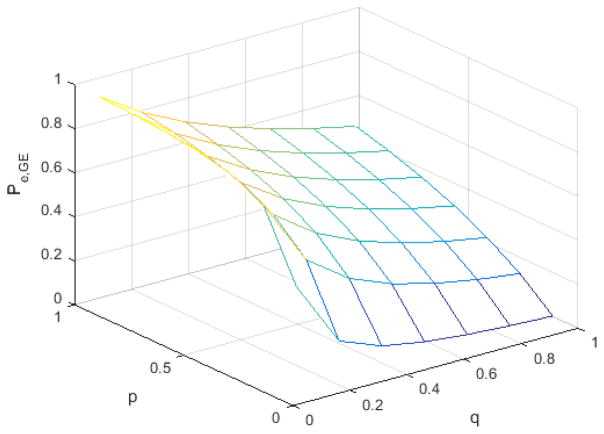
The cause of packet loss in wireless channel ranges from strong co-channel interference to overloaded network device in which packets are delayed so much by the device that they are discarded. As shown in Fig. 4, the GE model depicts the impacts of the wireless channel on the transmission with more details than the IID model does. A single Pe,GE value may be associated with multiple (p, q) pairs as illustrated in (8). The average run-length for the good and bad states, i.e. the average number of successive number of times the channel stays in the good and bad states turns out to be 1/p and 1/q, respectively. Table 1 illustrates some examples of channel statistics in the GE model.
Figure 4.
Average PER under different p and q values in GE model (Pe,G = 0, Pe,B = 1)
Table 1.
Examples of statistics in GE model (T = 1.8 sec)
| p | q | Average PER (Pe,GE) | Average sojourn time in the good channel (T/p, unit: sec) | Average sojourn time in the bad channel (T/q, unit: sec) |
|---|---|---|---|---|
| 0.10 | 0.10 | 0.5 | 18 | 18 |
| 0.10 | 0.50 | 0.1667 | 18 | 3.6 |
| 0.10 | 0.90 | 0.1 | 18 | 2 |
| 0.50 | 0.10 | 0.8333 | 3.6 | 18 |
| 0.50 | 0.50 | 0.5 | 3.6 | 3.6 |
| 0.50 | 0.90 | 0.3571 | 3.6 | 2 |
| 0.90 | 0.10 | 0.9 | 2 | 18 |
| 0.90 | 0.50 | 0.6429 | 2 | 3.6 |
| 0.90 | 0.90 | 0.5 | 2 | 2 |
We assume the GE channel models for transmission of various XMEAS or XMV variables are statistically independent of each other but they all have the same p and q values for the state transition probabilities. When the GE channel is in the bad state, the controller will use the last XMEAS value available to it. By varying (p, q), we can evaluate the effects of the wireless channel model on the communications performance and then extend the discussion to the control performance.
IV. Evaluation of the Wireless Channel Effects
The main control objective of the TE plant is to maintain process variables within prescribed tolerances. When wireless technology is used to communicate the XMEAS and XMV variables, we need to determine whether the control performance would degrade compared with the baseline case of using near perfect wired communications. The major control performance metrics to be used in such a comparison include production flow rate, product mole fractions, and reactor pressure.
We implemented the TE plant model and Ricker’s controller design in a C++ simulator along with the two channel models described earlier. A simple star topology is adopted in the wireless network, where all the sensors and actuators communicate wirelessly with a designated node, such as a wireless gateway connected to the plant controller. The evaluation is performed in three major operation scenarios: fixed optimal setpoint operation, online changed setpoint operation and disturbance-enabled operation. The aforementioned IID and GE channel models are used in the fixed setpoint case so that the sensitivity of the controller to the average PER and channel burstiness is evaluated. Our results for the first scenario indicate that channel burstiness has a negative impact on the control performance, given the same average PER as in the IID model. Therefore, in the following scenarios, the discussions are focused on the control performance variation with the average PER set to the Pe,iid value in the IID model.
A. Fixed Setpoint Operation
We first study wireless channel impact on the TE process operating at the optimal setpoints in Mode 1. To assess the impact of wireless packet loss, we select different values of Pe,iid in our simulations. In each simulation run, the same value of Pe,iid is used in the model for every wireless link between a field instrument and its associated gateway. The gateway is assumed to be connected to the controller without causing any further transmission delays or error. After initializing the plant with the optimal setpoint values from Tables 1 and 3 in [11], each simulation scenario is run for 72 hours of plant operation. Even though every XMEAS and XMV variable gets updated and transmitted once every 1.8 seconds, we record these variables once every 36 seconds (i.e., one out of every 20 samples) for the purposes of analyzing and plotting various performance metrics of the process control problem. We run each simulation scenario once assuming wireless channels are used and once assuming wired channels as the baseline. If any violation of the plant constraints occurs, e.g., the reactor pressure exceeding the prescribed limit, the simulator will automatically pause and record the plant shutdown event in the simulation log.
a) IID Channel Model
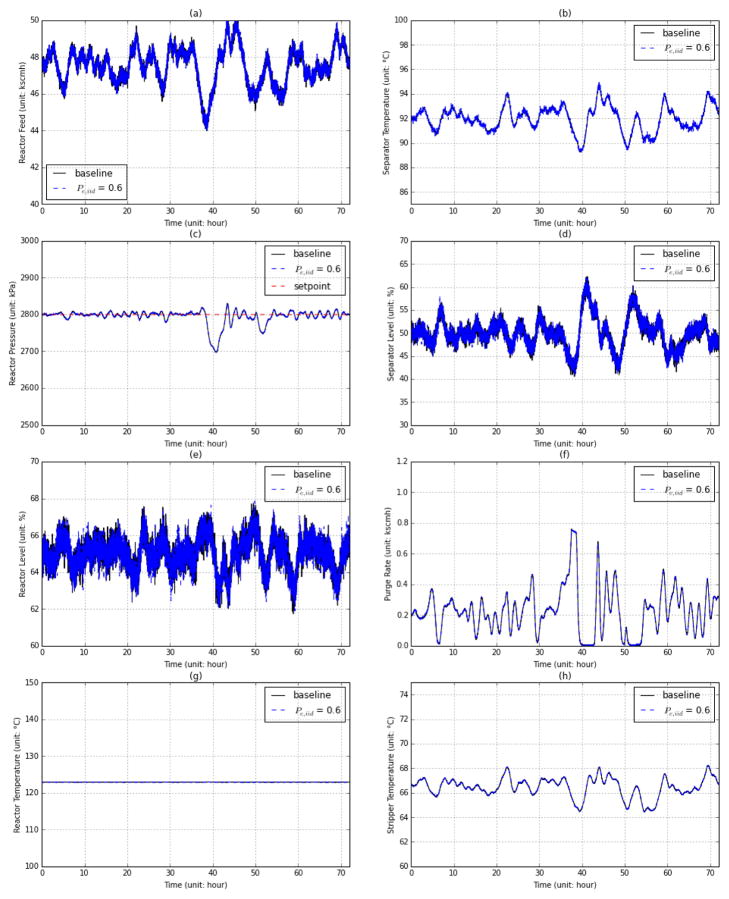
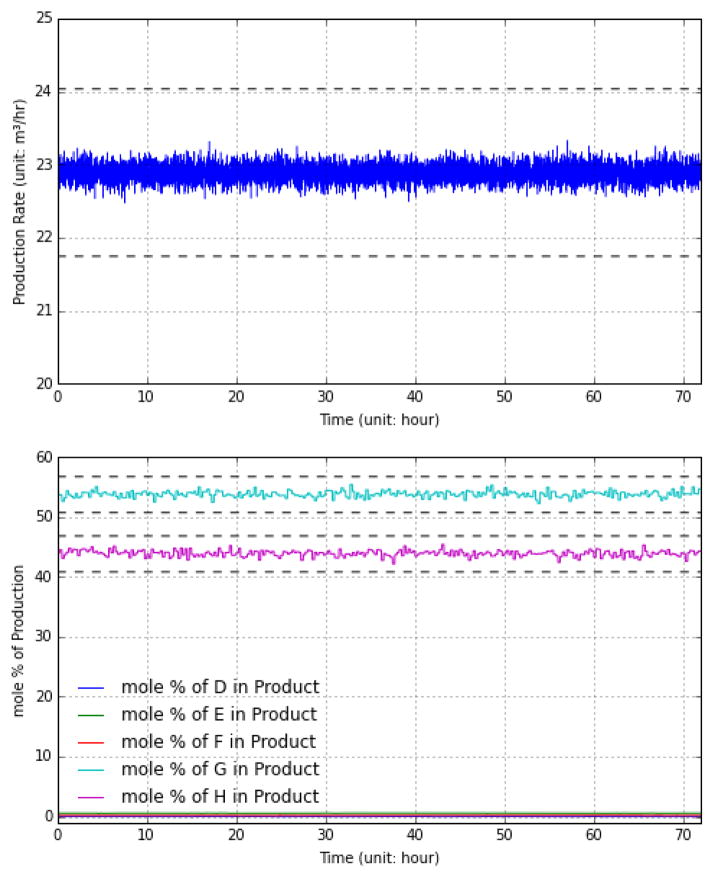
Fig. 6 provides more details on the 72-hour plant operation simulation run. When wireless links with (Pe,iid =0.6) are used, as suggested by [17], the TE process maintains similar performance as in the baseline case. This is mainly due to the fact that Ricker’s controller design has already incorporated sufficient redundancy to guard against potential data delays/losses. The process update setting of 1.8 seconds is fast enough to detect the slow chemical process variations even if a number of packets are lost. The controller can still rely on the remaining successful updates to avoid missing the important state changes in the plant.
Figure 6.
Select process variables in fixed setpoint operation using IID channel model with (Pe,iid = 0.6)
To probe for the limits of the controller in use, we investigate the control performance over a wider PER range. We select the reactor pressure as the performance metric, because it is particularly vulnerable to imperfect control command communications. At the controller, reactor pressure is intended to be driven as high as possible because the reaction efficiency improves as reactor pressure increases [18]. However, the TE process will shut down the plant for safety if the reactor pressure exceeds the safety threshold of 3000 kPa. Therefore, the optimal setpoint of reactor pressure is suggested at 2800 kPa in Mode 1 [11]. When wireless communications is used, as the PER increases, the expected length of the interval between two successful updates increases, which prohibits the controller from quickly responding to the deviation of the reactor pressure from the setpoint. Fig. 7 illustrates the mean and standard deviation of the reactor pressure deviation from the setpoint as a function of the error rate of the IID channel model. Each point in Fig. 7 represents 100 independent simulation runs with random seeds. It is observed that the reactor pressure control deviates more from the setpoint as the communication channel gets less reliable, which may result in a plant shutdown.
Figure 7.
Statistics variation of reaction pressure deviation from the setpoint under different Pe,iid
b) GE Channel Model
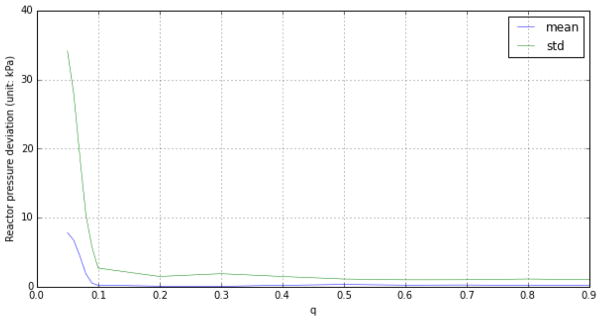
We continue with the fixed setpoint operation scenario, but we change the channel model from IID to GE. While in the case of the IID channel model we mainly focused on the probability of packet loss, which is the same as PER, the evaluation in the GE model case will be focused on the impact of the channel burstiness. The channel burstiness is controlled by the values of p and q. As the value of p (q) decreases, the channel becomes more bursty. In a bursty channel with a small q, when the link experiences one bad transmission, it is highly likely to have another bad transmission during the next update, which impairs the control process. We select different (p, q) pairs in the sample space (0, 1)2, while keeping constant. We repeat the simulation at each q for 500 times.
Fig. 8 illustrates the mean and standard deviation of pressure deviation as a function of q while Pe,GE =0.6. As shown in Table 1, a smaller q leads to a longer interval between successive updates over a wireless link, which reduces the agility of the controller and postpones the manipulation effort. As it can be seen from Fig. 8, when the average burst duration for the bad channel is longer than 18 seconds (q<0.1), the TE controller quickly loses pace and deviates away from the desired setpoint. Since the transmission over the wireless channel starts at the beginning of the simulation, it is of interest to determine how long the plant continues to operate until it shuts down.
Figure 8.
The statistics of reactor pressure deviation from the setpoint vs. q in the GE model with Pe,GE = 0.6
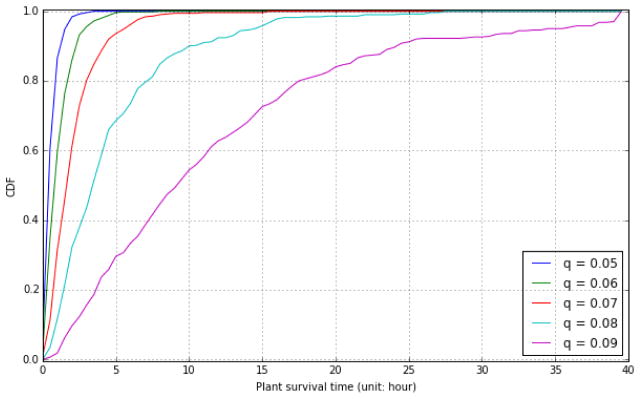
Fig. 9 illustrates the cumulative distribution function (CDF) of the plant survival time for different q at Pe,GE = 0.6. Just as there is a significant deviation of the reactor pressure when q<0.1, the plant shuts down rapidly within a few hours. The smaller q is, the faster the shutdown happens.
Figure 9.
The CDF of plant operation time under different q in the GE model with Pe,GE = 0.6
B. Changed Setpoint Operation
When a setpoint is intentionally changed during the operation of the plant, the control strategy is designed to manipulate the process to transition to the new stable state gracefully. There are many setpoints that can be changed in the TE model. We study changing the reactor pressure setpoint consistent with previous studies presented earlier in this section. The setpoint for the reactor pressure is tuned from the original value of 2800 kPa to 2500 kPa while other setpoints stay unchanged. The update rate of once every 1.8 seconds is also unchanged in the transition.
a) IID Channel Model
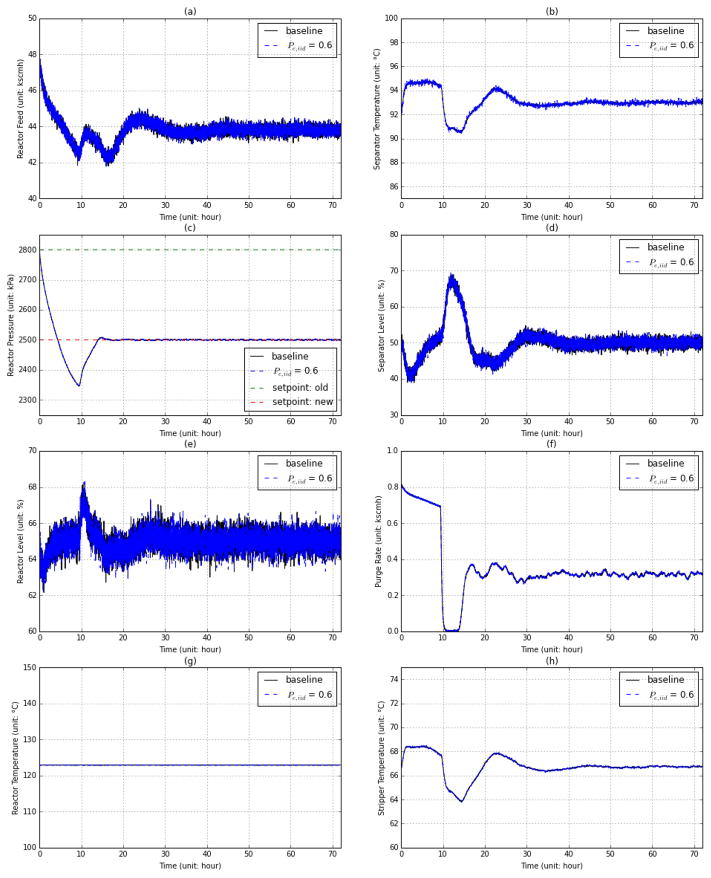
As shown in Fig. 10(c), the controller takes multiple discrete time steps to ramp the reactor pressure down, and one undershoot is observed which is due to the control strategy. Similarly, the other process variables experience adjustments and converge to the new stable state. The total adjustment period lasts around 15~20 hours in the simulation. Under the same controller, the control performance with an IID channel model with Pe,iid =0.6 in use is comparable with the baseline case of using wired links. We note that the relative difference between any pair of time sequences, one pair for each key performance metric illustrated in Fig. 10, is smaller than 1 % at any time in the simulation.
Figure 10.
The effects of a change in the reactor pressure setpoint on select process variables using the IID channel model with (Pe,iid = 0.6)
b) GE Channel Model
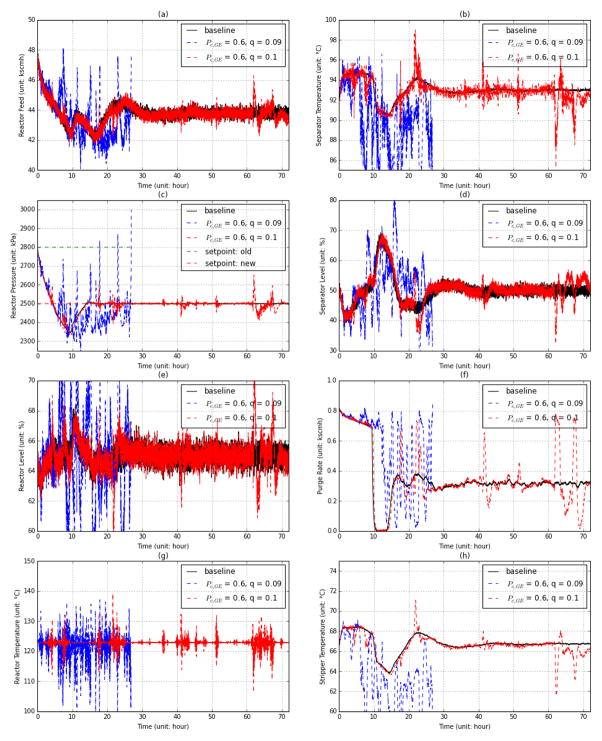
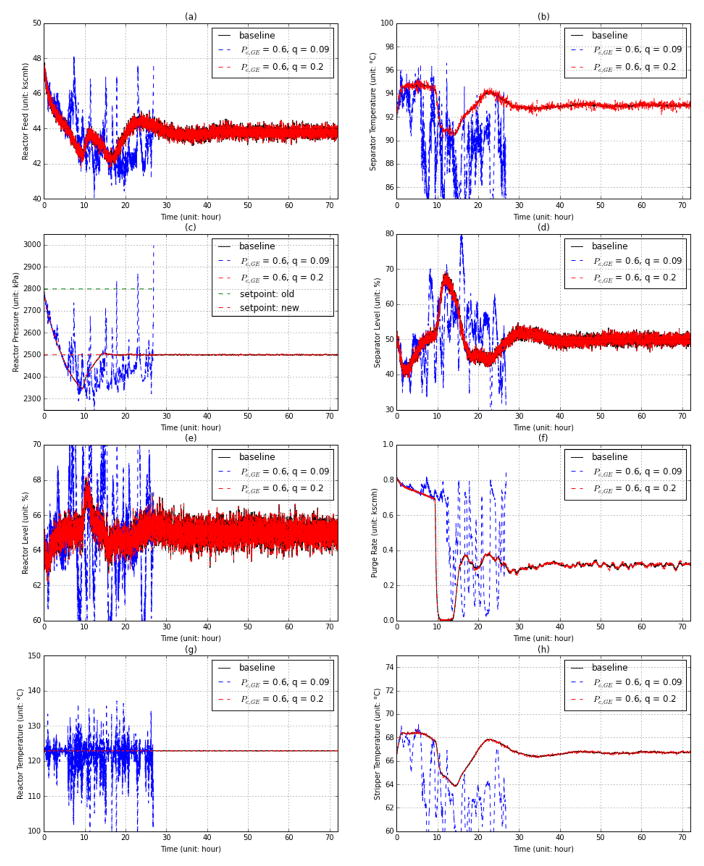
The same plant operation is repeated with the GE channel model (Pe,GE =0.6). While the average PER is kept to Pe,GE =0.6 consistently with the IID channel model, q is set to 0.09, 0.1 and 0.2 based on the discussion in Fig. 8. The first two values were chosen close to each other, because the response of the system to the burstiness of the link is sensitive around q = 0.1. Fig. 11 and Fig. 12 illustrate the variations of select process variables in and after the setpoint change with different channel settings. As discussed in Section III-B, the smaller the q is, the more likely it is for a larger burst of loss to occur. Therefore, compared with the baseline case (with no packet error), a smaller q brings more jitter and higher risk of plant shutdown.
Figure 11.
The effects of a change in the reactor pressure setpoint on select process variables using the GE channel model (Pe,GE = 0.6, q ∈ {0.09,0.1})
Figure 12.
The effects of a change in the reactor pressure setpoint on select process variables using the GE channel model (Pe,GE = 0.6, q ∈ {0.09,0.2})
C. Disturbed Operation
Downs and Vogel [11] suggest 20 different disturbances in the TE model to test the controller performance. We simulate one of their disturbed operation scenarios to evaluate the control performance with wired and wireless links in use.
a) IID Channel Model
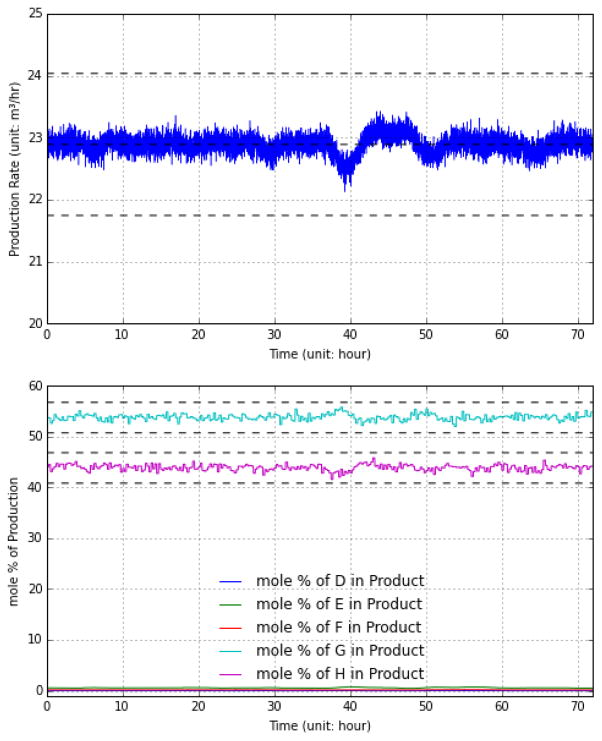
Fig. 13 and 14 illustrate the process performance when random disturbance (IDV 8 in Table 8 [11]) is enabled in the A, B and C feed composition (stream 4). The performance of the controller is excellent in both the baseline links and the wireless IID channel (with Pe,iid = 0.6). The production rate and the mole fractions of the products are maintained within the specified bounds as shown in Fig. 13.
Figure 13.
Production rate and product mole fractions using IID model in disturbed operation (Pe,iid = 0.6, IDV 8 enabled)
Figure 14.
Select process variables using IID model in disturbed operation (Pe,iid = 0.6, IDV 8 enabled)
The production rate and the mole fractions of the products are maintained within the specified bounds as shown in Fig. 13. The temperature controller keeps the reactor temperature almost constant at the setpoint even under the disturbance (as shown in Fig. 14(g)), and it also keeps the temperature variations at the separator and stripper (as shown in Fig. 14(b) and 14(h), respectively) at a low frequency (less than 8~10 h−1) although they vary significantly compared with the scenario without the disturbance as shown in Fig. 6. During the whole operation, the controller performs the same whether wireless or wired links are used for communications, which suggests that wireless links can support robust process control even under disturbances.
b) GE Channel Model
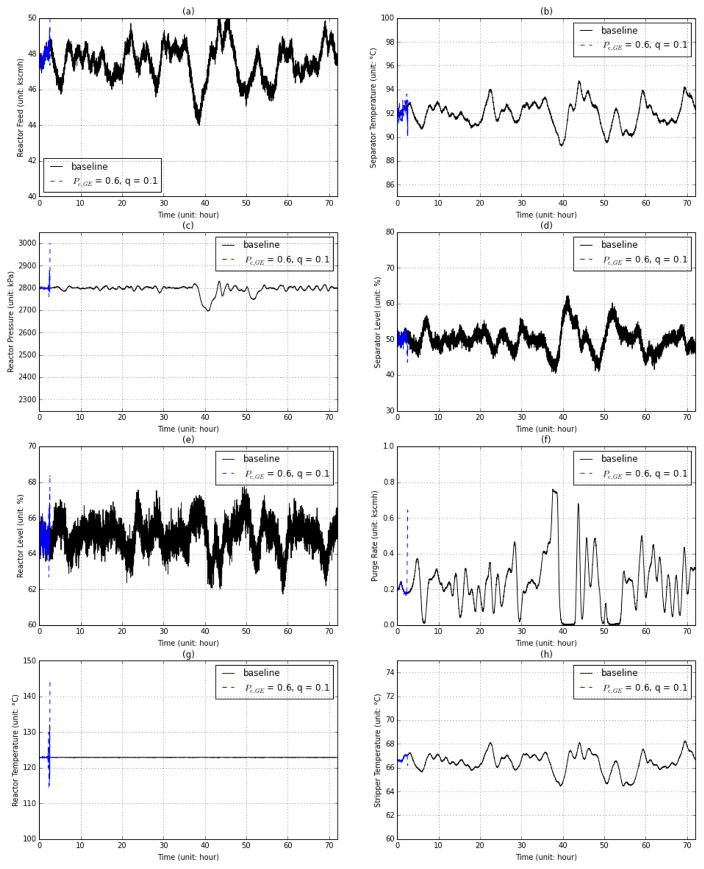
As the Disturbance IDV8 is enabled, the controller is obliged to make control decisions based on incomplete data from the plant. Once the GE channel model introduces bursty packet loss in the links, the situation becomes worse. Fig. 15 and Fig. 16 illustrate the variations of select process variables when a GE channel with Pe,GE =0.6, q =0.1 and Pe,GE =0.6, q =0.2, respectively, is in use. When q =0.1, it is likely to experience longer link failures combined with the random loss of feed composition updates, which makes the plant prone to failure. Fig. 15 shows one case of such shutdown caused by higher reactor pressure. When the packet loss is not as bursty, i.e., q is larger, the controller is able to keep the plant operating at the normal level as shown in Fig. 16.
Figure 15.
Select process variables using the GE channel model in disturbed operation (Pe,GE = 0.6, q=0.1, IDV 8 enabled)
Figure 16.
Select process variables using the GE channel model in disturbed operation (Pe,GE = 0.6, q=0.2, IDV 8 enabled)
V. Conclusions
In this paper we have evaluated the effects of using wireless communications, mainly the random packet loss, on the industrial process control performance in a simulated chemical process model. Two wireless channel models have been studied in conjunction with three major process operation scenarios. The results indicate that 1) different wireless channels have different effects on the control performance; 2) wireless channels at normal packet loss levels in an industrial environment can support the controller working in fixed setpoint, changed setpoint and the cases where there is a disturbance; and 3) when the wireless links are severely impaired, the controller suffers from large packet loss or long delay, which drives the control process off track and it may cause the plant to shut down. Therefore, it is important to have a good understanding of the RF propagation environment in a given plant before using wireless technology in control operations. Nevertheless, the emerging wireless technologies for industrial control applications can meet the control requirements with careful network provisioning and configuration.
The ISA 100.11a standard provides one viable solution to build a wireless network to support industrial process control systems. Consider the TE process control problem as an example:
The ISA100.11a standard provides programmable time slots and a repeatable frame structure for periodic process variable updates. For the TE model, with the time slot duration set to 10 milliseconds, a frame containing 180 time slots, corresponding to one update every 1.8 s, can easily serve the control update task by accommodating 53 direct communications links between the gateway and the field instruments by allocating one time slot to each update packet. The remaining time slots can be used for packet retransmissions, which further improves the success of the process update operation.
Frequency hopping employed in the ISA100.11a standard can greatly improve the wireless link performance in the plant environment under severe RF interference conditions. As there are a total of 16 non-overlapping wireless channels available in the 2.4 GHz ISM frequency band, per-slot channel hopping prevents a given link from always suffering from strong interference in the same channel. The ISA100.11a standard also supports black listing of channels that are detected to be suffering from being in bad state for a long period of time.
The PHY layer protocol of the ISA100.11a standard is based on the IEEE 802.15.4 standard, which uses the direct sequence spread spectrum (DSSS) technology to reduce the noise/interference in the received signal for better link performance. Moreover, ISA100.11a increases the maximum transmission power to 10 dBm in comparison with the standard IEEE 802.15.4 radios. This improves the quality of the received radio, which would prove useful in the harsh industrial plant RF propagation environment.
VI. Future Work
In future work we will study the implementation of an ISA100.11a network for the TE process problem based on the lessons learned from this paper. A joint modeling and co-simulation of the process control problem and the wireless network behavior will be studied. In addition, we will evaluate various techniques, such as multi-path routing, multi-channel hopping, and scheduling for prioritized emergency control messaging, for improving wireless link performance in support of industrial control applications.
Figure 5.
Production rate and product mole fractions in fixed setpoint operation using an IID channel model with (Pe,iid = 0.6)
Footnotes
Disclaimer
Certain commercial equipment, instruments, or materials are identified in this paper in order to specify the experimental procedure adequately. Such identification is not intended to imply recommendation or endorsement by the National Institute of Standards and Technology, nor is it intended to imply that the materials or equipment identified are necessarily the best available for the purpose.
References
- 1.Lee JH, Lee JM. Progress and Challenges in Control of Chemical Processes. Annu Rev Chem Biomol Eng. 2014;5(1):383–404. doi: 10.1146/annurev-chembioeng-060713-035908. [DOI] [PubMed] [Google Scholar]
- 2.Somappa AK, Øvsthus K, Kristensen LM. An Industrial Perspective on Wireless Sensor Networks: A Survey of Requirements, Protocols, and Challenges. IEEE Commun Surv Tutor. 2014;16(3):1391–1412. [Google Scholar]
- 3.Sheng Z, et al. Recent Advances in Industrial Wireless Sensor Networks Toward Efficient Management in IoT. IEEE Access. 2015;3:622–637. [Google Scholar]
- 4.“Wireless Systems for Industrial Automation: Process Control and Related Applications”, ISA-100.11a-2009 Standard, 2009.
- 5.IEC 62591 Ed. 1.0 b:2010, “Industrial Communication Networks—Wireless Communication Network and Communication Profiles—WirelessHART™,” 2010.
- 6.Somappa AK, Øvsthus K, Kristensen LM. An Industrial Perspective on Wireless Sensor Networks: A Survey of Requirements, Protocols, and Challenges. IEEE Commun Surv Tutor. 2014;16(3):1391–1412. [Google Scholar]
- 7.Remley Kate, et al. NIST Technical Note 1550. 2008. NIST Tests of the Wireless Environment in Automobile Manufacturing Facilities. [Google Scholar]
- 8.Tanghe E, et al. The Industrial Indoor Channel: Large-Scale and Temporal Fading at 900, 2400, and 5200 MHz. IEEE Trans Wireless Comm. 2008 Jul;7(7):2740–2751. [Google Scholar]
- 9.Saifullah A, et al. End-to-End Communication Delay Analysis in Industrial Wireless Networks. IEEE Trans Comput. 2015 May;64(5):1361–1374. [Google Scholar]
- 10.Lo Bello L, Toscano E. Coexistence issues of multiple co-located IEEE 802.15. 4/ZigBee networks running on adjacent radio channels in industrial environments. IEEE Trans Ind Informat. 2009;5(2):157–167. [Google Scholar]
- 11.Downs JJ, Vogel EF. A Plant-wide Industrial Process Control Problem. Comput Chem Engng. 1993;17(3):245–255. [Google Scholar]
- 12.Ricker NL. Decentralized Control of the Tennessee Eastman Challenge Process. J Proc Cont. 1996;6(4):205–221. [Google Scholar]
- 13.Ricker NL. New Simulink models of two decentralized control strategies. 2002 Dec; [Online]. http://depts.washington.edu/control/LARRY/TE/download.html#Multiloop.
- 14.Gilbert EN. Capacity of a Burst-Noise Channel. Bell Syst Tech J. 1960 Sep;39:1253–1265. [Google Scholar]
- 15.Elliott EO. Estimates of Error Rates for Codes on Burst-Noise Channels. Bell Syst Tech J. 1963 Sep;42:1977–11997. [Google Scholar]
- 16.Haßlinger G, Hohlfeld O. The Gilbert-Elliott Model for Packet Loss in Real Time Services on the Internet. GI/ITG MMB’08. 2008 [Google Scholar]
- 17.Emerson Process Management, “System Engineering Guideline - IEC 62591 WirelessHART”, Rev. 04, May 2014.
- 18.Cardenas A, et al. ASIACCS 2011. Hong Kong, China: 2011. Attacks Against Process Control Systems: Risk Assessment, Detection, and Response. [Google Scholar]


