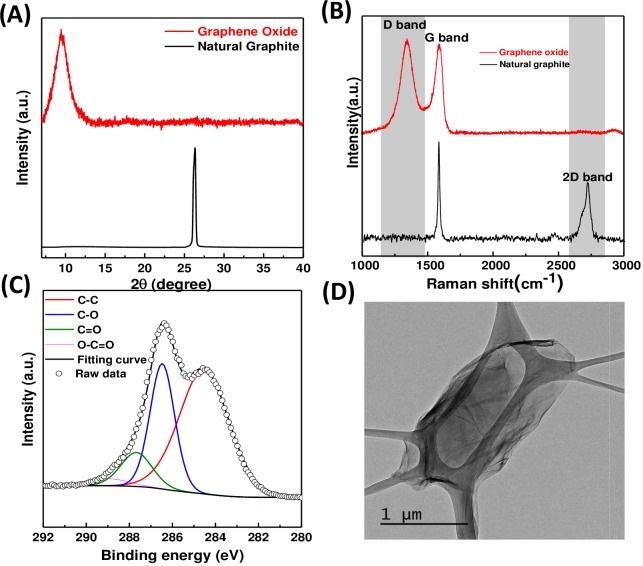
Figure 2. XRD, Raman, XPS and TEM for GO characterization.
(A) XRD patterns of natural graphite and as-produced GO. (B) Micro Raman spectra of natural graphite and as-produced GO. (C) C1s peak of GO in the HRXPS spectrum. C1s peak was deconvoluted to C–C, C–O, C=O, and COOH surface functionalities at 284.4, 286, 287, and 289 eV, respectively. (D) TEM image of GO.

