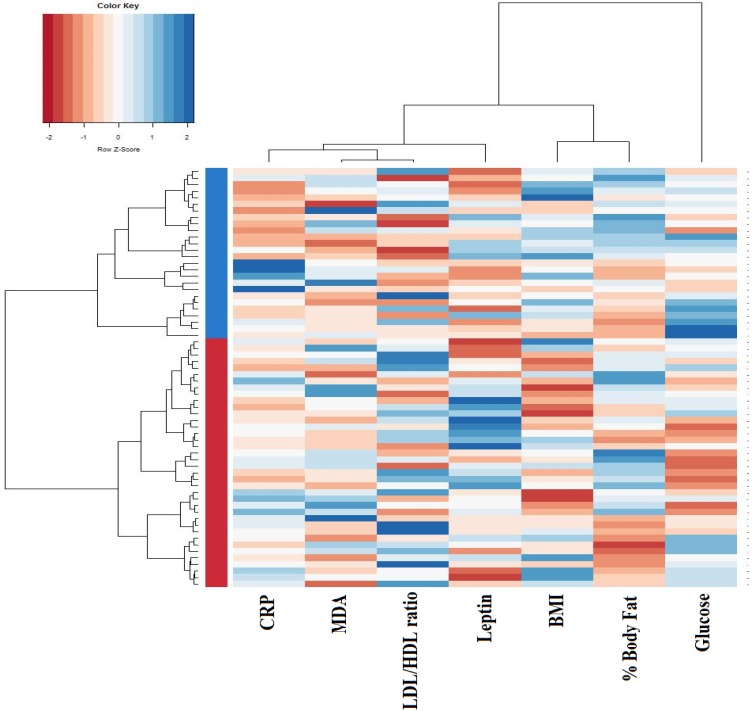
Figure 1.
Dendogram clustering based on individual body composition, serum glucose, lipid profile, and oxidative stress biomarkers. The heatmap shows the dendrogram classification for clusters, based on C reactive protein (CRP), malondialdehyde (MDA), LDL/HDL ratio, serum leptin, Body Mass Index (BMI), body fat percentage and serum glucose (columns). Colors in the vertical bar at the left of the heatmap identify Cluster I (red) and Cluster II (blue).

