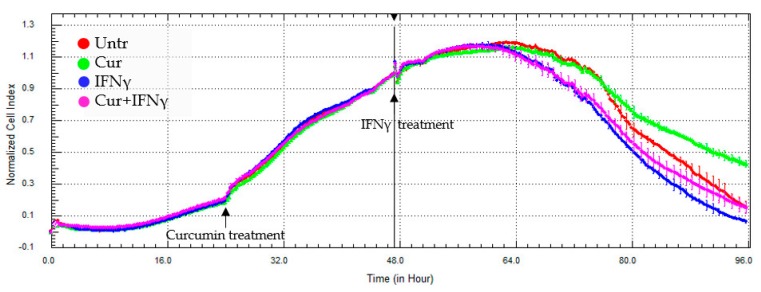
Figure 5.
Representative impedance profile after curcumin pre-treatment. HT29 cells, cultured in a 16-well E-plate, were pre-treated with curcumin (Cur, 24 h after seeding), and stimulated with IFNγ (48 h after seeding) for a further 48 h. The graph shows the cell index values, normalized at the time of the IFNγ stimulation. The experiment was performed in triplicate.

