

Abstract
We have investigated the physiology and mechanical profiles of skinned papillary muscle fibers from transgenic mice expressing the N47K mutation in the myosin regulatory light chain (RLC), shown to cause hypertrophic cardiomyopathy in humans. The results were compared with wild-type (WT) mice, both expressing the human ventricular RLC. Rate constants of a cross-bridge (XB) cycle were deduced from tension transients induced by sinusoidal length changes during maximal Ca2+ activation, and were studied as a function of MgATP, MgADP, and Pi concentrations. N47K mutant showed slower XB cycles but higher actin-activated ATPase activity compared with WT. Consequently, N47K exhibited larger tension than WT. K0 (ADP association constant) and K4 (equilibrium constant of force generation) were larger in N47K, and K1 (ATP association constant) was slightly larger in N47K vs. WT, demonstrating stronger nucleotide binding and force generation abilities of the mutant, but no changes in rigor acto-myosin binding were observed. Tension per XB was similar among groups, but N47K exhibited more XB distribution in the attached state. Larger values of tension and higher ATPase in N47K suggested that more cross-bridges participated in tension production in the mutant myocardium compared with WT. In vivo analysis of heart function, performed in ~12.5 month-old mice by echocardiography and invasive hemodynamics, demonstrated a significant decrease in dP/dtmax-EDV relationship, indicating a depression of ventricular contractility in N47K mice. Our findings suggest that the N47K mutation exerts its action through direct alterations of myosin motor function that ultimately result in pathological hypertrophic remodeling in N47K hearts.
Keywords: Cardiac contractility, Cardiomyopathy, Cross-bridge cycle, Elementary steps, Sinusoidal analysis, Myosin regulatory light chain, N47K, mouse model
Graphical abstract
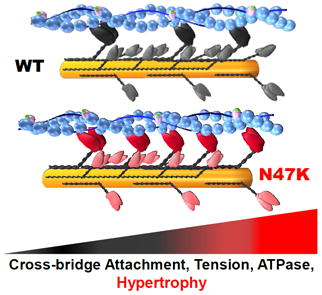
Mechanical studies in papillary muscles from N47K-RLC mice revealed larger tension production and slower cross-bridge kinetics, paralleled by higher actin-activated ATPase compared to WT-RLC hearts. Echocardiography and hemodynamic evaluations showed hypertrophy and depressed ventricular contractility in the mutant. N47K mutation exerts its action through alterations of myosin motor function that ultimately result in hypertrophic cardiomyopathy in N47K-positive patients.
Introduction
Cardiac muscle contraction is powered by the myosin motor capable of converting chemical energy stored in ATP into the mechanical work of propelling actin and sarcomere shortening [1]. In addition to two myosin heavy chains (MHC) that form the head, neck, and tail domains of myosin, the regulatory (RLC) and essential (ELC) light chains are attached to their respective MHC-IQ motifs in the myosin’s neck region [2]. Both light chains are known to play important regulatory roles in muscle contraction in health and disease, and are capable of modulating the structure and function of myosin motors [3-5]. As inherent subunits of the myosin lever arm, ELC and RLC participate in the actomyosin cross-bridge (XB) cycle, and in the execution of the power stroke and force production. Using bifunctional fluorescence probes attached to myosin RLC in demembranated muscle fibers, the Irving group showed that the conformation of the myosin motors in actively contracting muscle is sensitive to the force borne by the thick filaments [6]. The authors proposed a novel regulatory mechanism of thick filament mechano-sensing that acts independently of the known tropomyosin-troponin-dependent Ca2+ signaling mechanism [6]. Our previous studies on myosin RLC mutants demonstrated an active involvement of RLC in the thick filament-mediated mechano-sensing mechanism [7]. We showed that the changes in myosin kinetics were a result of mutation-induced loss of myosin strain sensitivity and that mutations in the RLC caused an interference in the RLC-MHC communication that ultimately led to alterations in the transmission of external loads to the myosin’s active site [7].
Similar to other major sarcomeric genes, mutations in MYL2 encoding the human ventricular RLC are known to be associated with familial hypertrophic cardiomyopathy (HCM) [4]. HCM is an autosomal dominant disease characterized by hypertrophy of the left ventricle (LV) and interventricular septum (IVS), myofibrillar disarray and interstitial fibrosis, and is considered a leading cause of sudden cardiac death (SCD) in the young, including trained athletes [8]. The most frequently occurring sarcomeric protein gene mutations related to HCM are those in the β-MHC (MYH7) and in myosin binding protein C (MYBPC3), and they account for ~80% of all identified sarcomeric protein mutations [9]. Mutations in ELC and RLC (MYL3 and MYL2) are estimated as ~3 %, but their number is progressively growing [10, 11].
The N47K (Asparagine-to-Lysine) mutation in MYL2 was discovered during screening of 68 Danish and 130 South African HCM probands and found to be associated with a mid-ventricular hypertrophy (MVH) phenotype in a Danish patient [12]. The mutation was found to cause a late onset of the disease with a rapidly progressing MVH phenotype and a significant increase in the size of the papillary muscles, but with an absence of SCD [12]. It is located directly in the RLC’s first EF-hand Ca2+-Mg2+ binding loop obstructing the binding of calcium to the RLC site [13]. Previous studies have determined the N47K-mediated depression of cardiac function in transgenic (Tg) mice and in β-MHC reconstituted porcine cardiac muscle preparations [7, 13-17], without affecting the myosin light chain kinase (MLCK)-dependent phosphorylation of RLC in the ventricles of Tg mice [14].
In this report, we comprehensively investigated the effects of N47K on myosin motor function in demembranated muscle fibers and compared these effects with the impact the mutation imposed on the heart function in vivo. Echocardiography study showed a significantly enlarged IVS and increased LV mass in N47K compared with WT mice, demonstrating a similar MVH phenotype as observed in humans [12]. Invasive hemodynamics assessment revealed a decompensated function of the N47K hearts manifested by a decrease in the peak rate of rise in LV pressure-end diastolic volume relationship (dP/dtmax-EDV) compared with age matched WT controls. Based on the XB model with five elementary steps [18], we found that: 1) N47K exhibited larger tension than WT in standard activation and during MgATP and Pi studies, which may represent an overcompensation in the process of cardiac hypertrophy; 2) N47K showed larger K0, K4 and slightly larger K1 than WT, demonstrating a stronger nucleotide binding capacity and force production; 3) Tension/XB was similar in N47K and WT; 4) N47K exhibited more XB distribution in the attached state and less in the detached state than WT, demonstrating that the bigger tension production in N47K was due to increased XB attachment.
Results
Morphology and cardiac function in N47K vs. WT mice
To understand the in vivo consequences associated with the HCM-linked N47K mutation, the cardiac function and morphology were examined by echocardiography and invasive hemodynamics using ~12.5 mo-old Tg mice of both genders. The results for N47K animals were compared to those obtained for age matched WT mice. Consistent with the phenotype observed in humans carrying N47K, the hearts of N47K animals demonstrated MVH phenotype manifested by a significantly thicker IVS in diastole and systole, and significantly increased LV mass compared with WT animals (*P<0.05, **P≤0.01) (Fig. 1A, Table 1). Doppler evaluation did not show major differences between the groups (Fig. 1B), and likewise, hemodynamic assessments showed no significant differences in SV (stroke volume), CO (cardiac output) and Tau (relaxation time) (Fig. 1C, Table 1). However, the peak rate of rise in LV pressure-end diastolic volume relationship (dP/dtmax-EDV) was significantly lower in N47K mice compared with WT, indicating decreased contractility of N47K hearts (*P<0.05) (Fig. 1C).
Figure 1. In vivo characterization of N47K and WT mice.
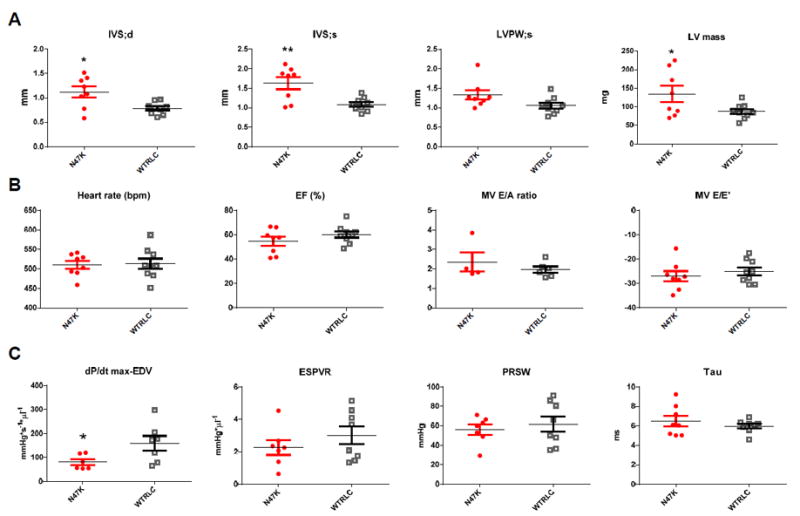
All assessments were made using eight ~12.5 month-old N47K mice (6 females and 2 males), and nine ~12.4 month-old WT mice (7 females and 2 males). No functional differences between sexes were noted. N47K mice are depicted in red closed symbols, while WT mice are represented by black open symbols. A. Heart morphology assessed by M-mode echocardiography. IVS, interventricular septum: d, diastole and s, systole; LVPW, left ventricular posterior wall and LV mass. Note significant changes in IVS in diastole and systole, and a significant increase in LV mass in N47K vs. WT hearts. B. Doppler-echocardiography assessment of heart function. EF, ejection fraction; E/A – Mitral valve peak E-wave to A-wave velocity ratio, E/E’ – transmitral early peak velocity (E) to early diastolic mitral annulus velocity (E’) ratio. C. Hemodynamic assessment of N47K vs. WT mice by Pressure-Volume loops. dP/dt max-EDV, peak rate of rise in LV pressure–end diastolic volume relationship; ESPVR, end-systolic PV relation (slope); PRSW, preload recruited stroke work and Tau – relaxation time (in ms). Note a significant decrease in dP/dtmax-EDV for N47K vs. WT hearts. The data are represented as the mean ± SEM, *P < 0.05; **P ≤ 0.01; using t-test.
Table 1.
Assessment of heart function in vivo of ~12.5 month-old N47K vs. WT-RLC mice
| N47K | WT | |
|---|---|---|
| Echocardiography | ||
| No. of animals | 6F, 2M | 7F, 2M |
| Heart, mg/body, g | 4.40±0.51 | 4.22±0.32 |
| Heart, mg/tibia, mm | 8.0±0.85 | 8.42±0.58 |
| HR (bpm) | 510±10 | 513±13 |
| EF (%) | 55±4 | 60±3 |
| FS (%) | 35±2 | 31±3 |
| IVS;d (mm) | 1.12±0.11* | 0.79±0.04 |
| IVS;s (mm) | 1.63±0.15** | 1.09±0.06 |
| LVID;d (mm) | 4.0±0.17 | 4.04±0.12 |
| LVID;s (mm) | 2.61±0.13 | 2.79±0.15 |
| LVPW;d (mm) | 0.86±0.09 | 0.69±0.05 |
| LVPW;s (mm) | 1.33±0.12 | 1.06±0.07 |
| LV mass/corr (mg) | 134.35±21.9 | 87.09±6.74 |
| Doppler analysis | ||
| IVCT (ms) | 15.4±1.4 | 15.2±1.1 |
| IVRT (ms) | 15.0±0.9 | 15.4±1.2 |
| MV A (mm/s) | 294±54 | 349±27 |
| MV E (mm/s) | 729±66 | 722±39 |
| MV E/A | 2.36±0.5 | 1.97±0.15 |
| MV E/E’ | -27.03±2.07 | -25.06±1.5 |
| Invasive hemodynamics | ||
| SW (mmHg*μl) | 2139±328 | 2483±216 |
| CO (μl min-1) | 15257±1717 | 14800±813 |
| SV (μl) | 29.7±2.9 | 27.46±1.44 |
| ESV (μl) | 31.7±3.28 | 27.2±3.5 |
| EDV (μl) | 56.0±3.6 | 52.1±3.6 |
| Pes (mmHg) | 79.2±5.8 | 93.8±4.7 |
| Ped (mmHg) | 6.0±1.2 | 4.6±0.4 |
| HR (bpm) | 512±19 | 497±12 |
| Ea (mmHg μl-1) | 2.78±0.22 | 3.18±0.19 |
| dP/dtmax (mmHg s-1) | 7465±731 | 9070±533 |
| -dP/dtmin (mmHg s-1) | 6787±694 | 8456±602 |
| Tau (ms) | 6.48±0.55 | 5.98±0.24 |
| ESPVR (mmHg μl-1) | 2.27±0.46 (5F, 2M) | 3.01±0.54 (6F, 2M) |
| EDPVR (mmHg μl-1) | 0.15±0.03 (6F, 1M) | 0.14±0.03 |
| PRSW (mmHg) | 56.02±5.29 (5F, 2M) | 61.75±7.91 |
| dP/dtmax-EDV (mmHg s-1μl-1) | 80.63±12.66* (4F, 2M) | 159.36±30.34 (5F, 2M) |
Abbreviations: Heart weight/ body weight in mg/g; Heart weigh/tibia length in mg/mm; HR, heart rate in beats per minute; EF%, ejection fraction; FS%, fraction of shortening; IVS, inter ventricular septum; LVID, left ventricular inner diameter; LVPW, left ventricular posterior wall; d, diastolic; s, systolic; IVRT, isovolumetric relaxation time; IVCT, isovolumetric contraction time; MV E/A, mitral valve inflow -peak E-wave to A-wave velocity ratio; E, transmitral early peak velocity; E’, early diastolic mitral annulus velocity; CO, cardiac output; SW, stroke work; SV, stroke volume; ESV, end-systolic volume; EDV, end-diastolic volume; Pes, end-systolic pressure; Ped, end-diastolic pressure; Ea, arterial elastance; dP/dt max, peak rate for pressure rise;-dP/dtmin, peak rate for pressure decline; Tau, relaxation time constant; ESPVR, end-systolic PV relation (slope); EDPVR, end-diastolic PV relation (slope); PRSW, preload recruitable power stroke work. F-female; M-male mice. Lower number of hearts shown in parentheses indicate that some animals have not survived or did not produce the data. Data are the mean ±SEM; t-test,
P<0.05 and
P≤0.01 vs. WT.
Skinned muscle fiber studies
Standard activation study
Fig. 2A presents the complex modulus Y(f) for papillary muscle fibers from N47K vs. WT mice derived from the standard activation and includes the plots of elastic modulus vs. frequency, viscous modulus vs. frequency and viscous modulus vs. elastic modulus (Nyquist plots). The complex modulus data were fitted to Eq. 1 [19, 20]:
| (Eq. 1) |
where ; 2πb represents the rate constant of the delayed tension, and 2πc represents the rate constant of fast tension recovery. Both of them are the apparent rate constants of processes B and C, respectively. B and C represent their respective magnitudes, and H represents the elastic modulus extrapolated to zero frequency [21]. The elastic modulus extrapolated to infinite (∞) frequency is Y∞ =H−B+C, where Y∞ corresponds to phase 1 of step analysis. Y∞ is often called as “stiffness” [21]. Process B corresponds to phase 3 in step analysis, and is a medium-frequency exponential delay at which muscle generates oscillatory work. Process C corresponds to phase 2, which is a high-frequency exponential advance at which muscle absorbs work. These correlations are entered in the Nyquist plot of Fig. 2A, and are studied as functions of [MgATP], [Pi] and [MgADP]. Fig. 2A also includes best-fit curves to the data based on Eq. 1. A detailed description of the sinusoidal analysis protocol was published previously [19, 21, 22].
Figure 2. Comparison of cross-bridge kinetics of N47K and WT fibers.
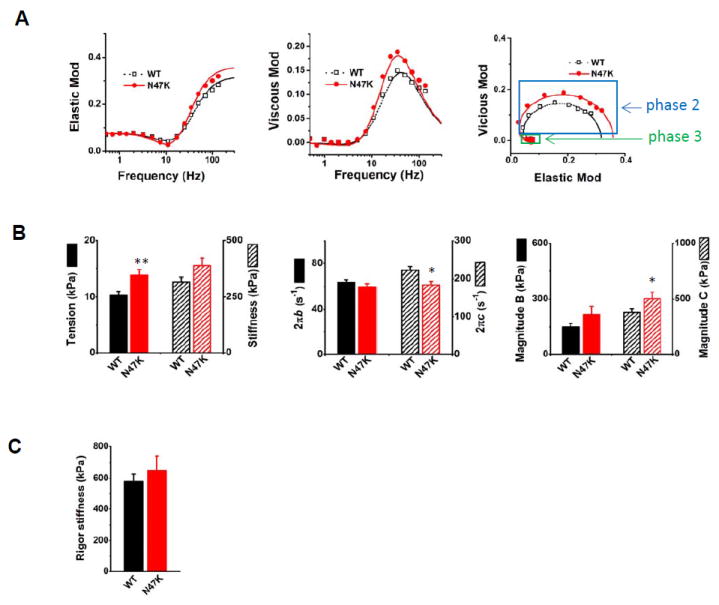
A. Plots of complex modulus Y(f), where f=frequency. Elastic modulus represents the real part of Y(f), while viscous modulus is the imaginary part of Y(f). Discrete points are measured values, and smooth curves are their best fit to Eq. 1. Phase 2 and phase 3 are indicated with blue and green boxes, respectively; n=37 experiments with WT and n=24 with N47K were performed. B. Cross-bridge parameters measured in the standard activating solution (Table 2) at 20°C (n=37 for WT and n= 24 for N47K). C. Rigor stiffness measured at 100Hz. Rigor was induced following the standard activation by washing out MgATP, CP, and CK; n=31 for WT and n= 24 for N47K. In A-C, values represent the mean ± SEM, *P < 0.05; **P ≤ 0.01; using t-test.
There was no significant difference between N47K and WT in the minimum position of the elastic modulus plot, (Fig. 2A), but a slightly left-shifted peak position of the frequency-viscous modulus plot was observed (N47K was slower than WT). Each Nyquist plot shows two contiguous semicircles, hence the complex modulus can be resolved into two exponential processes, B and C (Eq. 1), with process C faster than process B (b < c). The isometric tension and stiffness, the apparent rate constants 2πb and 2πc as well as their magnitudes measured during the standard activation were compared between two genotypes. N47K exhibited a significantly larger tension (**P≤0.01), and a slightly increased stiffness compared with WT; but the latter did not reach statistical significance (Fig. 2B). There were no significant differences in respective values of 2πb and magnitude B, but the rate constant 2πc was significantly smaller for N47K compared with WT, and magnitude C was significantly larger in N47K than in WT (*P<0.05) (Fig. 2B).
Rigor stiffness and MgATP studies
Rigor stiffness was measured at 100 Hz and is plotted in Fig. 2C. The rigor stiffness was not significantly different between WT and N47K fibers.
In the ATP study, different concentrations of MgATP (0.05, 0.1, 0.2, 0.5, 1, 2, 5, and 10 mM) were applied and the exponential process C was studied to examine whether the kinetic constants of MgATP binding (step 1) and the XB detachment (step 2) were affected by the N47K RLC mutation. [Pi] was kept at 8 mM to assure that the adequate number of XBs were distributed among the AM, AM*S and detached (Det) states, giving a better resolution to process C than at a lower Pi concentration; see Scheme 1 [23, 24]. Fig. 3A shows the apparent rate constant, 2πc plotted against [MgATP2-]. This relationship is hyperbolic (sigmoid in the semi log scale): 2πc increased linearly at [MgATP] ≤ 1 mM and saturated thereafter. The data were fitted to Eq. 2. (Eq. 3. of [23]), which is based on Scheme 1, where S represents [MgATP2-] (substrate: abbreviated as ATP hereafter), and D represents [MgADP1.5-] (abbreviated as ADP). D0 is the contaminating ADP concentration (see the following section on the ADP study).
| (Eq. 2) |
The apparent rate constant 2πc was smaller in N47K than in WT (with statistical significance at all points from 0.05 to 10S, except at 0.1S) (Fig. 3A). The tension was significantly larger in N47K than WT fibers (*P ≤ 0.05 at 0.05-0.5 mM S; **P ≤ 0.01 at 1-10 mM S) (Fig. 3A).
Scheme 1. Elementary steps of the cross-bridge cycle.
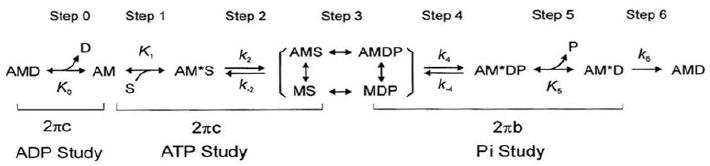
Figure 3. The effect of MgATP, Pi, and MgADP on the kinetic constants in N47K and WT fibers.
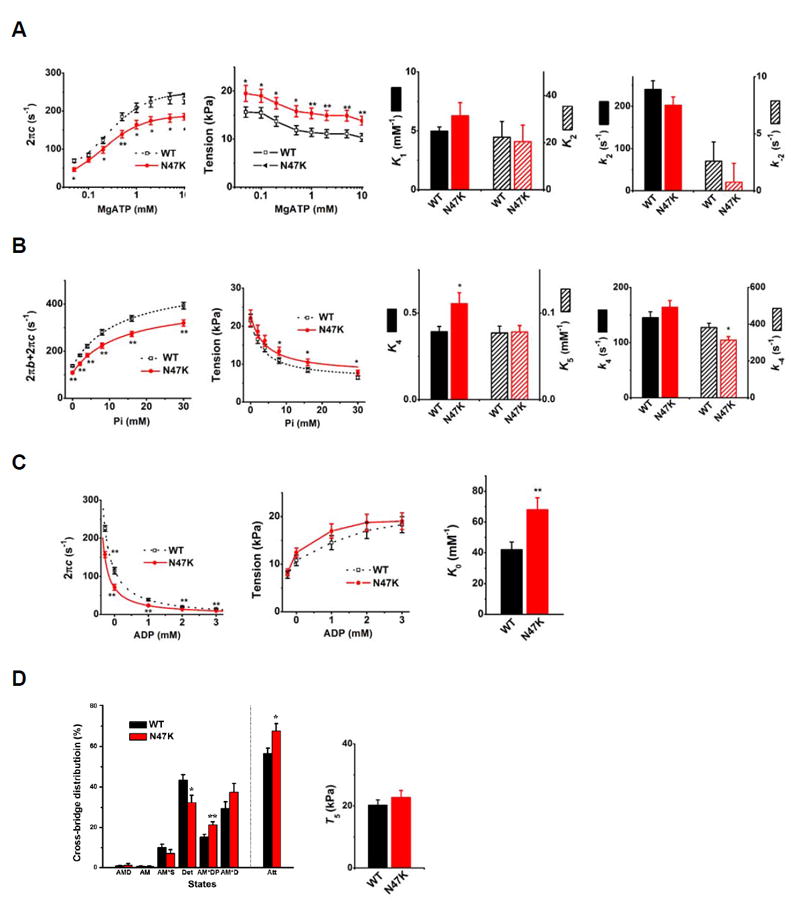
A. The effects of [MgATP]: discrete points are observed data. Smooth curves of 2πc plot are their best fit to Eq. 2, which characterized step 1 (K1) and step 2 (k2, k-2, K2) of Scheme 1. These kinetic constants are plotted in bar graphs (n=31 for WT and n= 24 for N47K). B. The effects of [Pi]: discrete points are observed data. Smooth curves in 2πb+2πc plot are their best fit to Eq. 3, and smooth curves in tension plot are their best fit to Eq. 4. These fittings characterized step 4 (k4, k-4, K4), step 5 (K5), and T5 (tension per cross-bridge) of Scheme 1. These parameters are plotted in bar graphs; n=26 for WT and n=18 for N47K. C. The effect of [MgADP]: discrete points are observed data. Smooth curves of 2πc plot are their best fit to Eq. 2, which characterized step 0 (K0), and plotted in a bar graph; n=20 for WT and n=14 for N47K. D. Cross-bridge distribution among six states (Scheme 1). Cross-bridge distribution was calculated based on equilibrium constants (K1, K2, K4, K5) and at S=5 mM, P=8 mM, and compared for N47K and WT fibers. T5 - the result of data fitting of tension vs. Pi plot shown in B (2nd from left); n=13 experiments with WT and n=8 with N47K were performed. In A-D, values represent the mean ± SEM, *P < 0.05; **P ≤ 0.01; using t-test.
The ATP dependence of 2πc was fitted to Eq. 2, and the kinetic constants surrounding step 1 (K1) and step 2 (k2 and k-2) were deduced. N47K exhibited slightly larger association constant of MgATP binding to myosin (K1) compared with WT, but without statistical significance (P=0.19). No difference was found between N47K and WT for the kinetics of step 2: k2 (forward rate constant of the XB detachment step 2), k-2 (its reversal step), and K2 (its equilibrium constant) (Fig. 3A).
Pi study
In the Pi study, different concentrations of [Pi] at 0, 2, 4, 8, 16, and 30 mM were applied to investigate the effects of RLC mutant on force generation step 4 and Pi-release step 5 to probe the effects of [Pi] on exponential processes B and C, and isometric tension. For these experiments, MgATP was kept at 5mM so that adequate number of XBs are distributed among the AMDP, AM*DP, and AM*D states (Scheme 1). Fig. 3B shows the sum of the two apparent rate constants (2πb+2πc), and tension plotted as functions of [Pi]. These relationships were fitted to hyperbolic Eq. 3. (Eq. 14 in [25]) and Eq. 4 (Eq. 5. in [26]), which were derived based on XB Scheme 1.
| (Eq. 3) |
| (Eq. 4) |
X5 and X6 are the probabilities of XBs in the strongly attached states AM*DP and AM*D, respectively, and T5 is the tension supported by these states that represent tension/XB. k-4 and K5 were first determined by fitting the rate constant data (Fig. 3B) to Eq. 3. Then, based on K5, the tension data were fitted to Eq. 4 to determine K4 and T5 (Fig. 3B): continuous curves represent the best fit to Eqs. 3 and 4. The sum of 2πb and 2πc was significantly smaller in N47K than in WT from 0 to 30P (**P ≤ 0.01) (Fig. 3B). Tension at 8 to 30 mM Pi was slightly higher in N47K compared with WT.
K5 (Pi association constant) was not different between two groups of muscle fibers (Fig.3B), indicating a similar Pi release step from the XBs for N47K and WT fibers. k4 (rate constant of the force generation step) was slightly higher and k-4 (its reversal step) was significantly smaller in N47K compared with WT, which resulted in the significantly larger equilibrium constant (K4=k4/k-4) of this step in N47K compared with WT (*P < 0.05) (Fig. 3B).
ADP study
To determine the association constant (K0) of ADP to myosin, the effect of ADP on process C (Eq. 1) was studied. D was changed in the range of 0-3 mM, while S was kept constant at 2 mM and P at 8 mM. The apparent rate constant 2πc and tension (Fig. 3C) were plotted against [ADP]. As seen in these plots, the rate constant 2πc decreased and the tension increased as [ADP] increased in both groups of muscle fibers. By fitting the data to Eq. 2, K0 was deduced. Here, we used K1, k2, and k-2 derived from the ATP study, and S=2 mM (experimental condition).
N47K exhibited significantly smaller 2πc than that of WT (Fig. 3C). Tension generated at each ADP concentration was slightly larger in N47K without significant difference. During the ADP study, 00D solution (leftmost points in Fig. 3C), which contained 15 mM creatine phosphate (CP) and 160 unit/ml creatine kinase (CK) but no A2P5 or ADP, was first applied to the fibers, followed by the 0D solution, which contained no CP, CK, or ADP, but 0.1 mM A2P5 (Table 2). The purpose of these two solutions was to determine contaminating ADP concentrations (D0) in the 0D-3D solutions. In the 00D solution, the rate constant 2πc was somewhat larger and tension was slightly less than those in the 0D solution, demonstrating that [ADP] in the 0D solution was not negligible. Thereafter, 1D, 2D and 3D solutions were applied sequentially. Extrapolating the 2πc data versus [ADP] (continuous curves in Fig. 3C, left panel) allowed us to determine the contaminating ADP concentration in the 0D-3D solutions: D0 for WT was found to be 0.28±0.03 mM and for N47K, 0.29±0.04 mM. This extra [ADP], which resulted from ATP hydrolysis by muscle fibers and from ADP contamination present in the solution, was taken into consideration when deducing K0, as shown in Eq. 2. N47K showed 1.6x larger K0 than WT and the difference was statistically significant (**P ≤ 0.01) (Fig. 3C).
Table 2.
Composition of solutions used for fiber studies
| Ingredient (mM) | Na- Skinning solution | K- Skinning solution | Storage solution | Relaxing solution | Standard Activating solution | 8Pi pCa solution | 0Pi pCa solution |
|---|---|---|---|---|---|---|---|
| DTT | 2 | 2 | 2 | - | - | - | - |
| BDM | 30 | 30 | 30 | - | - | - | - |
| Glycerol | - | - | 6,000 | - | - | - | - |
| K2CaEGTA | - | - | - | 6 | * | * | |
| K2H2EGTA | 10 | 10 | 10 | 6 | - | 6 | 7 |
| Na2H2ATP | 7 | 7 | 7 | 7 | 6.1 | 6.1 | 2 |
| Na2CP | - | - | - | - | 15 | 15 | 15 |
| K1.5H1.5PO4# | - | - | - | 8 | 8 | 8 | - |
| MgAc2 | 2 | 2 | 2 | 2 | 6.6 | 6.6 | 3 |
| NaAc | 118 | - | - | 41 | 12.8 | 12.8 | - |
| KAc | - | 118 | 118 | 70.5 | 53.5 | 65.5 | 66 |
| KCl | - | - | - | - | 12 | - | - |
| KOH | 10 | 38 | 38 | ~19 | 17.5 | 18.33 | 14 |
| MOPS | 10 | 10 | 10 | 10 | 10 | 10 | 10 |
| CK (U/ml) | - | - | - | - | 160 | 160 | 160 |
To make individual pCa solutions, total [EGTA] was kept constant as indicated, and K2CaEGTA and K2H2EGTA were appropriately mixed to generate desired pCa solution after considering multiple equilibria mainly with Ca, Mg, ATP, EGTA, CP, and phosphate.
Equimolar mixture of K2HPO4 and KH2PO4. pH of all solutions was adjusted to 7.00±0.02 by KOH, except that the Na-skinning solution was adjusted by NaOH. pCa of the standard activating solution was 4.55, and [Mg2+] 1 mM. Ionic strength (IS) of all solutions was 200 mM, except for 0Pi pCa solution (150 mM). Any other activating solutions were variations of the standard activating solution without changing concentrations of K2CaEGTA, Mg2+, Na2CP, KCl, MOPS, or IS. Ac: acetate, Pi: phosphate, CP: creatine phosphate, and CK: creatine kinase.
The tension supported by the AM*DP and AM*D states (T5) is presented in Fig. 3D. AM*DP represents a collision complex between Pi and AM*D; T6 is the tension supported by the AM*D state. We assumed that T5 = T6, because the conformation of a protein cannot change instantly with the formation of collision complex [26]. Previous data from our lab and others are consistent with this assumption [25-28]. T5 was not significantly different between N47K and WT (Fig. 3D), indicating that tension/XB was similar in two groups of muscle fibers.
Cross-bridge distribution
Based on Eqs. 7-13 of [29], the cross-bridge distribution among six states in Scheme 1 was calculated at the standard activating condition and the results are shown in Fig. 3D. This figure also includes the sum of all strongly attached states (labeled as Att). For N47K, we observed more XB distribution in the Att state compared with WT that supports our finding of increased tension in skinned fibers carrying the N47K mutation (Fig. 2B). These data are consistent with an increased duty ratio of N47K vs. WT-RLC myosin, determined previously using in vitro motility assays [15].
pCa study
To characterize the Ca2+ sensitivity (pCa50) and cooperativity (nH) of muscle fibers, we studied the effect of Ca2+ ranging from pCa 7.0 to 4.4, using two sets of solutions. One set contained 8 mM Pi (named 8Pi solutions) and the ionic strength (IS) was 200 mM, and represented the conditions of working cardiomyocytes [30, 31] (Fig. 4A). Another set did not contain Pi (named 0Pi solutions) and ionic strength was 150 mM, and represented conditions which were used by previous investigators [32] (Fig. 4B). The estimated Pi concentration in this set of solutions ranged from 0.15 mM to 0.8 mM [25, 28, 33]. The solution recipes are listed in Table 2. The experiments were performed from low [Ca2+] to high [Ca2+] in every 0.05 log unit where tension changes rapidly, and results were fitted to the three-parameter Hill equation (Eq. 5):
| (Eq. 5) |
where Tmax is the maximum tension developed at saturating [Ca2+] and the same as plotted in Fig. 2B for WT and N47K mutant; Ca50 is the Ca2+ concentration required to attain 50% of Tmax, and nH is the cooperativity among regulatory proteins, which includes troponin, tropomyosin, and possibly actin and myosin. In particular, pCa50= − log10Ca50 is called “Ca2+ sensitivity”.
Figure 4. The Ca2+ dependent regulation of force development and cross-bridge kinetics in N47K vs. WT fibers.
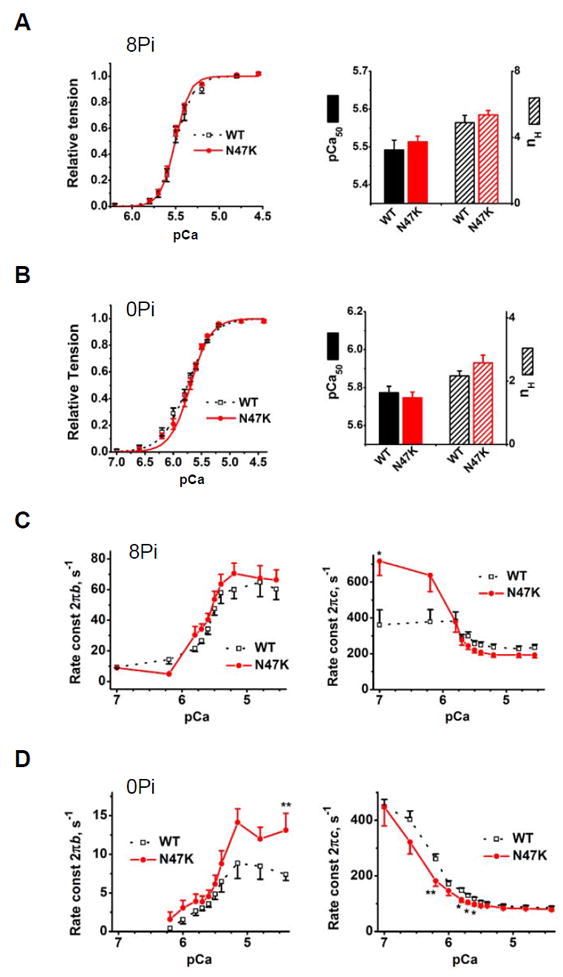
Tension-pCa plots (A, B) and apparent rate constants 2πb and 2πc (C, D) measured during tension-pCa study. Experiments were carried out in the presence of 8 mM Pi and at IS (ionic strength) 200 mM, as in Table 2 (A, C) or in the absence of Pi and at IS 150 mM (B, D). Discrete points are the observed data, and smooth curves in A and B are their best fit to Eq. 5, yielding pCa50 (Ca2+ sensitivity) and nH (cooperativity). In C and D, experimental data points are connected with straight lines. In A and B, n=10 experiments with WT and n=15 with N47K were performed. In C and D, n=17 for WT and n=16 for N47K. In A-D, values represent the mean ± SEM, *P < 0.05; **P ≤ 0.01; using t-test.
In both 8Pi and 0Pi solutions, pCa50 and nH, respectively, were not significantly changed in N47K compared with WT (Fig. 4A, B). The rate constant 2πb increased and 2πc decreased with an increase in [Ca2+] (Fig. 4C, D). In the 8Pi solution, neither 2πb nor 2πc showed much difference between N47K vs. WT, except for the larger 2πc in N47K at pCa 7 and 6.2 (Fig. 4C). In 0Pi solution, 2πb in N47K was close to WT for intermediate calcium concentrations, but became larger than WT at pCa 4.4 (**P ≤0.01) (Fig. 4D). 2πc was smaller in N47K at pCa 6.2-5.6 (*P<0.05), but reached a value close to WT in higher Ca2+ concentrations (pCa≤5.5) (Fig. 4D).
Actomyosin interaction
Actin activated myosin ATPase assay
To measure the effect of the N47K mutation on the ATPase activity, we performed the actin activated myosin ATPase assays by using myosin purified from the hearts of Tg N47K and WT mice (Fig. 5A). The ATPase activity of myosin was performed at 30°C and was determined from a plot of ATPase activity (mole Pi/mole myosin/s) against [F-actin]. The data were averages of n=9 independent experiments for WT and n=8 for N47K (Fig. 5A). The experimental points were fitted to the Michaelis–Menten equation yielding the Vmax (maximal ATPase activity) and Km (Michaelis-Menten constant) parameters.
Figure 5. Actomyosin interaction assessed in solution with mouse heart purified myosin and actin.
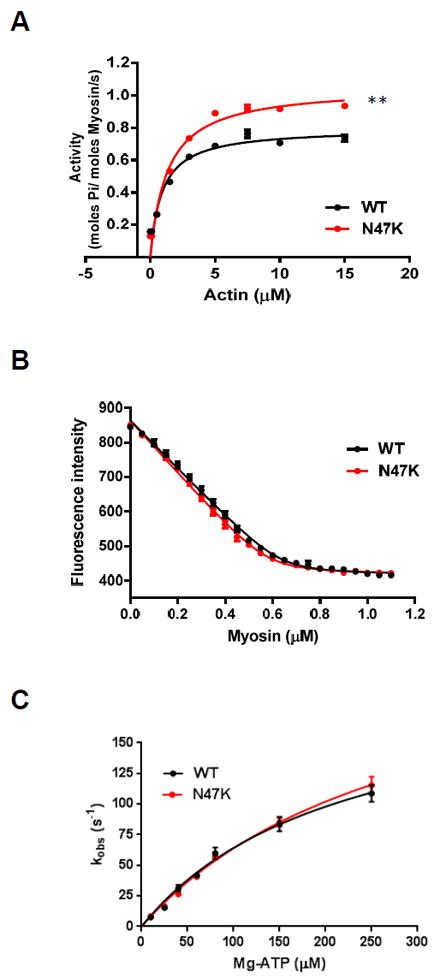
A. Actin activated myosin ATPase assay for N47K vs. WT myosin. The ATPase activity of myosin was performed at 30°C and plotted as a function of increasing F-actin concentrations; n=9 independent experiments for WT, and n=8 for N47K were performed with each sample run in duplicate. B. Rigor binding of Tg mouse myosin to pyrene labeled F-actin; n=4 independent titration curves were performed for N47K and WT myosin preparations. No differences in Kd (dissociation constant) from actin were noted for WT and N47K myosin. C. Stopped-flow measurements of actomyosin dissociation in the presence of ATP. kobs was plotted as a function of [MgATP] and fitted to Eq. 6. k+2, maximal observed rate of cross-bridge dissociation; K1, association constant for ATP binding. The number of experiments performed at each [MgATP] for WT and N47K myosin is shown in Table 3. Note no overall effect of the N47K mutation on the rate of ATP-induced myosin cross-bridge dissociation from actin. In A-C, values represent the mean ± SEM, *P < 0.05; **P ≤ 0.01; using t-test.
The results revealed an increased Vmax for the N47K mutant vs. WT (1.06±0.01 s−1 vs. 0.80±0.01 s−1) and a higher Km (1.30±0.03 μM for N47K vs. 0.94±0.09 μM for WT) (Fig. 5A). The differences between the groups for both Vmax and Km were statistically significant (**P≤0.01 for Vmax and **P≤0.01 for Km). Since Km represents the dissociation constant, the mutant myosin showed a lower affinity for actin. Vmax represents the rate constant of the transition from the weakly (AMDP in Scheme 1) to strongly (AM*D) bound myosin XBs, with phosphate (Pi) release being rate-limiting [34]. The fact that the N47K myosin demonstrated ~33% higher Vmax compared with WT myosin indicates that the turnover rate of the mutant myosin was 1.33-fold faster compared to WT (Fig. 5A).
Rigor binding of Tg mouse myosin to pyrene labeled F-actin
To assess the changes induced by N47K mutation on the binding of myosin to actin, mouse-purified myosin preparations were tested for their interaction with actin under rigor condition (no nucleotide) (Fig. 5B). A decrease in the fluorescence intensity induced by the binding of myosin to pyrene labeled F-actin was measured as a function of increasing myosin concentrations. The experimental points were fitted to a nonlinear binding model as described previously [35], yielding the apparent dissociation constant, Kd=8.8±1.7 nM for WT and Kd=9.0±1.4 nM for N47K (n=4 independent experiments for N47K and WT myosin preparations). The results showed that the binding of myosin to actin under the rigor condition was strong and that the binding isotherms for WT overlapped with N47K, indicating no effect of the mutation on actin-myosin binding in the absence of ATP (Fig. 5B).
Stopped flow measurements
To characterize the kinetics of actin-myosin dissociation, the ATP-induced dissociation rates (kobs) of Tg-N47K vs. Tg-WT myosin from pyrene-labeled F-actin were determined (Fig. 5C). The time course of the change in pyrene fluorescence was measured as a function of MgATP concentration using a stopped flow apparatus. Myosin was mixed with pyrene-F-actin at a ratio of 2 myosin heads per actin monomer, and the complexes were mixed in the 1:1 (vol/vol) ratio with increasing concentrations of MgATP (10–250 μM). As myosin dissociated from pyrene-F-actin in the presence of MgATP, the fluorescence intensity increased and the change was measured as a function of time. Table 3 presents the observed dissociation rate constant (kobs in s-1) for WT and N47K myosin determined for individual MgATP concentrations. Notably, no differences in kobs were observed between Tg-N47K and Tg-WT myosin for any measured [MgATP].
Table 3.
Results from stopped-flow experiments at 21°C. Actomyosin dissociation rate (kobs) is shown with means ± SEM in s-1, and plotted in Fig. 5C.
| System | [MgATP] | ||||||
|---|---|---|---|---|---|---|---|
| 10 μM | 25 μM | 40 μM | 60 μM | 80 μM | 150 μM | 250 μM | |
| WT | 7.56±0.50 (n=7) | 15.37±0.61 (n=7) | 31.28±2.61 (n=9) | 41.84±1.67 (n=11) | 59.79±4.81 (n=10) | 83.64±5.98 (n=11) | 108.75±6.82 (n=14) |
| N47K | 8.49±0.35 (n=6) | 16.41±0.62 (n=7) | 26.47±1.75 (n=9) | 40.65±1.78 (n=9) | 57.32±2.88 (n=14) | 85.15±3.61 (n=18) | 115.33±6.98 (n=14) |
Fig. 5C presents a plot of kobs as a function of [MgATP] fitted to Eq. 6 [36-38] that yielded k+2 (maximal observed rate) of 206±26 s-1 for WT and 253±37 s-1 for N47K. The association constant for ATP binding obtained for WT vs. N47K were: 4.5±1.0 vs. 3.4±0.8 mM-1 (P>0.05), respectively. The results indicated no overall effect of the N47K mutation on the rate of ATP-induced myosin XB dissociation from actin.
Discussion
Here, we report on the physiological effects of the HCM-linked N47K mutation in the human cardiac myosin RLC on the heart function in vivo and in vitro, using Tg mice expressing N47K-RLC compared with age matched WT-RLC controls. Similar to the phenotype observed in humans [12], the hearts of ~12.5 month-old N47K mice showed MVH manifested by a significant enlargement of IVS and increased LV mass compared with age matched WT mice (Fig. 1). Doppler and hemodynamic assessments revealed no significant changes between the groups in the majority of diastolic and systolic indices, but the peak rate of rise in LV pressure-end diastolic volume relationship (dP/dtmax-EDV), depicting ventricular contractility of N47K hearts, was significantly decreased in the mutant compared to WT mice. Changes were seen in the steady-state and kinetics of the actin-myosin interaction (increased ATPase activity), assessed with actin and Tg cardiac myosin (Fig. 5). Mutation-induced changes seen at the molecular level were consistent with the gain of function phenotype in the kinetics of cycling cross-bridges as assessed in skinned papillary muscle fibers.
By applying sinusoidal length perturbations combined with chemical changes to skinned papillary muscle fibers during full Ca2+ activation, the rate and equilibrium constants of five elementary steps (step 0, 1, 2, 4, and 5 in Scheme 1) of the N47K-RLC containing fibers were investigated and compared with WT fibers. Those expressing N47K mutation showed slower rate constant of reversal of the force generation step (k-4) (Fig. 3B), which caused larger equilibrium constant of the force generation step (K4) and resulted in larger tension (Fig. 2B) without changing force/XB (T5). Consequently, we concluded that more XBs were distributed at the strongly attached state in N47K compared with WT fibers (Fig. 3D). Additionally, ADP binding ability (K0, Fig. 3C) was profoundly enhanced in N47K fibers with a slight increase in ATP binding ability (K1, Fig. 3A). Other parameters of XB cycle, including the detachment step 2 and the Pi-release step 5, were not significantly affected by the mutation (Fig. 3AB). Rigor stiffness measured in skinned muscle fibers from N47K vs. WT mice (Fig. 2C) or the strength of action-myosin binding measured with the use of isolated proteins (Fig. 5B) indicated that there was no effect of the mutation on the action-myosin interface or its structural alteration during the rigor interaction between actin and myosin.
The ATP association constant (K1) was 5.0-6.5 mM-1 in fibers (Fig. 3A), which is very similar to the results obtained by pyrene F-actin fluorescence on its interaction with purified cardiac myosin (3.4-4.5 mM-1, Fig. 5C). Similarly, the rate constant of AM dissociation (k2) was 200-230 s-1 in fibers (Fig. 3A), which overlaps with solution values (Fig. 5C, 206-253 s-1). The good agreement from these two vastly different experimental systems on cardiac muscle preparations is impressive, and in accord with what was reported for rabbit psoas muscles [38]. The good agreement between these data demonstrates that process C (hence phase 2 of step analysis) is a manifestation of the ATP binding step and a rapid actomyosin dissociation which ensues the binding [24], and is not a manifestation of the force generation step as proposed previously [39]. Since the difference between N47K and WT was not significant, the ATP binding and actomyosin dissociation steps were not affected by the N47K mutation. The Doppler and Pressure-Volume loops assessments of N47K vs. WT hearts corroborate the findings at the molecular level and show no effect of the N47K mutation on the IVRT (isovolumetric relaxation time) or the relaxation constant, tau (Fig. 1C).
The significantly larger ADP association constant (K0) in N47K compared to WT (Fig.3C) can be seen as a small increase in the AMD state, and small decreases in the AM and AM*S states, but does not cause a serious alteration in the distribution among six XB states, because [ADP] is small and about 0.02 mM, hence K0 [ADP] is small, as evidenced by a little change in the distribution of the AMD and AM states (Fig. 3D). A small increase in the AMS and Det states in N47K was caused by increased K0. On the other hand, the significantly larger K4 in N47K than WT (Fig. 3B) caused significant alterations in the XB distribution: both strongly attached states (AM*DP and AM*D) increased and the detached state decreased (Fig. 3D). Larger K4 was caused by smaller k-4 (K4=k4/k-4). Significant number of XBs distributed at these attached states with unaltered tension per XB (T5 in Fig. 3D) translates to a larger force generation in N47K fibers. The increased XB number in the AM*D state results in the increased ATP hydrolysis rate, which equates to k6[AM*D] [29].
The cause-effect relationship between myofilament Ca2+ sensitivity (pCa50) and cardiomyopathy phenotype has been the center of the debate in the last decade. A paradigm was established that a mutation causing an increase in Ca2+ sensitivity (leftward shift in tension-pCa50 plot) leads to HCM, while a mutation that causes a decrease in pCa50 results in DCM [40, 41]. However, experiments that led to this conclusion were performed in the absence of Pi [32, 42, 43]. The Pi concentration in the working cardiomyocytes is reported to be ~6 mM [30, 31]. In the presence of Pi, the anticipated change in the Ca2+ sensitivity may be absent [44], and exceptions were found to the above generalization [45]. With RLC-N47K mutation, skinned fiber study found no significant changes in the calcium sensitivity of force (pCa50) or cooperativity (nH) in both 8Pi and 0Pi solutions (Fig. 4A, B), which is consistent with the previously published data on mouse papillary fibers [17] and with the data on the RLC-exchanged porcine cardiac preparations comparing N47K vs. WT [13]. These findings indicate that a change in pCa50 does not cause the N47K hearts to hypertrophy nor that HCM is always paralleled by increased myofilament Ca2+ sensitivity.
The effect of [Ca2+] on the XB kinetics has long been a sensitive subject of debate. With sinusoidal analysis, we found that as [Ca2+] is increased, 2πb increases and 2πc decreases (Fig. 4C, D). Consequently, the processes B and C are far apart at low [Ca2+], and they become closer at higher [Ca2+]. Because 2πb represents force generation step 4 [25], it can be concluded that this step is accelerated when [Ca2+] is increased. The fact that 2πc decreases with increased [Ca2+] may suggest that the XB detachment step 2 decreases with [Ca2+] [23, 24]. As observed in Fig. 4C, D, RLC-N47K clearly affects these 2πb and 2πc-pCa relationships indicating that the N47K mutation affects steps 1, 2 and 4 of the XB cycle (Scheme 1).
The characterization of the Tg mouse models, Tg protein expression, histopathology, and functional information on N47K vs. WT hearts have been published previously [14, 17]. N47K is associated with rapidly progressing late onset of mid-ventricular and papillary muscle hypertrophy. The proband was diagnosed with HCM at 60 years of age, and a marked progression in the septal hypertrophy was observed over subsequent two years [12]. Our morphological data on senescent N47K vs. WT mice (Fig. 1, Table 1) are consistent with clinical findings and the late onset of N47K-induced HCM that slowly leads to depressed cardiac function. Interestingly, our earlier experiments demonstrated a correlation between the human phenotype of HCM-related diastolic dysfunction and prolonged force transients assessed in electrically stimulated N47K vs. WT intact papillary muscle fibers [17].
In agreement with our current results of increased tension in skinned muscle fibers carrying RLC-N47K mutation (Fig. 2B), our previous in vitro motility studies showed an increased myosin duty ratio for N47K myosin compared with WT [15]. N47K also appeared to have higher stiffness, which could be explained by a higher fraction of XBs in the attached state (Fig. 3D), suggesting that the shortening velocity would be slower in N47K compared to WT myosin. The latter property of the N47K-mutated XBs have been measured and reported previously [7]. Thus, the current results showing enhanced fiber tension in N47K mice and a moderate decrease in heart contractility in vivo are in accord with our previous results showing a mutation-induced increase in myosin duty ratio and consequent decrease in actin sliding velocity [15] as well as compromised cardiac work and cardiac power in isolated perfused hearts from Tg mice [14]. Interestingly, no significant changes in force production between the genotypes were reported earlier in the fibers from ~3.5 month-old N47K mice, which coincided with the lack of hypertrophy observed in younger N47K mice [17].
Larger force observed in N47K fibers would cause mechanical disruption of the inter-sarcomere and/or inter-myocyte connections to result in Z-line misregistration and myocyte disarray, as suggested for the MHC mutation R403Q [46]. Increased ATPase activity rates may lead to inefficient use of energy from ATP hydrolysis as suggested for another RLC mutation A13T [35]. Increased ATP hydrolysis could also cause an increase in [ADP], which may deteriorate the sarcomere structure. In fact, we did observe that the longevity of fibers was somewhat compromised when performing the ADP study. Any of these changes alone or in combination are expected to result in abnormal cardiac muscle contraction and trigger hypertrophic response in N47K hearts.
In summary, this is the first study that has comprehensively investigated the impact of N47K-RLC mutation on myosin motor function and the kinetics of elementary steps of a myosin cross-bridge cycle in the myocardium of Tg-N47K vs. Tg-WT mice. The findings at the level of myofilaments are complemented by the in vivo characteristic of HCM-N47K hearts and compared with the hemodynamic function of WT hearts. The results from this report combined with the previous research on N47K-RLC give further insights into the mechanism of RLC-mediated HCM. We found that N47K enhances the ATP/ADP binding and the ability of myosin to produce force. Consequently, the myocardium of N47K mice undergoes hypertrophy and the animals demonstrate a late onset of the disease manifested by decompensated inotropic function of the heart. Future therapeutics of N47K positive patients should target the altered function of myosin motor and control its pathological force production ability.
Materials and Methods
This study conforms to the Guide for the Care and Use of Laboratory Animals published by the US National Institutes of Health (NIH Publication no. 85–23, revised 2011). All protocols were approved by the Institutional Animal Care and Use Committee at the University of Miami Miller School of Medicine. The assurance number is #A-3224-01, effective November 23, 2011. Euthanasia of mice was achieved through inhalation of CO2 followed by cervical dislocation.
Tg mouse models with the human ventricular RLC WT and N47K mutant were generated at the University of Miami as previously described [17]. In echocardiography and invasive hemodynamics studies, ~12.5 month old N47K line-1 (L1, expressing 95% of human cardiac N47K-RLC) were compared with ~12.4 month old WT L2 (expressing 100% of human cardiac RLC) mice. In fiber studies, ~8 month old N47K L1 were compared with 4 to 8 month-old WT L2. Myosin-based experiments were performed on myosin isolated from the hearts of 4 to 12 months old N47K L1 and compared with WT L4 mice expressing 40% of transgene.
Echocardiography and invasive hemodynamic assessments
In vivo cardiac morphology and function studies were performed on N47K vs. WT mice of both genders using a Vevo-2100 imaging System equipped with a MS 400 transducer. The mice were anesthetized by inhalation of 1-2% isoflurane and body temperature was maintained at 37°C. M-mode and B-mode images were saved for analysis of cardiac morphology and function with the Vevo Lab 1.7.1 software (Visual Sonics Inc.). End-diastolic and end-systolic endocardial volumes were calculated from the bi-dimensional long-axis parasternal views [32]. Left ventricular diastolic function was analyzed using the values derived from mitral flow inflow velocity curves obtained by pulsed Doppler mode.
For invasive hemodynamics evaluation, mice were anesthetized by intubation with 1-2% isoflurane and body temperature was maintained at 37°C. A 6% albumin solution was infused into the jugular vein at the rate of 5 μl/min. A catheter (SPR-839; Millar Instrument, Houston, TX) transducer was introduced into the left ventricle through the right carotid artery. The pressure-volume (P-V) loops were recorded at steady state and during the inferior vena cava occlusion. The volume was calibrated by echocardiographic measurement of the end-diastolic volume and stroke volume. Diastolic performance was assessed by the measurement of the peak rate of left ventricular relaxation (-dP/dtmin), end-diastolic P-V relationship (EDPVR) and the time constant of ventricular relaxation tau in ms using the Weiss’ method [47]. The contractility was determined by the slope of the end-systolic P-V relationship (ESPVR), and other parameters of systolic function included the preload recruitable power stroke work (PRSW) and the peak rate of rise in LV pressure-end diastolic volume relationship (dP/dtmax-EDV) [32].
Muscle fiber experiments
Muscle fibers were prepared as described previously [32]. Briefly, after euthanasia, the hearts were quickly removed from the mice and rinsed briefly with ice-cold 0.9% NaCl. Papillary muscle strips ~1 mm in diameter and ~2.5 mm in length were dissected from left ventricles in ice-cold pCa 8 solution (10-8 M Ca2+, 1 mM Mg2+, 7 mM EGTA, 2.5 mM MgATP2-, 15 mM creatine phosphate (Na2CP), 20 mM MOPS, ionic strength (IS) adjusted to 150 mM with K propionate, and pH adjusted to 7.0) that contained 30 mM BDM and 15% glycerol. After dissection, the strips were transferred to pCa 8 solution mixed with 50% glycerol (storage solution), and incubated for 1 h on ice. Then the strips were transferred to fresh storage solution mixed with 1% Triton X-100 for 24 h at 4 °C. The strips were finally transferred to a fresh storage solution, kept at −20°C, and shipped to Iowa on ice. The strips were subjected to mechanical studies between 2 days and 5 weeks of the shipment.
On the day of the experiment, fibers about 1 mm in length and 100 μm in diameter were dissected and mounted on the experimental apparatus by attaching their ends to two stainless-steel hooks with a small amount of nail polish. One hook was connected to a length driver, and the other to a tension transducer. Fibers were then soaked for a few minutes in the relaxing solution followed by further skinning for 20 min in the relaxing solution, which contained 1% Triton X-100. Fibers were then washed in the relaxing solution and their length was adjusted to remove the slack. This procedure resulted in sarcomere length of ~2.1 μm as judged by the first order optical diffraction using He–Ne laser of wavelength 0.6328 μm [22].
Each preparation was tested in standard activating solution (Table 2) followed by studies of MgATP (S: 0.05-10 mM), Pi (P: 0-30 mM), and MgADP (D: 0-3 mM), to determine the kinetic constants of the elementary steps based on the six-state cross-bridge model (Scheme 1). The solution compositions used for the MgATP, Pi, and MgADP are listed in Table 1 of [48]. The compositions of the standard activating solution, the 5S solution in the ATP study, and the 8P solution in the Pi study were the same. Hence, the results were averaged to generate the data for the standard activation. After these studies, the standard activation was repeated to determine the reproducibility of tension measurements. Other activating solutions were variations of the standard activating solution by keeping Mg2+, EGTA, CP, NaCl, MOPS, IS, and CK concentrations unchanged. All activating solutions (other than those used for the ADP study) contained 15 mM CP and 160 U/ml CK to maintain the steady MgATP concentration. All fiber experiments were performed at 20°C and at pH 7.00.
Sinusoidal analysis
At the tension plateau, the muscle length was oscillated with digitally synthesized sine waves of 16 frequencies (f) sequentially (0.25–140 Hz) at a small amplitude (0.125% of L0). This frequency range corresponds to 1.1–640 ms in time domain analysis. The amplitude corresponds to 0.7 nm at the cross-bridge level when 50% series compliance is considered with the sarcomere length 2.2 μm. The experiments were controlled by a 386 computer equipped with a 16 bit digital-to-analog converter to control the length driver. Both tension and length time courses were simultaneously digitized with two 16 bit analog-to digital converters and recorded by the same computer. The complex modulus data Y(f) were calculated as the ratio of stress change to strain change at each frequency (f). Y(f) was fitted to Eq. 1 and the parameters (2πb, B, 2πc and C) of two exponential processes B and C were extracted as reported earlier [19, 20].
Actin activated myosin ATPase assay
Myosin was isolated from both ventricles of the hearts, purified and stored in 50% (v/v) glycerol for 2-5 days, as described previously [35]. For actin-activated myosin ATPase activity assays, myosin preparations were precipitated with 13 volumes of ice-cold 2 mM DTT and collected by centrifugation at 8,000g for 10 min. Myosin pellets were then re-suspended in 0.4 M KCl, 10 mM MOPS (pH 7.0), and 1 mM DTT, and dialyzed overnight at 4 °C against the same buffer. Concentrations of myosin preparations were determined using a Coomassie Plus protein assay (Pierce, Rockford, IL, USA). The ATPase assays were performed on 96-well microplates in a 120 μl reaction volume containing 25 mM imidazole (pH 7.0), 4 mM MgCl2, 1 mM EGTA and 1 mM DTT, and 77.7 mM KCl. Myosin at a final concentration of 0.5 μM was titrated with increasing amounts of rabbit skeletal actin (in μM): 0.1, 0.5, 1.5, 3, 5, 7.5, 10 and 15. The reactions were initiated with the addition of 2.5 mM ATP with mixing in a Jitterbug incubator shaker and allowed to proceed for 15 min at 30°C. The reaction was terminated by the addition of 4% ice-cold trichloroacetic acid. Precipitated protein was cleared by centrifugation, and the inorganic phosphate was determined according to the Fiske and Subbarrow method [49]. Data were analyzed using the Michaelis Menten equation, yielding Vmax and Km [50].
Preparation and labeling of skeletal muscle F-actin
Rabbit skeletal muscle actin was prepared according to Pardee and Spudich [51] with modifications. Briefly, rabbit skeletal acetone powder was extracted with a G-actin buffer consisting of 2 mM Tris-HCl (pH 8.0), 0.2 mM Na2ATP, 0.5 mM β-mercaptoethanol, 0.2 mM CaCl2, and 0.0005% NaN3 at a ratio of 20 ml/g for 30 min with stirring on ice. The extract was clarified by centrifugation at 7,000g at 4°C for 1 h. The supernatant was adjusted to a final concentration of 40 mM KCl, 2 mM MgCl2 and 1 mM Na2ATP (pH 8.0). The F-actin was allowed to polymerize for 2 h at 4°C. The KCl concentration was then increased again very slowly to a final concentration of 0.6 M and the solution was stirred slowly on ice for 30 min. This step was necessary to remove possible traces of tropomyosin-troponin. The F-actin was then collected by ultracentrifugation at 160,000g at 4°C for 1.5 h. The supernatant was discarded and the F-actin pellets were re-dissolved in a buffer consisting of 10 mM MOPS (pH 7.0) and 40 mM KCl and stored in small aliquots in liquid nitrogen until used.
For fluorescence-based assays, rabbit skeletal actin was labeled with Pyrene lodoacetamide (PIA) by the method of Cooper et al. [52]. Briefly, 20–40 μM F-actin was incubated at room temperature, in the dark, for 16 hours with a 1.5 molar excess of N-(1-pyrene) iodoacetamide (Invitrogen, Molecular Probes) in a buffer containing 10 mM MOPS (pH 7.0), 1 mM MgCl2 and 40 mM KCl. Then the reaction was quenched with 1 mM DTT and the preparation was centrifuged at 1,000g for 1 h. Labeled F-actin was dialyzed against G-actin buffer: 2 mM Tris-HCl (pH 8.0), 0.2 mM CaCl2, 0.2 mM ATP and 1 mM DTT) to remove excess pyrene and then polymerized overnight to form F-actin. The resulting molar ratio of pyrene/F-actin was 0.6 as determined using the molar extinction coefficient, ɛ344(pyrene)=22,000 M−1cm−1 [35].
Rigor binding of Tg mouse myosins to pyrene labeled F-actin
Pyrene-labelled F-actin at 0.5 μM (stabilized by 0.5 μM phalloidin) was titrated with mouse-purified WT and N47K myosins in 0.05 μM increments until it reached a 1.1-fold molar excess over F-actin concentration (2.2 myosin heads per 1 actin monomer). Fluorescence measurements were carried out by using a JASCO 6500 Spectrofluorometer. PIA was excited at 340 nm and fluorescence was collected at 407 nm. The binding isotherms were fitted to the non-linear binding model as described previously [35].
Stopped-flow kinetic measurements
Purified myosin from WT or N47K mouse ventricles at 0.25 μM was mixed with 0.25 μM pyrene-labeled F-actin (stabilized by 0.25 μM phalloidin) in rigor buffer containing 0.4 M KCl, 1 mM DTT, and 10 mM MOPS (pH 7.0). The complexes were then mixed in a 1:1 ratio (vol/vol) with varying concentrations of MgATP (10–250 μM) dissolved in the same buffer. The dissociation of N47K myosin from F-actin compared with WT myosin was observed by monitoring the time course of the pyrene fluorescence change. Measurements were performed at 21°C using a Bio-Logic (Claix, France) model SFM-20 stopped-flow instrument outfitted with a Berger ball mixer and an FC-8 observation cuvette. The data were collected and digitized using a JASCO 6500 Fluorometer. The estimated dead time was 3.5 ms. The pyrene-F-actin was excited at 347 nm, and emission was monitored at 404 nm using monochromators set to 20-nm bandwidths. Typically, 7–15 stopped-flow (fluorescence) records were averaged and fitted to a single exponential function to obtain the apparent rate constant (kobs) for a given MgATP concentration. kobs (in s-1) was plotted as a function of S and fitted to the hyperbolic equation [36-38]:
| (Eq. 6) |
where K1 is the association constant for ATP to cross-bridges (in M-1), which is the reciprocal of the dissociation constant (1/K1): the amount of ATP required for half-saturation (expressed in M); and k+2 is the maximal observed rate constant at saturating ATP (expressed in s-1), which reflect the cross-bridge detachment [36-38]. Eq. 6 is a special case of Eq. 2 with k2=0, and D+D0=0.
Statistics
Data were expressed as the mean ± SEM. Independent-samples t-test was used to determine the significance of the difference between N47K and WT in vivo, in muscle fibers, and in solution experiments. A significant difference was defined as *P<0.05 and **P ≤ 0.01.
Acknowledgments
This work was supported by the National Institutes of Health [grant numbers HL123255 (DS-C) and HL70041 (MK)] and the American Heart Association [grant numbers 13GRNT16810043 (MK) and 15PRE23020006 (C-CY)].
Abbreviations
- 2πb
apparent rate constant of delayed force (process B) observed in sinusoidal analysis
- 2πc
apparent rate constant of fast force decay (process C) observed in sinusoidal analysis
- A2P5
P1, P5-(Diadenosine-5’)penta phosphate, trilithium salt
- B
magnitude of process B
- C
magnitude of process C
- CK
creatine phosphate
- CP
creatine phosphate
- D
MgADP concentration
- D0
Contaminating MgADP concentration
- E/E’
transmitral early peak velocity (E) to early diastolic mitral annulus velocity (E’) ratio
- EF
ejection fraction
- ELC
myosin essential light chain
- ESPVR
end-systolic pressure-volume relation
- f
frequency of length oscillation
- FS
fractional shortening
- H
elastic modulus at 0 frequency
- HCM
hypertrophic cardiomyopathy
- IS
ionic strength
- IVS
intraventricular septum
- IS
ionic strength
- K0
association constant of MgADP to XBs
- K1
association constant of MgATP to XBs
- K2
equilibrium constant of XB detachment step
- k2
rate constant of the XB detachment step
- k-2
rate constant of reversal of the detachment step
- K4
equilibrium constant of the force generation step
- k4
rate constant of the force generation step
- k-4
rate constant of reverse of the force generation step
- K5
association constant of Pi to XBs
- kobs
observed rate constant of fluorescence increase in stopped flow experiments (similar to 2πc)
- LV
left ventricle
- LVID
LV inner diameter
- LVPW
LV posterior wall
- MHC
myosin heavy chain
- MV E/A
Mitral valve peak E-wave to A-wave velocity ratio
- P
Pi (phosphate) concentration
- PRSW
preload recruitable power stroke work
- RLC
myosin regulatory light chain
- S
MgATP concentration
- Tau
relaxation time
- Tg
transgenic
- WT
wild-type
- XB
cross-bridge
- Y(f)
complex modulus
- Y∞
elastic modulus extrapolated to ∞ frequency (stiffness)
Footnotes
Author Contributions
LW, KK, C-CY, SY, MK and DS-C, planned and performed experiments, and analyzed data; LW, KK, MK and DS-C wrote the paper.
References
- 1.Geeves MA, Holmes KC. The molecular mechanism of muscle contraction. Adv Protein Chem. 2005;71:161–93. doi: 10.1016/S0065-3233(04)71005-0. [DOI] [PubMed] [Google Scholar]
- 2.Rayment I, Rypniewski WR, Schmidt-Base K, Smith R, Tomchick DR, Benning MM, Winkelmann DA, Wesenberg G, Holden HM. Three-dimensional structure of myosin subfragment-1: a molecular motor. Science. 1993;261:50–8. doi: 10.1126/science.8316857. [DOI] [PubMed] [Google Scholar]
- 3.Morano I. Tuning the human heart molecular motors by myosin light chains. J Mol Med. 1999;77:544–55. doi: 10.1007/s001099900031. [DOI] [PubMed] [Google Scholar]
- 4.Szczesna D. Regulatory light chains of striated muscle myosin. Structure, function and malfunction. Curr Drug Targets Cardiovasc Haematol Disord. 2003;3:187–97. doi: 10.2174/1568006033481474. [DOI] [PubMed] [Google Scholar]
- 5.Hernandez OM, Jones M, Guzman G, Szczesna-Cordary D. Myosin essential light chain in health and disease. Am J Physiol Heart Circ Physiol. 2007;292:H1643–1654. doi: 10.1152/ajpheart.00931.2006. [DOI] [PubMed] [Google Scholar]
- 6.Fusi L, Brunello E, Yan Z, Irving M. Thick filament mechano-sensing is a calcium-independent regulatory mechanism in skeletal muscle. Nat Commun. 2016;7:13281. doi: 10.1038/ncomms13281. [DOI] [PMC free article] [PubMed] [Google Scholar]
- 7.Greenberg MJ, Kazmierczak K, Szczesna-Cordary D, Moore JR. Cardiomyopathy-linked myosin regulatory light chain mutations disrupt myosin strain-dependent biochemistry. Proc Natl Acad Sci U S A. 2010;107:17403–8. doi: 10.1073/pnas.1009619107. [DOI] [PMC free article] [PubMed] [Google Scholar]
- 8.Spirito P, Bellone P, Harris KM, Bernabo P, Bruzzi P, Maron BJ. Magnitude of Left Ventricular Hypertrophy and Risk of Sudden Death in Hypertrophic Cardiomyopathy. N Engl J Med. 2000;342:1778–1785. doi: 10.1056/NEJM200006153422403. [DOI] [PubMed] [Google Scholar]
- 9.Maron BJ, Maron MS, Semsarian C. Genetics of hypertrophic cardiomyopathy after 20 years: clinical perspectives. J Am Coll Cardiol. 2012;60:705–15. doi: 10.1016/j.jacc.2012.02.068. [DOI] [PubMed] [Google Scholar]
- 10.Alfares AA, Kelly MA, McDermott G, Funke BH, Lebo MS, Baxter SB, Shen J, McLaughlin HM, Clark EH, Babb LJ, Cox SW, DePalma SR, Ho CY, Seidman JG, Seidman CE, Rehm HL. Results of clinical genetic testing of 2,912 probands with hypertrophic cardiomyopathy: expanded panels offer limited additional sensitivity. Genet Med. 2015;17:880–8. doi: 10.1038/gim.2014.205. [DOI] [PubMed] [Google Scholar]
- 11.Alvarez-Acosta L, Mazzanti A, Fernández X, Ortí M, Barriales-Villa R, García D, Maneiro E, Rebolo P, Álvarez E, Monserrat L. Regulatory Light Chain (MYL2) Mutations in Familial Hypertrophic Cardiomyopathy. JCVD. 2014;2:82–90. [Google Scholar]
- 12.Andersen PS, Havndrup O, Bundgaard H, Moolman-Smook JC, Larsen LA, Mogensen J, Brink PA, Børglum AD, Corfield VA, Kjeldsen K, Vuust J, Christiansen M. Myosin light chain mutations in familial hypertrophic cardiomyopathy: phenotypic presentation and frequency in Danish and South African populations. J Med Genet. 2001;38:e43. doi: 10.1136/jmg.38.12.e43. [DOI] [PMC free article] [PubMed] [Google Scholar]
- 13.Szczesna-Cordary D, Guzman G, Ng SS, Zhao J. Familial hypertrophic cardiomyopathy-linked alterations in Ca2+ binding of human cardiac myosin regulatory light chain affect cardiac muscle contraction. J Biol Chem. 2004;279:3535–42. doi: 10.1074/jbc.M307092200. [DOI] [PubMed] [Google Scholar]
- 14.Abraham TP, Jones M, Kazmierczak K, Liang H-Y, Pinheiro AC, Wagg CS, Lopaschuk GD, Szczesna-Cordary D. Diastolic dysfunction in familial hypertrophic cardiomyopathy transgenic model mice. Cardiovasc Res. 2009;82:84–92. doi: 10.1093/cvr/cvp016. [DOI] [PMC free article] [PubMed] [Google Scholar]
- 15.Greenberg MJ, Watt JD, Jones M, Kazmierczak K, Szczesna-Cordary D, Moore JR. Regulatory light chain mutations associated with cardiomyopathy affect myosin mechanics and kinetics. J Mol Cell Cardiol. 2009;46:108–115. doi: 10.1016/j.yjmcc.2008.09.126. [DOI] [PMC free article] [PubMed] [Google Scholar]
- 16.Karabina A, Kazmierczak K, Szczesna-Cordary D, Moore JR. Myosin regulatory light chain phosphorylation enhances cardiac beta-myosin in vitro motility under load. Arch Biochem Biophys. 2015;580:14–21. doi: 10.1016/j.abb.2015.06.014. [DOI] [PMC free article] [PubMed] [Google Scholar]
- 17.Wang Y, Xu Y, Kerrick WGL, Wang Y, Guzman G, Diaz-Perez Z, Szczesna-Cordary D. Prolonged Ca2+ and force transients in myosin RLC transgenic mouse fibers expressing malignant and benign FHC mutations. J Mol Biol. 2006;361:286–299. doi: 10.1016/j.jmb.2006.06.018. [DOI] [PubMed] [Google Scholar]
- 18.Kawai M, Candau R. In: Muscle contraction and supplying ATP to muscle cells in Handbook of Exercise Physiology - From a cellular to an integrative approach. Connes OH, Perrey S, editors. IOS Press; Amsterdam: 2010. pp. 3–25. [Google Scholar]
- 19.Kawai M, Brandt PW. Sinusoidal analysis: a high resolution method for correlating biochemical reactions with physiological processes in activated skeletal muscles of rabbit, frog and crayfish. J Muscle Res Cell Motil. 1980;1:279–303. doi: 10.1007/BF00711932. [DOI] [PubMed] [Google Scholar]
- 20.Wannenburg T, Heijne GH, Geerdink JH, Van-Den-Dool HW, Janssen PM, DeTombe PP. Cross-bridge kinetics in rat myocardium: effect of sarcomere length and calcium activation. Am J Physiol. 2000;279:H779–H790. doi: 10.1152/ajpheart.2000.279.2.H779. [DOI] [PubMed] [Google Scholar]
- 21.Wang L, Muthu P, Szczesna-Cordary D, Kawai M. Diversity and similarity of motor function and cross-bridge kinetics in papillary muscles of transgenic mice carrying myosin regulatory light chain mutations D166V and R58Q. J Mol Cell Cardiol. 2013;62:153–63. doi: 10.1016/j.yjmcc.2013.05.012. [DOI] [PMC free article] [PubMed] [Google Scholar]
- 22.Wang L, Muthu P, Szczesna-Cordary D, Kawai M. Characterizations of myosin essential light chain’s N-terminal truncation mutant Delta43 in transgenic mouse papillary muscles by using tension transients in response to sinusoidal length alterations. J Muscle Res Cell Motil. 2013;34:93–105. doi: 10.1007/s10974-013-9337-x. [DOI] [PMC free article] [PubMed] [Google Scholar]
- 23.Kawai M, Halvorson HR. Role of MgATP and MgADP in the cross-bridge kinetics in chemically skinned rabbit psoas fibers. Study of a fast exponential process (C) Biophys J. 1989;55:595–603. doi: 10.1016/S0006-3495(89)82857-7. [DOI] [PMC free article] [PubMed] [Google Scholar]
- 24.Kawai M. Head rotation or dissociation? A study of exponential rate processes in chemically skinned rabbit muscle fibers when MgATP concentration is changed. Biophys J. 1978;22:97–103. doi: 10.1016/S0006-3495(78)85473-3. [DOI] [PMC free article] [PubMed] [Google Scholar]
- 25.Kawai M, Halvorson HR. Two step mechanism of phosphate release and the mechanism of force generation in chemically skinned fibers of rabbit psoas muscle. Biophys J. 1991;59:329–42. doi: 10.1016/S0006-3495(91)82227-5. [DOI] [PMC free article] [PubMed] [Google Scholar]
- 26.Kawai M, Zhao Y. Cross-bridge scheme and force per cross-bridge state in skinned rabbit psoas muscle fibers. Biophys J. 1993;65:638–51. doi: 10.1016/S0006-3495(93)81109-3. [DOI] [PMC free article] [PubMed] [Google Scholar]
- 27.Fortune NS, Geeves MA, Ranatunga KW. Tension responses to rapid pressure release in glycerinated rabbit muscle fibers. Proc Natl Acad Sci U S A. 1991;88:7323–7. doi: 10.1073/pnas.88.16.7323. [DOI] [PMC free article] [PubMed] [Google Scholar]
- 28.Dantzig JA, Goldman YE, Millar NC, Lacktis J, Homsher E. Reversal of the cross-bridge force-generating transition by photogeneration of phosphate in rabbit psoas muscle fibres. J Physiol. 1992;451:247–78. doi: 10.1113/jphysiol.1992.sp019163. [DOI] [PMC free article] [PubMed] [Google Scholar]
- 29.Zhao Y, Kawai M. Kinetic and thermodynamic studies of the cross-bridge cycle in rabbit psoas muscle fibers. Biophys J. 1994;67:1655–68. doi: 10.1016/S0006-3495(94)80638-1. [DOI] [PMC free article] [PubMed] [Google Scholar]
- 30.Opie LH, Mansford KR, Owen P. Effects of increased heart work on glycolysis and adenine nucleotides in the perfused heart of normal and diabetic rats. Biochem J. 1971;124:475–90. doi: 10.1042/bj1240475. [DOI] [PMC free article] [PubMed] [Google Scholar]
- 31.Weiner MW, Hetherington H, Hubesch B, Karczmar G, Massie B, Maudsley A, Meyerhoff DJ, Sappey-Marinier D, Schaefer S, Twieg DB, et al. Clinical magnetic resonance spectroscopy of brain, heart, liver, kidney, and cancer. A quantitative approach. NMR Biomed. 1989;2:290–7. doi: 10.1002/nbm.1940020519. [DOI] [PubMed] [Google Scholar]
- 32.Yuan CC, Muthu P, Kazmierczak K, Liang J, Huang W, Irving TC, Kanashiro-Takeuchi RM, Hare JM, Szczesna-Cordary D. Constitutive phosphorylation of cardiac myosin regulatory light chain prevents development of hypertrophic cardiomyopathy in mice. Proc Natl Acad Sci U S A. 2015;112:E4138–46. doi: 10.1073/pnas.1505819112. [DOI] [PMC free article] [PubMed] [Google Scholar]
- 33.Tesi C, Colomo F, Nencini S, Piroddi N, Poggesi C. The effect of inorganic phosphate on force generation in single myofibrils from rabbit skeletal muscle. Biophys J. 2000;78:3081–92. doi: 10.1016/S0006-3495(00)76845-7. [DOI] [PMC free article] [PubMed] [Google Scholar]
- 34.Taylor EW. Mechanism of actomyosin ATPase and the problem of muscle contraction. CRC Crit Rev Biochem. 1979;6:103–114. doi: 10.3109/10409237909102562. [DOI] [PubMed] [Google Scholar]
- 35.Kazmierczak K, Muthu P, Huang W, Jones M, Wang Y, Szczesna-Cordary D. Myosin Regulatory Light Chain Mutation Found In Hypertrophic Cardiomyopathy Patients Increases Isometric Force Production in Transgenic Mice. Biochem J. 2012;442:95–103. doi: 10.1042/BJ20111145. [DOI] [PMC free article] [PubMed] [Google Scholar]
- 36.Coluccio LM, Geeves MA. Transient kinetic analysis of the 130-kDa myosin I (MYR-1 gene product) from rat liver. A myosin I designed for maintenance of tension? J Biol Chem. 1999;274:21575–80. doi: 10.1074/jbc.274.31.21575. [DOI] [PubMed] [Google Scholar]
- 37.De La Cruz EM, Ostap EM. Kinetic and equilibrium analysis of the myosin ATPase. Methods Enzymol. 2009;455:157–92. doi: 10.1016/S0076-6879(08)04206-7. [DOI] [PMC free article] [PubMed] [Google Scholar]
- 38.Candau R, Kawai M. Correlation between cross-bridge kinetics obtained from Trp fluorescence of myofibril suspensions and mechanical studies of single muscle fibers in rabbit psoas. J Muscle Res Cell Motil. 2011;32:315–26. doi: 10.1007/s10974-011-9264-7. [DOI] [PubMed] [Google Scholar]
- 39.Huxley AF, Simmons RM. Proposed mechanism of force generation in striated muscle. Nature. 1971;233:533–538. doi: 10.1038/233533a0. [DOI] [PubMed] [Google Scholar]
- 40.Marston SB. Why Is there a Limit to the Changes in Myofilament Ca2+-Sensitivity Associated with Myopathy Causing Mutations? Front Physiol. 2016;7:415. doi: 10.3389/fphys.2016.00415. [DOI] [PMC free article] [PubMed] [Google Scholar]
- 41.Robinson P, Griffiths PJ, Watkins H, Redwood CS. Dilated and hypertrophic cardiomyopathy mutations in troponin and alpha-tropomyosin have opposing effects on the calcium affinity of cardiac thin filaments. Circ Res. 2007;101:1266–73. doi: 10.1161/CIRCRESAHA.107.156380. [DOI] [PubMed] [Google Scholar]
- 42.Song W, Dyer E, Stuckey DJ, Copeland O, Leung MC, Bayliss C, Messer A, Wilkinson R, Tremoleda JL, Schneider MD, Harding SE, Redwood CS, Clarke K, Nowak K, Monserrat L, Wells D, Marston SB. Molecular mechanism of the E99K mutation in cardiac actin (ACTC Gene) that causes apical hypertrophy in man and mouse. J Biol Chem. 2011;286:27582–93. doi: 10.1074/jbc.M111.252320. [DOI] [PMC free article] [PubMed] [Google Scholar]
- 43.Wolska BM, Keller RS, Evans CC, Palmiter KA, Phillips RM, Muthuchamy M, Oehlenschlager J, Wieczorek DF, de Tombe PP, Solaro RJ. Correlation between myofilament response to Ca2+ and altered dynamics of contraction and relaxation in transgenic cardiac cells that express beta-tropomyosin. Circ Res. 1999;84:745–51. doi: 10.1161/01.res.84.7.745. [DOI] [PubMed] [Google Scholar]
- 44.Bai F, Wang L, Kawai M. A study of tropomyosin’s role in cardiac function and disease using thin-filament reconstituted myocardium. J Muscle Res Cell Motil. 2013;34:295–310. doi: 10.1007/s10974-013-9343-z. [DOI] [PMC free article] [PubMed] [Google Scholar]
- 45.Debold EP, Saber W, Cheema Y, Bookwalter CS, Trybus KM, Warshaw DM, Vanburen P. Human actin mutations associated with hypertrophic and dilated cardiomyopathies demonstrate distinct thin filament regulatory properties in vitro. J Mol Cell Cardiol. 2010;48:286–92. doi: 10.1016/j.yjmcc.2009.09.014. [DOI] [PMC free article] [PubMed] [Google Scholar]
- 46.Palmer BM, Wang Y, Teekakirikul P, Hinson JT, Fatkin D, Strouse S, Vanburen P, Seidman CE, Seidman JG, Maughan DW. Myofilament mechanical performance is enhanced by R403Q myosin in mouse myocardium independent of sex. Am J Physiol Heart Circ Physiol. 2008;294:H1939–47. doi: 10.1152/ajpheart.00644.2007. [DOI] [PubMed] [Google Scholar]
- 47.Weiss JL, Frederiksen JW, Weisfeldt ML. Hemodynamic determinants of the time-course of fall in canine left ventricular pressure. Journal of Clinical Investigation. 1976;58:751–760. doi: 10.1172/JCI108522. [DOI] [PMC free article] [PubMed] [Google Scholar]
- 48.Wang L, Bahadir A, Kawai M. High ionic strength depresses muscle contractility by decreasing both force per cross-bridge and the number of strongly attached cross-bridges. J Muscle Res Cell Motil. 2015;36:227–41. doi: 10.1007/s10974-015-9412-6. [DOI] [PMC free article] [PubMed] [Google Scholar]
- 49.Fiske CH, Subbarow Y. The colorimetric determination of phosphorus. J Biol Chem. 1925;66:375–400. [Google Scholar]
- 50.Hanson KR, Ling R, Havir E. A computer program for fitting data to the Michaelis-Menten equation. Biochem Biophys Res Commun. 1967;29:194–197. doi: 10.1016/0006-291x(67)90586-4. [DOI] [PubMed] [Google Scholar]
- 51.Pardee JD, Spudich JA. Purification of muscle actin. Methods Enzymol. 1982;85(Pt B):164–81. doi: 10.1016/0076-6879(82)85020-9. [DOI] [PubMed] [Google Scholar]
- 52.Cooper A, Walker SB, Pollard TD. Pyrene actin: documentation of the validity of a sensitive assay for actin polymerization. J Muscle Res Cell Mot. 1983;4:253–262. doi: 10.1007/BF00712034. [DOI] [PubMed] [Google Scholar]