

Abstract
Aims
Seven-year surveillance study (2005–2011) to evaluate race/ethnic differences in the trends in rates of severe hypoglycemia (SH) in a population of insured, at-risk adults with diabetes.
Methods
SH events were identified via any primary or principal diagnosis from emergency department or inpatient encounters among African American, Asian, Latino and White adult diabetes patients treated with insulin or secretagogues (Sulfonylureas or Meglitinides), receiving care from integrated healthcare delivery systems across the United States. We calculated age- and sex-standardized annual SH rates and average annual percent change (AAPC) in SH rates.
Results
Annual SH rates ranged from 1.8% to 2.1% during this 7-year observation period (2,200,471 person-years). African Americans had consistently higher SH rates compared with Whites, while Latinos and Asians had consistently lower rates compared with Whites in each of the 7 years (all p<0.01). The trend increased significantly only among African Americans (AAPC = +4.3%; 95% CI: +2.1, +6.5%); in the other groups, the AAPC was not significantly different from zero.
Conclusions
Surveillance efforts should monitor the racial/ethnic-specific rates. The factors underlying substantially higher rates of hypoglycemia in African Americans should be evaluated. Clinically and culturally-appropriate strategies to reduce the risk of SH need to be developed and tested.
Keywords: hypoglycemia, racial differences, complications, insulin, sulfonylureas, insulin secretagogues
1. INTRODUCTION
1.1
There is a growing public health concern regarding the occurrence of severe hypoglycemia (SH) among diabetes patients, particularly those treated with insulin or secretagogues that stimulate endogenous insulin production.(Lipska, 2014) Severe hypoglycemia (SH) is a well-recognized adverse effect of glucose-lowering therapy. SH is associated with a tripling of the risk of mortality(Bonds et al., 2010; McCoy et al., 2012; Zoungas et al., 2010) and substantial increases in risk of dementia(Whitmer, Karter, Yaffe, Quesenberry, & Selby, 2009), stroke(Yu, Lin, Chang, Sung, & Kao, 2014), falls(Schwartz et al., 2008), fall-related fractures(Johnston, Conner, Aagren, Ruiz, & Bouchard, 2012), motor vehicle accidents(Signorovitch et al., 2012), and cardiovascular events,(Goto, Arah, Goto, Terauchi, & Noda, 2013), poorer quality of life(Laiteerapong et al., 2011) and emotional challenges.(Trief, Sandberg, Dimmock, Forken, & Weinstock, 2013) Recent randomized controlled trials have reported average annual SH rates of 0.3 to 1.0 events per 100 person-years,(Gerstein et al., 2008b; Patel et al., 2008a) which is considerably lower than rates of clinically recognized SH observed in real-world, usual care settings(Lipska et al., 2013) and national surveillance.(Prevention, 2014) We previously reported rates of SH among patients receiving care in integrated health care delivery systems ranging from 1.4 to 1.6 events per 100 person-years.(Pathak et al., 2015)
1.2
Prior studies have documented racial/ethnic disparities in the quality of diabetes care and outcomes, but less is known about racial/ethnic differences in rates of SH. National surveillance of hypoglycemic events recorded in the emergency department (ED) have recorded recent trends in hypoglycemia nationwide, however lacked data on race/ethnicity, as well as type of diabetes and medication use.(Prevention, 2014) Racial/ethnic minorities with diabetes are less likely to achieve recommended glycemic targets(Ali, McKeever Bullard, Imperatore, Barker, & Gregg, 2012; Kirk et al., 2006) and more likely to experience long-term diabetic complications(Karter et al., 2002; Wang et al., 2012) compared with whites with diabetes. Prior studies were not specifically designed to examine racial/ethnic differences in SH rates, but several reported higher risk of hypoglycemia in minority populations compared with white patients.(Ginde, Espinola, & Camargo, 2008; Lipska et al., 2014; Shen & Washington, 2008; Shorr, Ray, Daugherty, & Griffin, 1997) Racial/ethnic health inequalities in population-based studies are likely in part attributable to differential access to care. No recent epidemiologic study has comprehensively characterized racial/ethnic differences in the rates and trends of SH from emergency department or inpatient encounters in a diabetes population with uniform access to care.
1.3
Centers for Disease Control and Prevention conducts national surveillance on hypoglycemia events using the National Emergency Department Sample (NEDS)(Prevention, 2014), however limitations in the source data preclude evaluations by race/ethnicity. We conducted 7-year surveillance study (2005–2011) to evaluate differences in trends of hypoglycemia among insured, at-risk adults with diabetes. These included African American, Asian, Latino and White diabetes patients treated with insulin or secretagogues (Sulfonylureas or Meglitinides), age 18 years and older, receiving care from integrated health care delivery systems participating in the multi-institutional SUPREME-DM network across the United States (2,200,471 person-years).
1.4
We examined temporal trends in the annual SH rates during 2005 – 2011 by race/ethnicity using data from the SUrveillance, PREvention, and ManagEment of Diabetes Mellitus (SUPREME-DM) network(Nichols et al., 2012), a multi-institutional, observational cohort including almost a million adults with diabetes receiving care from integrated health care delivery systems across the US.(Orandi et al., 2016) This study was approved by the Kaiser Permanente Colorado (KPCO) Institutional Review Board (IRB) and each participating site’s IRB either ceded oversight to the KPCO IRB or gave its approval.
2. MATERIAL AND METHODS
2.1 Study Setting and Data Sources
SUPREME-DM is a consortium of 11 integrated, healthcare systems: Geisinger Health System (Pennsylvania), Group Health (Washington), HealthPartners (Minnesota), Henry Ford Health System (Michigan), Marshfield Clinic (Wisconsin), and Kaiser Permanente regions in Colorado, Northern California, Southern California, Hawaii, Georgia, Oregon and Washington state. Research institutions embedded in these organizations developed a distributed virtual data warehouse that incorporates patient information from electronic medical records (EMR) and includes demographics, pharmacy dispensing and claims, laboratory tests results, and diagnostic codes from emergency department, outpatient and inpatient care encounters.(Hornbrook et al., 2005) Members in these healthcare systems receive insurance primarily through group plans, or Medicare, Medicaid or other publicly-supported programs. These data were used to construct the SUPREME-DM DataLink, the largest clinically-detailed, private-sector diabetes population in the US.(Nichols, et al., 2012) The SUPREME-DM methods have been detailed previously.(Basu, Rehkopf, Siddiqi, Glymour, & Kawachi, 2016; Nichols, et al., 2012; Orandi, et al., 2016)
2.2 Study Population
Using the SUPREME-DM cohort, we examined annual SH rates among African American, Asian, Latino and white adult health plan members ≥18 years of age with diabetes mellitus dispensed either insulin or secretagogues (Sulfonylureas or Meglitinides) during a 7-year study observation period: 2005 – 2011. We utilized a retrospective panel study design (series of cross-sectional assessments) to calculate annual SH rates for each year of observation. Eligibility among members enrolled in the health plan was determined for each calendar year separately based on the following criteria: diagnosed with diabetes in a prior year and dispensed any insulin or secretagogues in that calendar year.
2.3 Study Exposures
Self-reported race/ethnicity (African American, Asian, Latino or white) was obtained from the SUPREME-DM DataLink. Subjects reporting Latino ethnicity were categorized as Latino and the other racial/ethnic categories (African American, Asian and whites) were categorized as non-Latino. Approximately 14% of the individuals in the sample were of unknown race/ethnicity and were excluded from the race-stratified analysis; 3.5% of the sample were of mixed or other racial/ethnic categories and were also excluded as there were insufficient numbers to support stable annual SH rates over time.
2.4 Outcomes
SH events were identified via any primary or principal diagnosis from an ED or inpatient encounter using a validated coding algorithm with estimated positive predictive value of 89%.(Ginde, Blanc, Lieberman, & Camargo, 2008)
2.5 Analyses
Annual SH rates were calculated separately for each calendar year using the eligible population for that year as the denominator and the number of patients experiencing at least one SH event in that same calendar year as the numerator. Event rates were standardized to the age and sex distribution of the 2010 United States Census. We specified log-linear models to estimate average annual percent change (AAPC) by race/ethnicity to quantify the rate of change and identify those trends which differed significantly from zero.(Kim, Fay, Feuer, & Midthune, 2000) Analyses were conducted using SAS version 9.2 (SAS Institute Inc., Cary, NC) and Joinpoint Regression Program version 4.1.0.(Fenwick et al., 2016)
3. RESULTS
3.1
The denominator was based on the number of eligible patients with diabetes treated with insulin or secretagogues varied over the course of the 7-year study: 275,201 patients in 2005; 290,887 in 2006; 307,150 in 2007; 314,724 in 2008; 324,090 in 2009; 336,833 in 2010; and 351,586 in 2011 (a total of 2,200,471 person-years). The demographic distributions remained relatively stable over time and so, for simplicity, we report the characteristics of subjects only in the final year of observation (2011) (Table 1). Mean age of the sample was 61.4 years (SD=13.7) and more than half were over age 60. There were roughly similar numbers of men and women, and minorities (i.e., Latinos, African Americans and Asians) comprised approximately half the cohort.
Table 1.
Characteristics of the Health Plan members with diabetes treated with insulin or sulfonylureas or Meglitinides, the SUPREME-DM DataLink, 2011.
| Number of individuals, N (%) | |||||
|---|---|---|---|---|---|
| Full sample* | African American | Asian | Latino | White | |
| 44,580 (12.3) | 43,792 (12) | 91,219 (25.1) | 171,995 (47.3) | ||
| Age group, years | |||||
| 18–29 | 6,409 (1.8) | 754 (1.7) | 454 (1) | 1,846 (2) | 3,355 (2) |
| 30–44 | 31,404 (8.9) | 4,109 (9.2) | 3,903 (8.9) | 12,405 (13.6) | 10,987 (6.4) |
| 45–59 | 112,562 (32) | 15,240 (34.2) | 15,114 (34.5) | 35,027 (38.4) | 47,181 (27.4) |
| 60–74 | 138,704 (39.5) | 17,753 (39.8) | 17,644 (40.3) | 30,809 (33.8) | 72,498 (42.2) |
| 75+ | 62,507 (17.8) | 6,724 (15.1) | 6,677 (15.3) | 11,132 (12.2) | 37,974 (22.1) |
| Sex | |||||
| Women | 166,030 (47.2) | 23,816 (53.4) | 20,352 (46.5) | 44,406 (48.7) | 77,456 (45) |
| Men | 185,556 (52.8) | 20,764 (46.6) | 23,440 (53.5) | 46,813 (51.3) | 94,539 (55) |
| Drug treatment: | |||||
| Secretagogues only (Sulfonylurea or Metaglitinides) | 189,540 (53.9) | 22,500 (50.5) | 29,332 (67) | 51,755 (56.7) | 85,953 (50) |
| Insulin only | 99,281 (28.2) | 14,290 (32.1) | 7,646 (17.5) | 21,638 (23.7) | 55,707 (32.4) |
| Both secretagogues and insulin | 62,765 (17.9) | 7,790 (17.5) | 6,814 (15.6) | 17,826 (19.5) | 30,335 (17.6) |
We excluded the 3.4% (n=12,292) that were classified as “other” race
3.2
The overall, age- and sex-standardized annual SH rates ranged from 1.8% to 2.1% for the total population during this 7-year observation period. There were significant racial/ethnic differences in annual SH rates (Table 2). African Americans had consistently higher rates compared with whites, while Latinos and Asians had consistently lower rates compared with whites in each year of observation (Figure). As an example, the annual SH rates among African Americans in 2011 was 66% (1.3 percentage points) higher than the rate among Whites (3.26% vs. 1.96%; p<0.0001), while SH rates among Latinos (1.66%) and Asians (1.01%) were 0.3 and 0.9 percentage points lower than among whites (both differences p<0.0001)
Table 2.
Trends (2005–2011) in severe hypoglycemia (SH) diagnosed during emergency department (ED) or inpatient encounters among African Americans, Asians, Latinos and white individuals with diabetes treated with insulin or secretagogues (sulfonylureas or meglitinides) who were members in eleven U.S. healthcare systems (the SUPREME-DM DataLink).
| African American | Asian | Latino | White | |
|---|---|---|---|---|
| 2005 | ||||
| Patients experiencing SH | 859 | 274 | 956 | 2,510 |
| At risk population | 38,322 | 30,726 | 64,199 | 141,954 |
| Standardized SH rate* (95% CI) | 2.7% (2.2−3.1%) |
0.7% (0.5−0.9%) |
1.7% (1.4−1.9%) |
2.0% (1.8−2.1%) |
| Absolute difference (ref: White) | +0.7%† | −1.2%† | −0.3% † | ref |
| 2006 | ||||
| Patients experiencing SH | 1,013 | 393 | 1,220 | 2,839 |
| At risk population | 39,746 | 32,940 | 69,863 | 148,338 |
| Standardized SH rate* (95% CI) | 2.5% (2.1−2.8%) |
1.0% (0.7−1.3%) |
1.7% (1.5−1.9%) |
2.2% (2.0−2.4%) |
| Absolute difference (ref: White) | +0.3% (ns) | −1.2% † | −0.5% † | ref |
| 2007 | ||||
| Patients experiencing SH | 1,108 | 466 | 1,255 | 2,997 |
| At risk population | 41,035 | 35,820 | 75,550 | 154,745 |
| Standardized SH rate* (95% CI) | 2.8% (2.4−3.2%) |
1.1% (0.8−1.4%) |
1.8% (1.6−2.0%) |
2.2% (2.0−2.4%) |
| Absolute difference (ref: White) | +0.6%† | −1.1% † | −0.4%† | ref |
| 2008 | ||||
| Patients experiencing SH | 1,188 | 457 | 1,501 | 3,108 |
| At risk population | 41,579 | 37,335 | 79,011 | 156,802 |
| Standardized SH rate* (95% CI) | 2.8% (2.4−3.2%) |
0.9% (07−1.1%) |
1.9% (1.7−2.1%) |
2.2% (2.0−2.4%) |
| Absolute difference (ref: White) | +0.6%† | −1.3%† | −0.3%† | ref |
| 2009 | ||||
| Patients experiencing SH | 1,167 | 501 | 1,524 | 3,201 |
| At risk population | 42,319 | 39,321 | 82,227 | 160,223 |
| Standardized SH rate* (95% CI) | 2.8% (2.5−3.2%) |
1.3% (0.9−1.7%) |
1.9% (1.7−2.1%) |
2.3% (2.1−2.4%) |
| Absolute difference (ref: White) | +0.6%† | −0.9%† | −0.3%† | ref |
| 2010 | ||||
| Patients experiencing SH | 1,259 | 518 | 1,536 | 3,228 |
| At risk population | 43,530 | 41,253 | 86,018 | 166,032 |
| Standardized SH rate* (95% CI) | 3.1% (2.7−3.5%) |
1.1% (0.8−1.3%) |
1.9% (1.7−2.1%) |
2.0% (1.9−2.2%) |
| Absolute difference (ref: White) | +1.1%† | −1.0%† | −0.1% (ns) | ref |
| 2011 | ||||
| Patients experiencing SH | 1,321 | 518 | 1,566 | 3,297 |
| At risk population | 44,580 | 43,792 | 91,219 | 171,995 |
| Standardized SH rate* (95% CI) | 3.3% (2.9−3.7%) |
1.0% (0.8−1.1%) |
1.7% (1.5−1.8%) |
2.0% (1.8−2.1%) |
| Absolute difference (ref: White) | +1.3%† | −1.0%† | −0.3%† | ref |
| Trend analysis | ||||
| Average annual percent change (AAPC) in standardized rate (95%CI) | +4.3% (2.1−6.5%)† |
+3.9 (−3.6−12.0%) ns |
+0.5% (−0.6−1.7%) ns |
−0.9% (−4.4−2.8%) ns |
Age- and sex-standardized to the 2010 US Census population
p-value<0.05; ns=non-significant
Figure. Annual SH rates* among patients with diabetes treated with insulin or a secretagogue (Sulfonylureas or Meglitinides) in the SUPREME-DM DataLink. (2005–2011).
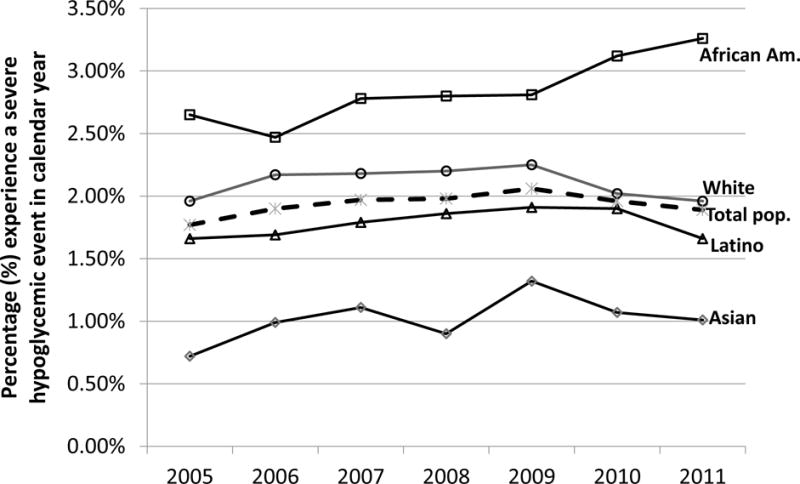
*Age & sex standardized to the 2010 U.S. population; solid lines for race-specific trends, dashed line for total population trend
3.3
The overall AAPC in SH rates during 2005 – 2011 was not significantly different from zero (+0.6%; 95% CI: −1.8, +3.1%). However there was a significant increase in annual SH rates (AAPC = +4.3%; 95% CI: +2.1, +6.5%) among African Americans during the 7 year observation period. The AAPC in annual SH rates in Latinos (+0.5%; 95% CI: −0.6, +1.7%), Asians (+3.9%; 95% CI: −3.6, +12.0%), and Whites (−0.9%; 95% CI: −4.4, +2.8%) were not significantly different from zero.
4. DISCUSSION
4.1
Among insured patients with diabetes treated with insulin or secretagogues in integrated health care delivery systems during 2005–2011, annual rates of SH events diagnosed in the emergency department (ED) or inpatient setting differed by race/ethnicity. Relative to whites, African Americans had ~1.7 -fold higher rates of SH, while Asians and Latinos had lower rates. Moreover, annual SH rates among African Americans increased significantly during the window of observation, but did not change among Asians, Latinos and whites.
4.2
Intensive glucose-lowering strategies in clinical trial populations have been associated with an increase in the risk of hypoglycemia.(Duckworth et al., 2009; Gerstein et al., 2008a; Patel et al., 2008b) Identifying and avoiding overly intensive treatment strategies (or overtreatment) in patients at risk for SH has become a clinical priority.(Lee, 2014; Lipska, 2014; Lipska & Montori, 2013; Lipska, et al., 2014; McCoy et al., 2016; Pogach & Aron, 2010, 2012) However people experiencing hypoglycemia are not necessarily over-treated. Given the harms associated with SH, recent guidelines suggest that avoiding hypoglycemia should be prioritized over aggressive glycemic targets, particularly in older patients,(Seaquist et al., 2013) and measuring rates of SH as a diabetes care quality measure has been suggested.(Clarke et al., 1999) It is unknown to what extent these potential changes in models of care will reduce the risk of SH among different racial/ethnic subgroups. Given the national focus on identifying and eliminating health inequalities, SH surveillance with a focus on vulnerable subgroups should be given greater attention.
4.3
Some study limitations should be noted. Our sample was limited to the 4 largest U.S. racial/ethnic groups, and thus we were unable calculate rates of SH in other racial/ethnic subgroups. This was a surveillance study based on panel data, and thus we did not study nor do we have the appropriate data to investigate the causes of race/ethnic differences in hypoglycemia. Similarly, we lack the ability to stratify our sample by type of diabetes. The SUPREME-DM DataLink discontinued data capture at the end of the 7-year observation window, and it unclear whether observed racial/ethnic patterns persisted after 2011. By limiting our study of racial/ethnic differences in SH to episodes diagnosed in an ED or inpatient encounter, we did not include the vast majority of SH episodes that receive assistance from others outside of ED or hospital settings. In the DISTANCE Study, ~11% of surveyed diabetes patients reported an SH event in the previous 12 months, while only ~0.5% of that cohort received an ED or inpatient diagnosis of SH.(Sarkar et al., 2010) Since it is unclear what factors led persons experiencing an SH event to receive medical attention in the ED or hospital, racial/ethnic patterns of self-reported SH(Berkowitz et al., 2014; Lipska, et al., 2013) may differ from SH diagnosed at a medical facility. Moreover, since we based findings on SH identified via primary or principal diagnoses, findings cannot be generalized to SH events that were secondary to other diagnoses. We studied the proportion of patients that experienced at least one episode in a given year, but did not study the reoccurrence of events (e.g., multiple episodes per year per patient).
4.4
In conclusion, among insured patients across the US, African Americans had persistently higher annual SH rates compared with whites, while Asians and Latinos had lower rates. Moreover, rates increased significantly in African Americans during 2005 – 2011, while none of the other racial/ethnic groups experienced significant changes in their rates. It is unknown whether these differences are due to factors such as racial/ethnic variation in quality of care (despite being insured); differences in utilization of ED services; contextual factors beyond being insured such as lower socioeconomic status(Berkowitz, et al., 2014) or food insufficiency(Seligman, Bolger, Guzman, Lopez, & Bibbins-Domingo, 2014); different rates of beta cell failure and predisposition to more frequent or severe hypoglycemia; or differential distribution of other clinical risk factors (e.g., renal disease, congestive heart failure(Pathak, et al., 2015)). A recent review of racial differences in HbA1c(Herman, 2016) described data showing that, at a given HbA1c level, glucose levels are substantively lower in African Americans compared with whites.(Wolffenbuttel et al., 2013) It was suggested that the risk of SH may be elevated in African Americans when efforts are made to treat African Americans and whites to the same target HbA1c levels.(Herman, 2016) Thus a “one size fits all” target for HbA1c may cause harm. More research is needed to understand to what extent racial differences in the association between HbA1c and glucose, other clinical risk factors, and environmental factors explain the elevated risk of SH in African Americans. Future studies should assess avenues for addressing these potential causes of elevated SH in African Americans and implement interventions to reduce rates of SH in all racial/ethnic groups, with a particular emphasis on African-Americans. SH is a serious side-effect of glucose lowering therapy and continued surveillance, a better understanding of the causes for racial/ethnic inequalities, and development of clinically and culturally-appropriate strategies to reduce the risk of hypoglycemia are needed.
Acknowledgments
We gratefully acknowledge Geisinger Health System for their efforts at developing and refining the SUPREME-DM data sets that informed this work.
Funding sources: The SUPREME-DM project was supported by the Agency for Healthcare Research and Quality [grant number R01HS019859]. Dr Karter was also supported by hypoglycemia-related research grants from NIDDK (R01DK103721, R01DK081796, P30DK092924) and the U.S. Food and Drug Administration (BAA-13-00119).
REFERENCES CITED
- Ali MK, McKeever Bullard K, Imperatore G, Barker L, Gregg EW. Characteristics associated with poor glycemic control among adults with self-reported diagnosed diabetes–National Health and Nutrition Examination Survey, United States, 2007–2010. MMWR Morb Mortal Wkly Rep. 2012;61(Suppl):32–37. [PubMed] [Google Scholar]
- Basu S, Rehkopf DH, Siddiqi A, Glymour MM, Kawachi I. Health Behaviors, Mental Health, and Health Care Utilization Among Single Mothers After Welfare Reforms in the 1990s. American journal of epidemiology. 2016;183(6):531–538. doi: 10.1093/aje/kwv249. [DOI] [PMC free article] [PubMed] [Google Scholar]
- Berkowitz SA, Karter AJ, Lyles CR, Liu JY, Schillinger D, Adler NE, Sarkar U. Low socioeconomic status is associated with increased risk for hypoglycemia in diabetes patients: the Diabetes Study of Northern California (DISTANCE) Journal of health care for the poor and underserved. 2014;25(2):478–490. doi: 10.1353/hpu.2014.0106. [DOI] [PMC free article] [PubMed] [Google Scholar]
- Bonds DE, Miller ME, Bergenstal RM, Buse JB, Byington RP, Cutler JA, Sweeney ME. The association between symptomatic, severe hypoglycaemia and mortality in type 2 diabetes: retrospective epidemiological analysis of the ACCORD study. BMJ. 2010;340:b4909. doi: 10.1136/bmj.b4909. doi: 10.1136/bmj.b4909 bmj.b4909 [pii] [DOI] [PMC free article] [PubMed] [Google Scholar]
- Clarke WL, Cox DJ, Gonder-Frederick L, Julian D, Kovatchev B, Young-Hyman D. Biopsychobehavioral model of risk of severe hypoglycemia. Self-management behaviors. Diabetes Care. 1999;22(4):580–584. doi: 10.2337/diacare.22.4.580. [DOI] [PubMed] [Google Scholar]
- Duckworth W, Abraira C, Moritz T, Reda D, Emanuele N, Reaven PD, Huang GD. Glucose control and vascular complications in veterans with type 2 diabetes. N Engl J Med. 2009;360(2):129–139. doi: 10.1056/NEJMoa0808431. [DOI] [PubMed] [Google Scholar]
- Fenwick EK, Rees G, Holmes-Truscott E, Browne JL, Pouwer F, Speight J. What is the best measure for assessing diabetes distress? A comparison of the Problem Areas in Diabetes and Diabetes Distress Scale: results from Diabetes MILES-Australia. Journal of health psychology. 2016 doi: 10.1177/1359105316642006. [DOI] [PubMed] [Google Scholar]
- Gerstein HC, Miller ME, Byington RP, Goff DC, Jr, Bigger JT, Buse JB, Friedewald WT. Effects of intensive glucose lowering in type 2 diabetes. N Engl J Med. 2008a;358(24):2545–2559. doi: 10.1056/NEJMoa0802743. [DOI] [PMC free article] [PubMed] [Google Scholar]
- Gerstein HC, Miller ME, Byington RP, Goff DC, Jr, Bigger JT, Buse JB, Friedewald WT. Effects of intensive glucose lowering in type 2 diabetes. The New England journal of medicine. 2008b;358(24):2545–2559. doi: 10.1056/NEJMoa0802743. [DOI] [PMC free article] [PubMed] [Google Scholar]
- Ginde AA, Blanc PG, Lieberman RM, Camargo CA., Jr Validation of ICD-9-CM coding algorithm for improved identification of hypoglycemia visits. BMC endocrine disorders. 2008;8:4. doi: 10.1186/1472-6823-8-4. [DOI] [PMC free article] [PubMed] [Google Scholar]
- Ginde AA, Espinola JA, Camargo CA., Jr Trends and disparities in U.S. emergency department visits for hypoglycemia, 1993–2005. Diabetes Care. 2008;31(3):511–513. doi: 10.2337/dc07-1790. [DOI] [PubMed] [Google Scholar]
- Goto A, Arah OA, Goto M, Terauchi Y, Noda M. Severe hypoglycaemia and cardiovascular disease: systematic review and meta-analysis with bias analysis. Bmj. 2013;347:f4533. doi: 10.1136/bmj.f4533. [DOI] [PubMed] [Google Scholar]
- Herman WH. Are There Clinical Implications of Racial Differences in HbA1c? Yes, to Not Consider Can Do Great Harm! Diabetes Care. 2016;39(8):1458–1461. doi: 10.2337/dc15-2686. [DOI] [PMC free article] [PubMed] [Google Scholar]
- Hornbrook MC, Hart G, Ellis JL, Bachman DJ, Ansell G, Greene SM, Neslund Dudas C. Building a virtual cancer research organization. J Natl Cancer Inst Monogr. 2005;(35):12–25. doi: 10.1093/jncimonographs/lgi033. doi: 2005/35/12 [pii] 10.1093/jncimonographs/lgi033. [DOI] [PubMed] [Google Scholar]
- Johnston SS, Conner C, Aagren M, Ruiz K, Bouchard J. Association between hypoglycaemic events and fall-related fractures in Medicare-covered patients with type 2 diabetes. Diabetes Obes Metab. 2012;14(7):634–643. doi: 10.1111/j.1463-1326.2012.01583.x. [DOI] [PubMed] [Google Scholar]
- Karter AJ, Ferrara A, Liu JY, Moffet HH, Ackerson LM, Selby JV. Ethnic disparities in diabetic complications in an insured population. Jama. 2002;287(19):2519–2527. doi: 10.1001/jama.287.19.2519. [DOI] [PubMed] [Google Scholar]
- Kim HJ, Fay MP, Feuer EJ, Midthune DN. Permutation tests for joinpoint regression with applications to cancer rates. Statistics in medicine. 2000;19(3):335–351. doi: 10.1002/(sici)1097-0258(20000215)19:3<335::aid-sim336>3.0.co;2-z. [DOI] [PubMed] [Google Scholar]
- Kirk JK, D’Agostino RB, Jr, Bell RA, Passmore LV, Bonds DE, Karter AJ, Narayan KM. Disparities in HbA1c levels between African-American and non-Hispanic white adults with diabetes: a meta-analysis. Diabetes Care. 2006;29(9):2130–2136. doi: 10.2337/dc05-1973. [DOI] [PMC free article] [PubMed] [Google Scholar]
- Laiteerapong N, Karter AJ, Liu JY, Moffet HH, Sudore R, Schillinger D, Huang ES. Correlates of quality of life in older adults with diabetes: the diabetes & aging study. Diabetes Care. 2011;34(8):1749–1753. doi: 10.2337/dc10-2424. [DOI] [PMC free article] [PubMed] [Google Scholar]
- Lee SJ. So Much Insulin, So Much Hypoglycemia. JAMA internal medicine. 2014 doi: 10.1001/jamainternmed.2013.13307. [DOI] [Google Scholar]
- Lipska KJ. Improving Safety of Diabetes Mellitus Management. JAMA internal medicine. 2014 doi: 10.1001/jamainternmed.2014.3290. [DOI] [PMC free article] [PubMed] [Google Scholar]
- Lipska KJ, Montori VM. Glucose control in older adults with diabetes mellitus–more harm than good? JAMA internal medicine. 2013;173(14):1306–1307. doi: 10.1001/jamainternmed.2013.6189. [DOI] [PubMed] [Google Scholar]
- Lipska KJ, Ross JS, Wang Y, Inzucchi SE, Minges K, Karter AJ, Krumholz HM. National trends in US hospital admissions for hyperglycemia and hypoglycemia among Medicare beneficiaries, 1999 to 2011. JAMA internal medicine. 2014;174(7):1116–1124. doi: 10.1001/jamainternmed.2014.1824. [DOI] [PMC free article] [PubMed] [Google Scholar]
- Lipska KJ, Warton EM, Huang ES, Moffet HH, Inzucchi SE, Krumholz HM, Karter AJ. HbA1c and risk of severe hypoglycemia in type 2 diabetes: the Diabetes and Aging Study. Diabetes Care. 2013;36(11):3535–3542. doi: 10.2337/dc13-0610. [DOI] [PMC free article] [PubMed] [Google Scholar]
- McCoy RG, Lipska KJ, Yao X, Ross JS, Montori VM, Shah ND. Intensive Treatment and Severe Hypoglycemia Among Adults With Type 2 Diabetes. JAMA internal medicine. 2016;176(7):969–978. doi: 10.1001/jamainternmed.2016.2275. [DOI] [PMC free article] [PubMed] [Google Scholar]
- McCoy RG, Van Houten HK, Ziegenfuss JY, Shah ND, Wermers RA, Smith SA. Increased mortality of patients with diabetes reporting severe hypoglycemia. Diabetes Care. 2012;35(9):1897–1901. doi: 10.2337/dc11-2054. [DOI] [PMC free article] [PubMed] [Google Scholar]
- Nichols GA, Desai J, Elston Lafata J, Lawrence JM, O’Connor PJ, Pathak RD, Waitzfelder B. Construction of a multisite DataLink using electronic health records for the identification, surveillance, prevention, and management of diabetes mellitus: the SUPREME-DM project. Prev Chronic Dis. 2012;9:E110. doi: 10.5888/pcd9.110311. [DOI] [PMC free article] [PubMed] [Google Scholar]
- Orandi BJ, Luo X, Massie AB, Garonzik-Wang JM, Lonze BE, Ahmed R, Segev DL. Survival Benefit with Kidney Transplants from HLA-Incompatible Live Donors. The New England journal of medicine. 2016;374(10):940–950. doi: 10.1056/NEJMoa1508380. [DOI] [PMC free article] [PubMed] [Google Scholar]
- Patel A, MacMahon S, Chalmers J, Neal B, Billot L, Woodward M, Travert F. Intensive blood glucose control and vascular outcomes in patients with type 2 diabetes. N Engl J Med. 2008a;358(24):2560–2572. doi: 10.1056/NEJMoa0802987. [DOI] [PubMed] [Google Scholar]
- Patel A, MacMahon S, Chalmers J, Neal B, Billot L, Woodward M, Travert F. Intensive blood glucose control and vascular outcomes in patients with type 2 diabetes. N Engl J Med. 2008b;358(24):2560–2572. doi: 10.1056/NEJMoa0802987. [DOI] [PubMed] [Google Scholar]
- Pathak RD, Schroeder EB, Seaquist ER, Zeng C, Lafata JE, Thomas A, O’Connor PJ. Severe Hypoglycemia Requiring Medical Intervention in a Large Cohort of Adults With Diabetes Receiving Care in U.S. Integrated Health Care Delivery Systems: 2005–2011. Diabetes Care. 2015 doi: 10.2337/dc15-0858. [DOI] [PMC free article] [PubMed] [Google Scholar]
- Pogach L, Aron D. Balancing hypoglycemia and glycemic control: a public health approach for insulin safety. JAMA: the journal of the American Medical Association. 2010;303(20):2076–2077. doi: 10.1001/jama.2010.655. [DOI] [PubMed] [Google Scholar]
- Pogach L, Aron D. The other side of quality improvement in diabetes for seniors: a proposal for an overtreatment glycemic measure. Archives of Internal Medicine. 2012;172(19):1510–1512. doi: 10.1001/archinternmed.2012.4392. [DOI] [PubMed] [Google Scholar]
- Prevention, C. f. D. C. a. Emergency Department Visit Rates for Hypoglycemia as First-Listed Diagnosis per 1,000 Diabetic Adults Aged 18 Years or Older, United States, 2006–2009. Atlanta: Division of Diabetes Translation, National Center for Chronic Disease Prevention and Health Promotion, Centers for Disease Control and Prevention; 2014. Retrieved from http://www.cdc.gov/diabetes/statistics/hypoglycemia/fig5.htm. [Google Scholar]
- Sarkar U, Karter AJ, Liu JY, Moffet HH, Adler NE, Schillinger D. Hypoglycemia is more common among type 2 diabetes patients with limited health literacy: the Diabetes Study of Northern California (DISTANCE) Journal of general internal medicine. 2010;25(9):962–968. doi: 10.1007/s11606-010-1389-7. [DOI] [PMC free article] [PubMed] [Google Scholar]
- Schwartz AV, Vittinghoff E, Sellmeyer DE, Feingold KR, de Rekeneire N, Strotmeyer ES, Harris TB. Diabetes-related complications, glycemic control, and falls in older adults. Diabetes Care. 2008;31(3):391–396. doi: 10.2337/dc07-1152. [DOI] [PMC free article] [PubMed] [Google Scholar]
- Seaquist ER, Anderson J, Childs B, Cryer P, Dagogo-Jack S, Fish L, Vigersky R. Hypoglycemia and diabetes: a report of a workgroup of the American Diabetes Association and the Endocrine Society. Diabetes Care. 2013;36(5):1384–1395. doi: 10.2337/dc12-2480. [DOI] [PMC free article] [PubMed] [Google Scholar]
- Seligman HK, Bolger AF, Guzman D, Lopez A, Bibbins-Domingo K. Exhaustion Of Food Budgets At Month’s End And Hospital Admissions For Hypoglycemia. Health affairs. 2014;33(1):116–123. doi: 10.1377/hlthaff.2013.0096. [DOI] [PMC free article] [PubMed] [Google Scholar]
- Shen JJ, Washington EL. Identification of diabetic complications among minority populations. Ethn Dis. 2008;18(2):136–140. [PubMed] [Google Scholar]
- Shorr RI, Ray WA, Daugherty JR, Griffin MR. Incidence and risk factors for serious hypoglycemia in older persons using insulin or sulfonylureas. Archives of Internal Medicine. 1997;157(15):1681–1686. [PubMed] [Google Scholar]
- Signorovitch JE, Macaulay D, Diener M, Yan Y, Wu EQ, Gruenberger JB, Frier BM. Hypoglycaemia and accident risk in people with type 2 diabetes mellitus treated with non-insulin antidiabetes drugs. Diabetes Obes Metab. 2012 doi: 10.1111/dom.12031. [DOI] [PMC free article] [PubMed] [Google Scholar]
- Trief PM, Sandberg JG, Dimmock JA, Forken PJ, Weinstock RS. Personal and Relationship Challenges of Adults With Type 1 Diabetes: A qualitative focus group study. Diabetes Care. 2013 doi: 10.2337/dc12-1718. [DOI] [PMC free article] [PubMed] [Google Scholar]
- Wang Y, Katzmarzyk PT, Horswell R, Li W, Xiao K, Besse J, Hu G. Racial disparities in diabetic complications in an underinsured population. J Clin Endocrinol Metab. 2012;97(12):4446–4453. doi: 10.1210/jc.2012-2378. [DOI] [PubMed] [Google Scholar]
- Whitmer RA, Karter AJ, Yaffe K, Quesenberry CP, Jr, Selby JV. Hypoglycemic episodes and risk of dementia in older patients with type 2 diabetes mellitus. JAMA. 2009;301(15):1565–1572. doi: 10.1001/jama.2009.460. doi:301/15/1565 [pii] 10.1001/jama.2009.460. [DOI] [PMC free article] [PubMed] [Google Scholar]
- Wolffenbuttel BH, Herman WH, Gross JL, Dharmalingam M, Jiang HH, Hardin DS. Ethnic differences in glycemic markers in patients with type 2 diabetes. Diabetes Care. 2013;36(10):2931–2936. doi: 10.2337/dc12-2711. [DOI] [PMC free article] [PubMed] [Google Scholar]
- Yu TM, Lin CL, Chang SN, Sung FC, Kao CH. Increased risk of stroke in patients with chronic kidney disease after recurrent hypoglycemia. Neurology. 2014;83(8):686–694. doi: 10.1212/WNL.0000000000000711. [DOI] [PubMed] [Google Scholar]
- Zoungas S, Patel A, Chalmers J, de Galan BE, Li Q, Billot L, Heller S. Severe hypoglycemia and risks of vascular events and death. N Engl J Med. 2010;363(15):1410–1418. doi: 10.1056/NEJMoa1003795. [DOI] [PubMed] [Google Scholar]