

Abstract
Genome-wide DNA replication timing (RT) profiles reflect the global 3D chromosome architecture of cells. They also provide a comprehensive and unique megabase-scale picture of the cellular epigenetic state. Thus normal differentiation involves reproducible changes in RT and transformation generally perturbs these, although the potential effects of altered RT on the properties of transformed cells remain largely unknown. A major challenge to interrogating these issues in human acute lymphoid leukemia (ALL) is the low proliferative activity of most of the cells, which may be further reduced in cryopreserved samples and difficult to overcome in vitro. In contrast, the ability of many human ALL cell populations to expand when transplanted in highly immunodeficient mice is well documented. To examine the stability of DNA RT profiles of serially passaged xenografts of primary human B- and T-ALL cells, we first devised a method that circumvents the need for BrdU incorporation to distinguish early versus late S-phase cells. Using this and more standard protocols, we found consistent strong retention in xenografts of the original patient-specific RT features, for all 8 primary human ALL cases surveyed (7 B-ALLs and one T-ALL). Moreover, in a case where genomic analyses indicated changing subclonal dynamics in serial passages, the RT profiles tracked concordantly. These results show that DNA RT is a relatively stable feature of human ALLs propagated in immunodeficient mice. In addition, they suggest the power of this approach for future interrogation of the origin and consequences of altered DNA RT in these diseases.
Keywords: replication timing (RT), acute lymphoblastic leukemia (ALL), patient-derived xenograft (PDX), copy number variation (CNV)
Graphical Abstract
Introduction
Significant strides have been made in identifying features of different human acute lymphoid leukemia (ALL) cases that predict treatment success or failure with a high probability. Nevertheless, many aspects of the leukemogenic process are still poorly understood. Current therapeutic regimens for ALL are also still less than 100% curative, particularly in adults, and also have deleterious short-term and long-term toxicities (Irving et al., 2016). New strategies for elucidating the biological heterogeneity of ALLs, improving their risk stratification, and for developing more personalized and less toxic curative therapies therefore continue to command interest.
DNA replication timing (RT) refers to the temporal order in which different segments of the genome replicate during S-phase. We recently demonstrated that the proliferating subset of cells in different subtypes of human pediatric B-cell precursor ALL (B-ALL) display disease-specific features in their genome wide RT profiles (Pope et al., 2014; Ryba et al., 2012). RT is fundamentally different from many hallmarks of cancer because it is a robust property of epigenetically distinct cell types and their megabase-level 3D chromosomal organization rather than of individual genes or regulatory elements (Rivera-Mulia and Gilbert, 2016a; Rivera-Mulia and Gilbert, 2016b). Because mutation rates are significantly higher in regions of DNA that are replicated during late versus early S-phase, knowledge of RT in patient samples aids the distinction of driver and passenger mutations (Lawrence et al., 2013; Lochovsky et al.; Polak et al., 2015; Shugay et al., 2012; Sima and Gilbert, 2014; Supek and Lehner, 2015; Woo and Li, 2012). RT patterns in human ALL cells may also contain information relevant to prognosis and therapy. However, at present, the multiplicity of factors that determine RT profiles and their stability remains unknown. Data for RT profiles of fresh and experimentally expanded samples of patient ALL should thus provide new opportunities to interrogate their biological and clinical significance.
A major impediment to studies of RT in human ALLs has been the usually low frequency of dividing cells in fresh or cryopreserved patients’ samples (Ryba et al., 2012). In addition, conditions that support or stimulate ALL cell survival and proliferation ex vivo are generally lacking or poorly understood, although some progress in this regard has been recently reported (Pal et al., 2016). Genetically engineered mouse models of human leukemia offer an experimental alternative, but these face the same cell growth problems and rarely recapitulate the genetic complexity associated with the clinical examples of the human leukemias they are intended to model (Beer and Eaves, 2015). A more promising alternative is afforded by the use of highly immunodeficient mice transplanted with primary patient-derived ALL cells where retention of many characteristics of the initial leukemia cells, including their patterns of dissemination, organ infiltration, and immunophenotypic, and genomic stability have been demonstrated (Morisot et al., 2010; Nowak et al., 2015). Genomic analysis of such patient-derived xenografts (PDXs) has also been useful in revealing their subclonal architecture and evolution (Anderson et al., 2011; Notta et al., 2011; Shlush et al., 2014).
Here, we demonstrate the feasibility of analyzing the RT profiles of human ALL cells before and after serial passaging as PDXs. The results reveal stability in both their patient- and subclone-specific RT profiles.
Materials and Methods
Patient samples
Patient bone marrow (BM) and peripheral blood (PB) samples were available from previously collected samples (Morisot et al., 2010; Ryba et al., 2012), or from patients enrolled in new studies (Medyouf et al., 2010). Informed consent was obtained in all cases and samples collected and assigned anonymized unique identifiers according to protocols approved by the Institutional Review Boards of the organizations where the samples were obtained. Subjects included all genders, minorities, and children. Fresh samples were centrifuged on Ficoll-Hypaque or Lymphoprep to isolate the low-density (≤1.077 g/L) fraction, which were then labeled with BrdU either when freshly obtained or after cryopreservation in media containing fetal bovine serum (FBS) plus 10% DMSO.
PDXs
All PDXs were generated by injecting cells intravenously into either 6–8-week-old NOD-scid-IL2Rγc−/− (NSG) mice given an acute dose of 250 cGy 137Cs γ-rays, or NOD-Rag1−/−-IL2Rγc−/− (NRG) mice given 900 cGy 137Cs γ-rays delivered over 3 hours (Miller et al., 2017). Mice were then monitored daily and euthanized if severely ill or as required experimentally. Spleens and/or BM cells were harvested from euthanized mice and single cell suspensions prepared. Low-density cells were used for phenotyping, genotyping, DNA-RT assessments and for further transplants either directly or after cryopreservation. All methods using mice followed protocols approved by the Institutional Animal Care and Use Committees of the organizations where they were performed.
Genome-wide DNA-RT analysis
RT profiles were generated using one of the following 3 protocols depending on the number of proliferating cells available and their efficiency of BrdU incorporation. In the first, propidium iodide-stained cells were fractioned by fluorescent-activated cell sorting (FACS) into early and late S-phase fractions, total genomic DNA then extracted from both fractions. BrdU-labeled nascent DNA was then enriched by immunoprecipitation using an anti-BrdU antibody, differentially labeled with Cy3 or Cy5 and co-hybridized to NimbleGen HD2 microarrays (E/L repli-chip). In the second method, cells were separated by FACS into G1- and S-phase fractions based on their propidium iodide-stained DNA content, and total genomic DNA extracted from both fractions, that were then differentially labeled with Cy3 or Cy5 and co-hybridized to NimbleGen HD2 microarrays (S/G1 repli-chip). In the third method, BrdU-labeled cells were separated by FACS into early and late S-phase fractions, total genomic DNA extracted from both, adaptors for next-generation sequencing (Illumina) ligated using NEBNext® Ultra™ DNA Library Prep Kit for Illumina, and the BrdU-labeled nascent DNA from each fraction enriched by anti-BrdU immunoprecipitation prior to being indexed, amplified, pooled, and sequenced on a HiSeq2500 platform with 50 bp single end mode to obtain approximately ≥ 5 million mapped reads/library (E/L repli-seq).
Computational methods
For Repli-chip data (both S/G1 and E/L methods), fluorescence intensities were first normalized within and between arrays using the limma package in R to determine a log2 ratio of signals from “early S” vs. “late S” fractions, or “S” vs. “G1” fractions, for each probe, as described (Ryba et al. 2011a). Repli-seq data were first clipped using a quality score of 30 as the threshold, then mapped to HG19 by bowtie2 and reads per million counted for non-overlapping 6-kb windows in each library. Finally, the log2 ratio of “reads from each early S fraction”/"reads from the matching late S fraction” was calculated for each sample. Repli-chip and repli-seq data were then re-scaled to equivalent ranges by quantile normalization as described (Rivera-Mulia et al., 2015), and smoothened using loess with a span of 300 kb to 1 Mb.
Cluster analyses were performed as described (Rivera-Mulia et al., 2015). Briefly, data were averaged into non-overlapping 204-kb windows (13,158 windows throughout the autosomal genome). Early and late replication patterns were defined by RT log2 ratios of ≥ 0.3 or ≤ –0.3, respectively. Significantly variable regions were defined as those that replicated early in at least one sample and late in at least one other sample (Rivera-Mulia et al. 2015). K-means clustering was performed using Cluster 3.0 (de Hoon et al. 2004) after constant regions were removed, leaving 1,514 windows. Further hierarchical clustering was then performed. Heatmaps and dendrograms were generated in JavaTreeView (Saldanha, 2004). A correlation matrix was made using the corrplot R package.
Copy number variant (CNV) analysis
CNVs was estimated from array and DNA sequencing data as follows: read counts from early- and late-S fractions were collected for non-overlapping 6-kb windows, respectively, then compensated for mapping using the read counts in the same window sizes as for the control human DNA (average of many samples). Read counts for E and L fractions in 6-kb windows were further windowed into 50-kb non-overlapping bins. After quantile normalization, total read counts (E+L) for each sample were calculated. Finally, log2 ratios of sample/control were calculated for CNV analysis with the DNA copy package in (http://bioconductor.org/packages/release/bioc/html/DNAcopy.html).
Results
Establishment of protocols for generating RT profiles from proliferating ALL cells independent of their ability to actively incorporate BrdU
The most robust method for obtaining RT profiles is to pulse-label cells with BrdU for approximately 20% of the S–phase period, then separate the cells into early and late S-phase fractions by FACS, and isolate the nascently synthesized (BrdU-substituted) DNA in the two fractions by anti-BrdU immunoprecipitation (Dileep et al., 2012; Ryba et al., 2011). The relative enrichment of any given sequence in the BrdU-substituted DNA from each of the two fractions is then calculated. Sequences identified in early S-phase are set as the numerator and those in late S-phase as the denominator (E/L) to enable more positive values to be represented in the early S-phase cells. This method has a dynamic range of 4,000-fold (when sequencing is used; Repli-seq) or 64-fold (using microarrays; Repli-chip) (Dileep et al., 2015), but requires a minimum of 2,000 BrdU-labeled cells (1,000 per S-phase fraction). We previously found that a few million freshly obtained BM or PB cells from ALL patients at diagnosis or relapse consistently yielded sufficient S-phase cells for high quality RT analysis (Ryba et al., 2012). However, subsequent attempts to apply this method to cryopreserved ALL samples failed in nearly half the cases tested.
We therefore investigated a third protocol that exploits the relative CNV between cells in early and late S-phase fractions to infer RT data (Gilbert, 2010) (see also Figure 1A). When unlabeled proliferating cells are first sorted into separate populations of cells distributed throughout S-phase and cells in G1 and then whole genome sequencing is performed on these two fractions, RT can then be expressed as the ratio of reads found in S:G1. DNA that replicates earlier is present in S-phase cells at up to twice the copy number as DNA that replicates later and normalizing the reads for S-phase cells to reads for cells in G1 controls for any sample-specific CNVs (Gilbert, 2010). This protocol circumvents the need for viable cells to incorporate BrdU, but decreases the dynamic range of the data to less than 2-fold.
Figure 1. RT profiles from ALL PDXs.

A. Outline of a genome-wide RT assay. BrdU labeling of nascent DNA (E/L) is preferred whenever cells are actively proliferating. However, RT profiles can also be obtained on patient samples that have lost metabolic activity but retain their S-phase DNA content based on an analysis of their DNA copy number differences (S/G1). B. Comparison of log2 ratios for both methods applied to the same spleen cells derived from a B-ALL PDX. Although the S/G1 method gives a dynamic range of <2-fold vs. up to >1,000-fold from the E/L method, the profiles are comparable. In the bottom panel, data from all 3 methods were quantile normalized to each other. C. Exemplary scaled and normalized plot of chromosome 1 from the same samples as in B.
Figure 1B shows an example of results obtained when all 3 methods (Repli-chip E/L and S/G1; and Repli-seq E/L) were applied to the same sample; in this case spleen cells isolated from a mouse transplanted with a primary B-ALL sample and subjected either directly to the S/G1 method or first labeled ex vivo with BrdU and then subjected to the E/L method. The ex vivo BrdU method for labeling DNA was selected as preliminary experiments with the same cells indicated that an intravenous injection of BrdU did not yield sufficient BrdU-immunoprecipitated DNA (data not shown). Despite the difference in dynamic range between the 2 methods for RT profiling, the data obtained proved to be comparable after scaling and quantile normalization. Together, these results establish protocols for generating high quality RT profiles from human cells even when those in S-phase at the time of analysis may no longer be viable.
PDXs of patient ALL cells retain global RT profiles of their cell type of origin
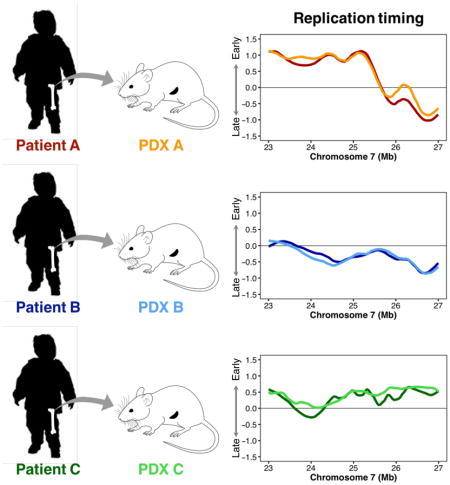
We then used these protocols to examine the uniqueness of the RT profiles generated from different patient ALL samples and the stability of these profiles after serial passaging in mice. PDXs were generated from 7 B-ALL patients and from one T-ALL sample. In 4 of these cases, samples from secondary and sometimes tertiary passages were obtained and analyzed (Table I and Supplementary Table 1). From a first-pass visual inspection, the RT profiles obtained for each patient’s initial clinical sample appeared to have unique features that were also present in the derived PDX(s) (Figure 2A). This suggested extensive preservation of the mechanisms that account for these differences.
Table 1.
| patient/case ID |
New Diagnosis |
Age (yrs) |
Gender | NCI rome risk group |
Patient Sample Type |
Cell markers | NSG Engraft w/ radiation |
NSG Engraft w/o radiation |
Cytogenetics | karyotype | comments |
|---|---|---|---|---|---|---|---|---|---|---|---|
| B-ALL #1 | N | 3 | M | HR | PB | CD19+ CD10+ CD34+ CD38+ CD22+ CD45(+) CD20- CD25- CD52- Kappa- Lamda- IRTA2- | Yes | Yes | t(9;22) | no info | BCR-ABL |
|
| |||||||||||
| B-ALL #4 | Y | 13 | M | HR | BM | CD10+ CD19+ pCD20(+) CD9- CD33- CD34+ CD45+ CD71- HLA-DR+ | Yes | Yes | inv(19)(p13.3q13.1) | no info | |
|
| |||||||||||
| B-ALL #5 | Y | 3 | M | SR | BM | CD10+ CD19+ pCD20(+) CD9- CD33- CD34+ CD45+ CD71- HLA-DR+ | Yes | Yes | del(9)(p13) | no info | |
|
| |||||||||||
| B-ALL #21 | N | 16 | no info received | F | BM | moderate to negative CD9, a spectrum of dim to negative CD10, CD11b, CD13, CD15, dim CD19, CD33, dim CD34, CD36, CD58, CD64 and HLADR but are negative for CD3, CD14, CD16, CD20, CD22 and CD71 | Yes | Yes | del(9p); homozygous loss p16; loss IKAROS | no info | |
|
| |||||||||||
| 10-668 | Y | 6 | M | VHR | BM | CD10, CD19, CD20, CD22, partial CD34, dim CD45, cCD79a, HLA-DR, and TdT positive | no info | 46,XY,del(9)(p13),t(9;22)(q34;q11.2)[12]/46,XY,del(9)(p13),der(9)t(9;22)(q3 4;q11.2), ider(22)(q10)t(9;22)(q34;q11.2)[4]/46,XY[7] | BCR/ABL | ||
| 11-064 | Y | 8 | F | SR | BM | CD10, CD19, CD22, dim CD45, cCD79a and TdT positive | no info | 45,XX,del(6)(q?13),i(9)(q10),-13,der(19)t(1;19)(q2?1;p13)[15]/46,XX[5] | E2A/PBX1 | ||
|
| |||||||||||
| T-ALL F1313 | Y | 27 | M | SR | PB | CD45dim CD2+ cyCD3+ CD5dim CD7+ CD4-CD8dim/- CD56-CD57- CD1a+ CD10+ TdT | Yes | probably | normal | normal male | 46XY |
Figure 2. Preservation of RT profiles in PDXs.

A. Representative loci that showed patient-specific RT differences. RT of DNA from each of 3 primary patient samples and their PDXs has been conserved at the loci shown. B. Genome-wide Pearson correlation matrix using 204-kb windows. Cell types are color-coded as B-ALL (purple), embryonic stem (ES) cells (gray), and normal T- or B-cells (orange).
To determine whether these RT profiles are preserved genome wide, we first divided the autosomal genome into 13,158 non-overlapping 204-kb segments. We then generated a correlation matrix between all sample datasets including several additional samples of non-leukemic cells as comparators (Figure 2B). This analysis showed the B-ALL PDX RT profiles to be more similar globally to the RT profiles of a large group of primary B-ALL cells, as compared to a series of non-leukemic B-cell lines or freshly isolated PB T-cells. The PDX RT profiles were also shown to be substantially different from the RT profiles of the human embryonic stem cells analyzed. Although the RT profiles for different B-ALL patient’s cells were more heterogeneous than those for the non-leukemic B- and T-cells, those from the B-ALL patients’ cells still formed a correlated group (Figure 2B). The RT profile of the T-ALL patient’s sample was also strongly correlated to its PDX and more strongly to the RT profile of normal PB T-cells than to the RT profiles of the non-leukemic B-cell lines. These results demonstrate the ability of the protocols shown in Figure 1 to detect case-specific RT features preserved in PDX (Figure 2A) and that RT profiles are globally preserved after passage through PDX (Figure 2B).
PDX samples retain the unique RT signatures of the initial ALL sample
Correlations of RT derived from genome wide analyses (Figure 2B) do not, however, usually allow closely related cell types to be distinguished, due to the fact that they include spurious measurements of differences in regions that do not differ in RT (noise). In a previous analysis of 26 different normal human cell types, we used unsupervised K-means and hierarchical clustering to identify 200 kb segments of chromosomal DNA that showed cell type-specific RT patterns, to which we then assigned the term, “RT signatures" (Rivera-Mulia et al., 2015). We restricted the identification of these RT signatures to include only those segments defined as “RT variable” because they were found to have replicated with a Log2(E/L) of ≥0.3 in at least one cell type and ≤-0.3 in at least one other cell type. These criteria enabled differences in the RT profiles of closely related stages of differentiation in the same lineage to be resolved.
To investigate further the patient specificity of the RT profiles obtained in the present study, we adopted these same criteria to derive RT signatures from the data obtained for all of the patient and PDX samples as well as for the non-leukemic cell types shown in Figure 2B. The complete array of “RT variable” segments thus identified were found to cover 40% of the 200 DNA segments used to subdivide the entire genome. K-means and hierarchical clustering of these variable segments showed the original B-ALL cells and their corresponding PDXs formed separate patient-specific clusters (Figure 3A). The same analysis also identified specific clusters (RT signatures) for pluripotent cells (clusters 4, 5, 11 and 13), non-leukemic lymphoid cells (clusters 1, 6 and 10) B-ALL cells (clusters 2 and 14) and the single case of T-ALL before and after passage in PDX (clusters 3 and 7).
Figure 3. RT signatures of patients are preserved in PDX.

K-means and hierarchical clustering of initial ALL samples, derived PDXs and multiple samples of non-leukemic cells (A), and the same analysis of patient and their PDX samples only (B). RT variable 204-kb windows were defined as early replicated in at least one sample (RT log2 ratio ≥0.3) and late replicated in at least one other sample (RT log2 ratio ≤-0.3) and processed by cluster analysis. The percentage of autosomal DNA segments that showed significant variation in RT is shown. Dendrograms were constructed based on the correlation values between distinct cell types (distance = correlation value -1). A correlation threshold of >0.6 was used to color label the major branches of the dendrograms. The distinct RT signatures identified are indicated by numbered grey boxes. Method of RT profiling is indicated (E/L vs. S/G1). Since the single T-ALL patient sample exhibits the most significantly different RT differences as compared to the BALL samples, most of the K-means clusters (RT signatures) are unique in the T-ALL patient sample. Figure 4 shows a clustering excluding this sample.
To further stratify the ALL samples (initial and PDX-derived), we repeated the above analysis after removing the data for all of the other samples, but using the same criteria to define RT variable regions. This reduced the RT variable regions to only 10% of the genome and spread the relative correlation between samples over a broader dynamic range but still retained a high correlation between each patient and his/her PDX samples (Figure 3B), with the exception of B-ALL #4 (discussed below). These results revealed additional ALL case-specific RT signatures not detected in Figure 3A. Statistical significance of these RT signatures was confirmed by pairwise T-test with bonferroni correction (Supplementary Figure 1). Importantly, patient and corresponding PDX samples cluster in all cases (except patient 4 discussed below), demonstrating that the RT features (RT of individual chromosomal segments that constitute each RT signature) extracted by unbiased clustering are stably maintained through multiple serial passages of each ALL in immunodeficient mice.
The RT signatures unveiled in Figure 3B are dominated by those of the single T-ALL case and its PDX. This is due to the fact that most genomic segments that survive the stringent filter imposed for “RT variable” regions reflect differences between the B-ALL samples and the single T-ALL sample. To analyze the differences between the B-ALL samples with greater sensitivity, we identified 60 kb chromosomal segments with the top 10% standard deviation in RT between the three frozen banked B-ALL patient samples analyzed and then repeated an unsupervised K-means and hierarchical clustering analysis of these. This allowed us to segment the same percentage of the genome as in Figure 3B, but focused on the differences that exclusively distinguish the three B-ALL patients. The results revealed distinct patient specific clusters (RT signatures) that track with each patient and its corresponding PDX(s) (Figure 4A). Examples of these regions, which included those features identified by visual inspection in Figure 2A, are shown in Figure 4B. Statistical significance of these RT signatures was confirmed by pairwise T-test with bonferroni correction (Supplementary Figure 2). Altogether, these results demonstrate that patient-specific RT features are stably maintained through multiple serial PDX passages.
Figure 4. RT signatures distinguishing B-ALL patients are also preserved in PDX.

A. Similar analysis as shown in Figure 3 except that 60kb RT variable regions were defined as the top 10% regions of standard deviation amongst only the B-ALL patients and their PDX and only those patients and PDX were subjected to K-means and hierarchical clustering analysis. Clusters 3,5, and 6 are specific for patient 11-064. Clusters 7 and 9 distinguish the clonal architecture of patient 4 (see Figure 5). Cluster 10 is shared between 11-064 and Case21. B. Exemplary plots of selected RT signature features (chromosomal segments or rows in Fig 4A) with the K-means cluster indicated in each panel. As expected, this unbiased analysis identified the regions shown in Figure 2A that were detected by visual inspection (panels i and ii). Panels vii and viii show signature features that distinguish the different clones in Patient 4 (P4) and those P4 profiles are extracted and shown separately below each panel. Note that examples of features that are significantly different for one particular patient are shown (panels iii, iv, vi, ix) with the outlier patient indicated but most RT features are variable between all patients. All features distinguish some patients from others while each patient has a unique pattern within each RT signature.
RT profiles can identify subclone outgrowths in PDXs
As shown in Figures 3A–C and 4A, cells from case B-ALL #4 exhibited an interesting exception to the general stability of the RT profile seen in other patients’ PDXs. In the case of B-ALL #4, many of the specific features of the RT profile of the original sample were also present in the second PDX but the RT signatures of the first and third passage PDXs formed a separate cluster. Examples of RT features from these distinct RT signatures are shown in Figure 5A. Since RT profiles inherently quantify the relative abundance of sequences across the entire genome, the data derived from them can also detect the CNV signature of the cells present (Ryba et al., 2012). Thus, we next asked whether the altered RT signatures obtained in the first and third passage PDXs were accompanied by parallel fluctuations in the prevalence of genomically distinct subclones. Examination of the CNV status of the cells from B-ALL #4 through the same serial PDX passages revealed 2 autosomal CNVs that were present in the patient’s initial cells and the second passage PDX but absent from the first and third passage PDXs that displayed a common deviant RT-signature (Figure 5B). This result is consistent with the first and third PDXs being derived from a subclone that was not evident in the patient’s original sample. These findings are interesting because unique CNV profiles reflect the composite prevalence of genetically distinct subclones within the population analyzed, whereas RT profiles are determined exclusively by those cells that were proliferating which are not known to be a constant fraction of all subclones. However, the observed concordance in the fluctuating dynamics of CNV and RT profiles with serial passaging suggests that these were related, at least in this example.
Figure 5. Changes in RT signatures in a serially passaged PDX mirror changes in genomically defined subclonal differences.

(A) Exemplary chromosomal region where B-ALL #4 RT matched the 2nd, but not the 1st and 3rd, serial PDX passage. (B) Two autosomal CNVs identified in the RT data of the original ALL cells were found to be present in the 2nd, but not the first or third passage. PDX. Note that these CNVs did not result in a change in RT that would be detected as a significant RT variation but rather served as a genetic marker to track the alternating outgrowth of different subclones in sequential passages.
DISCUSSION
As normal cells differentiate, the timing of replication of different segments of their chromosomal DNA changes, reflecting their changing 3D folding states (Dileep et al., 2015). DNA replication that occurs early in S-phase increases gene dosage, and cells use specific mechanisms to compensate for gene dosage effects incurred during their passage through each cell cycle (Voichek et al., 2016). DNA RT patterns are likewise affected by genetic and epigenetic changes that confer malignant properties on cells. RT patterns are therefore of interest both as potential novel biomarkers of different diseases and as possible hallmarks of the altered properties these cells acquire, particularly those responsible for perturbing cell growth in vivo.
We have previously documented changes in the RT profiles of human B-ALL (Ryba et al., 2012), but the extent of their specificity or stability has not been previously investigated. Here we report the results for samples from 8 additional ALL patients, 5 of which were also examined after passage and expansion in mice. The RT profiles obtained confirm their disease and patient specificity and further demonstrate their preservation in the derived PDXs. These results thus establish RT as a stable epigenetic property of patient-derived ALL cells that is retained after many cell divisions.
Interestingly, the PDXs derived from B-ALL #4 showed subclone-specific differences in the RT signatures obtained from the cells harvested from different passages of PDXs. In this example, the RT profile of the second passage PDX mirrored that of the primary sample, but the first and third PDXs were different and similar to one another. Tracking CNVs within these same cells revealed a picture of alternating dominant subclones derived from the same patient. This dynamic is similar to a previously reported example of a serially passaged B-ALL in which CNV data also showed that a subclone not initially detectable in the patient’s original sample emerged in the first PDX, and was then followed by re-emergence of the CNV pattern in the original cells in a second passage PDX (Nowak et al., 2015). It is also similar to data obtained for adult AML or colon cancer using Southern blots to track the changing growth dynamics of subclones identified by retroviral insertion sites (Hope et al., 2004; Kreso et al., 2013). Similar data has also been obtained for genetically defined (Eirew et al., 2015) or DNA-barcoded (Nguyen et al., 2014) subclones tracked in PDXs derived from primary samples of human breast cancer or de novo generated human breast cancers (Nguyen et al., 2014). It remains unclear as to whether these dynamic fluctuations in dominant subclones are stochastically or biologically determined since a similar result can be obtained with cell lines that have a very high innate tumorigenic efficiency in the same types of immunodeficient hosts (Nguyen et al., 2014). Regardless, our results demonstrate that RT profiles are a stable epigenetic property of these subclones throughout their dynamic fluctuations.
Taken together, these results underscore the promise of DNA RT of PDXs as a new and promising approach to elucidate the subclonal dynamics that underpin the variable evolution and progression of human ALLs and possibly other human malignancies as and the mechanisms driving these changes.
Supplementary Material
DNA RT profiling methodology for cryopreserved ALL samples and PDXs.
RT is a stable characteristic of patients’ ALL cells and subclone outgrowths.
PDXs can be exploited to study the biological significance of altered RT in ALL
Acknowledgments
We thank R. Didier for assistance with flow cytometry. This work was supported by Bankhead-Coley 2BB04, NIH CA161666 and GM083337 to DMG, a TFRI PPG grant to CJE and APW, and a National Foundation for Cancer Research Fellow Award and Leukemia Lymphoma Society TRP#285855 to CIC. BHC is funded by Hyundai Hope on Wheels and St. Baldrick’s Foundation.
Footnotes
Publisher's Disclaimer: This is a PDF file of an unedited manuscript that has been accepted for publication. As a service to our customers we are providing this early version of the manuscript. The manuscript will undergo copyediting, typesetting, and review of the resulting proof before it is published in its final citable form. Please note that during the production process errors may be discovered which could affect the content, and all legal disclaimers that apply to the journal pertain.
References
- Anderson K, Lutz C, van Delft FW, Bateman CM, Guo Y, Colman SM, Kempski H, Moorman AV, Titley I, Swansbury J, Kearney L, Enver T, Greaves M. Genetic variegation of clonal architecture and propagating cells in leukaemia. Nature. 2011;469:356–361. doi: 10.1038/nature09650. [DOI] [PubMed] [Google Scholar]
- Beer PA, Eaves CJ. Modeling normal and disordered human hematopoiesis. Trends Cancer. 2015;1:199–200. doi: 10.1016/j.trecan.2015.09.002. [DOI] [PubMed] [Google Scholar]
- Dileep V, Didier R, Gilbert DM. Genome-wide analysis of replication timing in mammalian cells: troubleshooting problems encountered when comparing different cell types. Methods. 2012;57:165–169. doi: 10.1016/j.ymeth.2012.05.009. [DOI] [PMC free article] [PubMed] [Google Scholar]
- Dileep V, Rivera-Mulia JC, Sima J, Gilbert DM. Large-Scale Chromatin Structure-Function Relationships during the Cell Cycle and Development: Insights from Replication Timing. Cold Spring Harb Symp Quant Biol. 2015 doi: 10.1101/sqb.2015.80.027284. [DOI] [PubMed] [Google Scholar]
- Eirew P, Steif A, Khattra J, Ha G, Yap D, Farahani H, Gelmon K, Chia S, Mar C, Wan A, Laks E, Biele J, Shumansky K, Rosner J, McPherson A, Nielsen C, Roth AJ, Lefebvre C, Bashashati A, de Souza C, Siu C, Aniba R, Brimhall J, Oloumi A, Osako T, Bruna A, Sandoval JL, Algara T, Greenwood W, Leung K, Cheng H, Xue H, Wang Y, Lin D, Mungall AJ, Moore R, Zhao Y, Lorette J, Nguyen L, Huntsman D, Eaves CJ, Hansen C, Marra MA, Caldas C, Shah SP, Aparicio S. Dynamics of genomic clones in breast cancer patient xenografts at single-cell resolution. Nature. 2015;518:422–426. doi: 10.1038/nature13952. [DOI] [PMC free article] [PubMed] [Google Scholar]
- Gilbert DM. Evaluating genome-scale approaches to eukaryotic DNA replication. Nat Rev Genet. 2010;11:673–684. doi: 10.1038/nrg2830. [DOI] [PMC free article] [PubMed] [Google Scholar]
- Hope KJ, Jin L, Dick JE. Acute myeloid leukemia originates from a hierarchy of leukemic stem cell classes that differ in self-renewal capacity. Nat Immunol. 2004;5:738–743. doi: 10.1038/ni1080. [DOI] [PubMed] [Google Scholar]
- Irving JA, Enshaei A, Parker CA, Sutton R, Kuiper RP, Erhorn A, Minto L, Venn NC, Law T, Yu J, Schwab C, Davies R, Matheson E, Davies A, Sonneveld E, den Boer ML, Love SB, Harrison CJ, Hoogerbrugge PM, Revesz T, Saha V, Moorman AV. Integration of genetic and clinical risk factors improves prognostication in relapsed childhood B-cell precursor acute lymphoblastic leukemia. Blood. 2016;128:911–922. doi: 10.1182/blood-2016-03-704973. [DOI] [PMC free article] [PubMed] [Google Scholar]
- Kreso A, O'Brien CA, van Galen P, Gan OI, Notta F, Brown AM, Ng K, Ma J, Wienholds E, Dunant C, Pollett A, Gallinger S, McPherson J, Mullighan CG, Shibata D, Dick JE. Variable clonal repopulation dynamics influence chemotherapy response in colorectal cancer. Science. 2013;339:543–548. doi: 10.1126/science.1227670. [DOI] [PMC free article] [PubMed] [Google Scholar]
- Lawrence MS, Stojanov P, Polak P, Kryukov GV, Cibulskis K, Sivachenko A, Carter SL, Stewart C, Mermel CH, Roberts SA, Kiezun A, Hammerman PS, McKenna A, Drier Y, Zou L, Ramos AH, Pugh TJ, Stransky N, Helman E, Kim J, Sougnez C, Ambrogio L, Nickerson E, Shefler E, Cortes ML, Auclair D, Saksena G, Voet D, Noble M, DiCara D, Lin P, Lichtenstein L, Heiman DI, Fennell T, Imielinski M, Hernandez B, Hodis E, Baca S, Dulak AM, Lohr J, Landau DA, Wu CJ, Melendez-Zajgla J, Hidalgo-Miranda A, Koren A, McCarroll SA, Mora J, Lee RS, Crompton B, Onofrio R, Parkin M, Winckler W, Ardlie K, Gabriel SB, Roberts CW, Biegel JA, Stegmaier K, Bass AJ, Garraway LA, Meyerson M, Golub TR, Gordenin DA, Sunyaev S, Lander ES, Getz G. Mutational heterogeneity in cancer and the search for new cancer-associated genes. Nature. 2013;499:214–218. doi: 10.1038/nature12213. [DOI] [PMC free article] [PubMed] [Google Scholar]
- Lochovsky L, Zhang J, Fu Y, Khurana E, Gerstein M. LARVA: an integrative framework for large-scale analysis of recurrent variants in noncoding annotations. Nucleic Acids Res. 2015;43:8123–8134. doi: 10.1093/nar/gkv803. [DOI] [PMC free article] [PubMed] [Google Scholar]
- Medyouf H, Gao X, Armstrong F, Gusscott S, Liu Q, Gedman AL, Matherly LH, Schultz KR, Pflumio F, You MJ, Weng AP. Acute T-cell leukemias remain dependent on Notch signaling despite PTEN and INK4A/ARF loss. Blood. 2010;115:1175–1184. doi: 10.1182/blood-2009-04-214718. [DOI] [PMC free article] [PubMed] [Google Scholar]
- Miller PH, Rabu G, MacAldaz M, Knapp DJ, Cheung AM, Dhillon K, Nakamichi N, Beer PA, Shultz LD, Humphries RK, Eaves CJ. Analysis of parameters that affect human hematopoietic cell outputs in mutant c-kit-immunodeficient mice. Exp Hematol. 2017 doi: 10.1016/j.exphem.2016.12.012. [DOI] [PMC free article] [PubMed] [Google Scholar]
- Morisot S, Wayne AS, Bohana-Kashtan O, Kaplan IM, Gocke CD, Hildreth R, Stetler-Stevenson M, Walker RL, Davis S, Meltzer PS, Wheelan SJ, Brown P, Jones RJ, Shultz LD, Civin CI. High frequencies of leukemia stem cells in poor-outcome childhood precursor-B acute lymphoblastic leukemias. Leukemia. 2010;24:1859–1866. doi: 10.1038/leu.2010.184. [DOI] [PMC free article] [PubMed] [Google Scholar]
- Nguyen LV, Cox CL, Eirew P, Knapp DJ, Pellacani D, Kannan N, Carles A, Moksa M, Balani S, Shah S, Hirst M, Aparicio S, Eaves CJ. DNA barcoding reveals diverse growth kinetics of human breast tumour subclones in serially passaged xenografts. Nat Commun. 2014;5:5871. doi: 10.1038/ncomms6871. [DOI] [PMC free article] [PubMed] [Google Scholar]
- Notta F, Mullighan CG, Wang JC, Poeppl A, Doulatov S, Phillips LA, Ma J, Minden MD, Downing JR, Dick JE. Evolution of human BCR-ABL1 lymphoblastic leukaemia-initiating cells. Nature. 2011;469:362–367. doi: 10.1038/nature09733. [DOI] [PubMed] [Google Scholar]
- Nowak D, Liem NL, Mossner M, Klaumunzer M, Papa RA, Nowak V, Jann JC, Akagi T, Kawamata N, Okamoto R, Thoennissen NH, Kato M, Sanada M, Hofmann WK, Ogawa S, Marshall GM, Lock RB, Koeffler HP. Variegated clonality and rapid emergence of new molecular lesions in xenografts of acute lymphoblastic leukemia are associated with drug resistance. Exp Hematol. 2015;43:32–43. e31–35. doi: 10.1016/j.exphem.2014.09.007. [DOI] [PMC free article] [PubMed] [Google Scholar]
- Pal D, Blair HJ, Elder A, Dormon K, Rennie KJ, Coleman DJ, Weiland J, Rankin KS, Filby A, Heidenreich O, Vormoor J. Long-term in vitro maintenance of clonal abundance and leukaemia-initiating potential in acute lymphoblastic leukaemia. Leukemia. 2016;30:1691–1700. doi: 10.1038/leu.2016.79. [DOI] [PMC free article] [PubMed] [Google Scholar]
- Polak P, Karlic R, Koren A, Thurman R, Sandstrom R, Lawrence MS, Reynolds A, Rynes E, Vlahovicek K, Stamatoyannopoulos JA, Sunyaev SR. Cell-of-origin chromatin organization shapes the mutational landscape of cancer. Nature. 2015;518:360–364. doi: 10.1038/nature14221. [DOI] [PMC free article] [PubMed] [Google Scholar]
- Pope BD, Ryba T, Dileep V, Yue F, Wu W, Denas O, Vera DL, Wang Y, Hansen RS, Canfield TK, Thurman RE, Cheng Y, Gulsoy G, Dennis JH, Snyder MP, Stamatoyannopoulos JA, Taylor J, Hardison RC, Kahveci T, Ren B, Gilbert DM. Topologically associating domains are stable units of replication-timing regulation. Nature. 2014;515:402–405. doi: 10.1038/nature13986. [DOI] [PMC free article] [PubMed] [Google Scholar]
- Rivera-Mulia JC, Buckley Q, Sasaki T, Zimmerman J, Didier RA, Nazor K, Loring JF, Lian Z, Weissman SM, Robins AJ, Schulz TC, Menendez L, Kulik MJ, Dalton S, Gabr H, Kahveci T, Gilbert DM. Dynamic changes in replication timing and gene expression during lineage specification of human pluripotent stem cells. Genome Res. 2015 doi: 10.1101/gr.187989.114. [DOI] [PMC free article] [PubMed] [Google Scholar]
- Rivera-Mulia JC, Gilbert DM. Replicating Large Genomes: Divide and Conquer. Mol Cell. 2016a;62:756–765. doi: 10.1016/j.molcel.2016.05.007. [DOI] [PMC free article] [PubMed] [Google Scholar]
- Rivera-Mulia JC, Gilbert DM. Replication timing and transcriptional control: beyond cause and effect-part III. Curr Opin Cell Biol. 2016b;40:168–178. doi: 10.1016/j.ceb.2016.03.022. [DOI] [PMC free article] [PubMed] [Google Scholar]
- Ryba T, Battaglia D, Chang BH, Shirley JW, Buckley Q, Pope BD, Devidas M, Druker BJ, Gilbert DM. Abnormal developmental control of replication-timing domains in pediatric acute lymphoblastic leukemia. Genome Res. 2012;22:1833–1844. doi: 10.1101/gr.138511.112. [DOI] [PMC free article] [PubMed] [Google Scholar]
- Ryba T, Battaglia D, Pope BD, Hiratani I, Gilbert DM. Genome-scale analysis of replication timing: from bench to bioinformatics. Nat Protoc. 2011;6:870–895. doi: 10.1038/nprot.2011.328. [DOI] [PMC free article] [PubMed] [Google Scholar]
- Saldanha AJ. Java Treeview--extensible visualization of microarray data. Bioinformatics. 2004;20:3246–3248. doi: 10.1093/bioinformatics/bth349. [DOI] [PubMed] [Google Scholar]
- Shlush LI, Zandi S, Mitchell A, Chen WC, Brandwein JM, Gupta V, Kennedy JA, Schimmer AD, Schuh AC, Yee KW, McLeod JL, Doedens M, Medeiros JJ, Marke R, Kim HJ, Lee K, McPherson JD, Hudson TJ, Brown AM, Yousif F, Trinh QM, Stein LD, Minden MD, Wang JC, Dick JE HP-LGP Consortium. Identification of pre-leukaemic haematopoietic stem cells in acute leukaemia. Nature. 2014;506:328–333. doi: 10.1038/nature13038. [DOI] [PMC free article] [PubMed] [Google Scholar]
- Shugay M, Ortiz de Mendibil I, Vizmanos JL, Novo FJ. Genomic hallmarks of genes involved in chromosomal translocations in hematological cancer. PLoS Comput Biol. 2012;8:e1002797. doi: 10.1371/journal.pcbi.1002797. [DOI] [PMC free article] [PubMed] [Google Scholar]
- Sima J, Gilbert DM. Complex correlations: replication timing and mutational landscapes during cancer and genome evolution. Curr Opin Genet Dev. 2014;25:93–100. doi: 10.1016/j.gde.2013.11.022. [DOI] [PMC free article] [PubMed] [Google Scholar]
- Supek F, Lehner B. Differential DNA mismatch repair underlies mutation rate variation across the human genome. Nature. 2015;521:81–84. doi: 10.1038/nature14173. [DOI] [PMC free article] [PubMed] [Google Scholar]
- Voichek Y, Bar-Ziv R, Barkai N. Expression homeostasis during DNA replication. Science. 2016;351:1087–1090. doi: 10.1126/science.aad1162. [DOI] [PubMed] [Google Scholar]
- Woo YH, Li WH. DNA replication timing and selection shape the landscape of nucleotide variation in cancer genomes. Nat Commun. 2012;3:1004. doi: 10.1038/ncomms1982. [DOI] [PubMed] [Google Scholar]
Associated Data
This section collects any data citations, data availability statements, or supplementary materials included in this article.