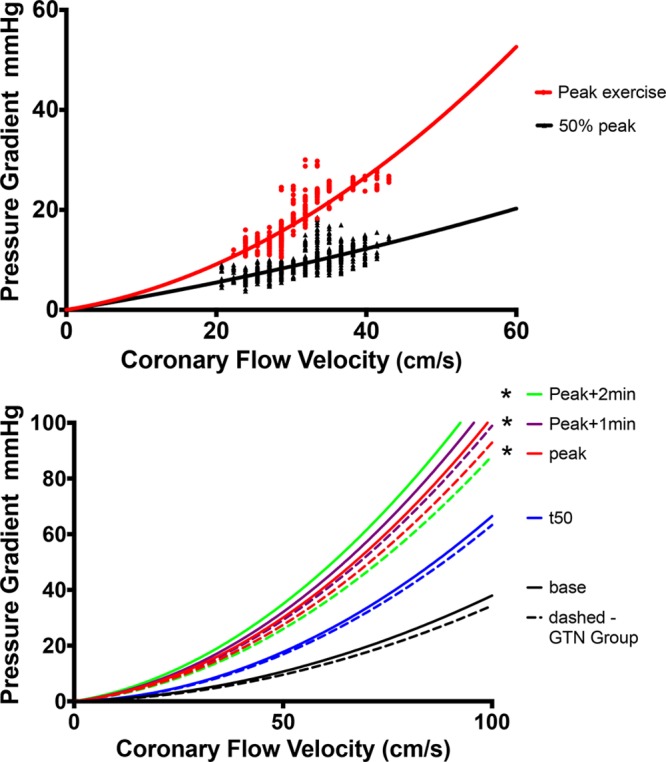
Figure 6.

Diastolic coronary velocity–pressure gradient relation. Top, Two time points: 50% of peak exercise (t50) and peak exercise recordings in 1 individual. Bottom, Regression lines that arise from aggregating the k and S coefficients from recordings in all patients. Solid lines represent the control group; dashed lines, those who received nitroglycerin (GTN). Black line indicates baseline; blue, t50; red, peak; purple, 1 minute after peak; and green, 2 minutes after peak. *Statistically significant difference vs baseline of the k coefficient (Table 4 lists all the coefficients).
