Abstract
The presence of multiple or diffuse lesions on imaging is a contraindication to surgery for patients with intractable epilepsy. Theoretically, as a functional imaging technique, electrical impedance tomography (EIT) can accurately image epileptic foci. However, most current studies are limited to examining epileptic spikes and few studies use EIT for real-time imaging of seizure activity. Moreover, little is known about changes in electrical impedance during seizures. In this study, we used EIT to monitor seizure progression in real time and analyzed changes in electrical impedance during seizures. EIT and electroencephalography data were recorded simultaneously in rats. Sixty-three seizures were recorded from the cortices of eight rats. During 54 seizures, the average impedance decreased by between 4.86 and 9.17% compared with the baseline. Compared with the control group, the average impedance of the experimental group decreased significantly (P=0.004). Our results indicate that EIT can be used to detect and image electrical impedance reduction within lesions during epileptic seizures.
Keywords: electrical impedance tomography, electrical impedance, electroencephalography, epileptic seizure, penicillin
Introduction
The presence of multiple or diffuse lesions on imaging is a contraindication to surgery for intractable epilepsy 1. Several imaging modalities, such as computed tomography (CT), MRI, and PET, can be used to identify epileptogenic lesions. However, these techniques have certain limitations. CT has significantly lower sensitivity in detecting typical brain pathologies. CT and MRI can locate structurally abnormal, but not functional lesions. PET requires the use of scanners, which is impractical for continuous monitoring. Single-photon emission computed tomography (SPECT) is used widely to measure regional cerebral blood flow (rCBF) and is an accepted adjunctive technique in the presurgical evaluation of patients with refractory focal seizures 2. However, with SPECT, radioisotopes are administered by injection following seizure onset, reflecting a delayed increase in rCBF associated with seizures 3. Clearly, a better imaging technique is needed for presurgery screening of intractable epilepsy.
Electrical impedance tomography (EIT) is a functional imaging technique that can generate cross-sectional images of electrical properties within the body associated with functional changes in tissues or organs. EIT is a safe, noninvasive, radiation-free, and portable medical imaging technique that provides continuous bedside monitoring of various physiological and pathological processes 4,5.
Until 1994, EIT had not been used to image local variations in brain impedance 6. Since then, it has been used to image functional changes associated with seizures 7–10. However, most current studies are limited to examining epileptic spikes and few studies use EIT for real-time imaging of seizures activity. Moreover, we do not know much about changes in electrical impedance during seizures.
In this study, we measured impedance changes related to epileptic activity from electrodes applied to the rat cortex. For 24 h, we simultaneously recorded EIT and electroencephalography (EEG) data using two sets of electrodes to collect data during unpredictable, spontaneous epileptic seizures. To minimize the impact of other factors (e.g. skull and scalp) on data quality, electrodes were directly placed on the cortex.
Methods
Animals
Twenty adult male Sprague–Dawley rats weighing 280–320 g were divided into experimental (n=10) and control (n=10) groups. The rats were housed in an approved animal care facility. All experimental procedures involving the animals were approved by the Ethics Committee of the Fourth Military Medical University, Xi’an, People’s Republic of China, and are in accordance with NIH guidelines on the care and use of animals.
Surgical procedure
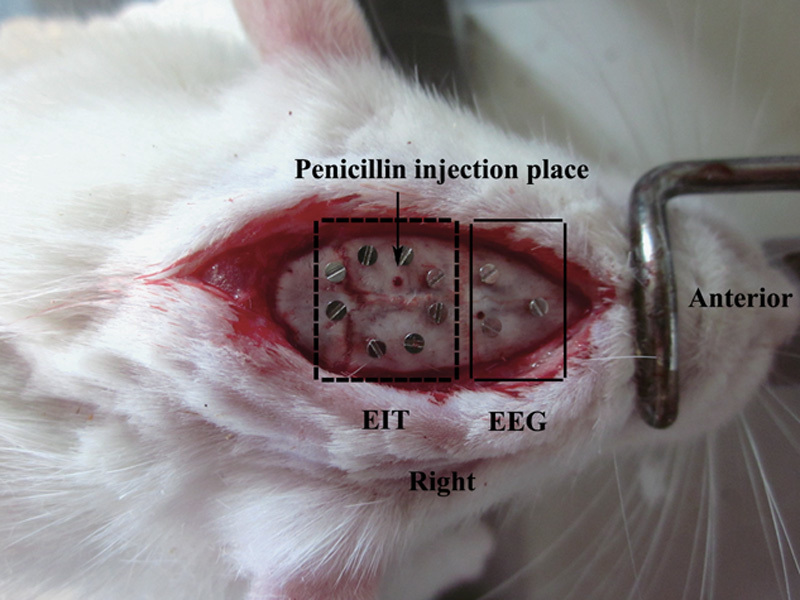
We anesthetized the rats with 1% pentobarbital-sodium (60 mg/kg) administered intraperitoneally. Following anesthesia, we periodically assessed consciousness by reaction to a toe pinch stimulus. We attached the rats to a stereotaxic animal frame and made a midline incision along the scalp to expose the skull. We placed eight sterilized screw electrodes (diameter: 0.3 mm) on each rat’s head and spaced them equally in a ring arrangement EIT recording. As rat heads are small, only three electrodes were used to record the EEG data. We placed two electrodes over the frontal cortex 2 mm lateral to the midline (Fp1) and 2 mm anterior to the bregma (Fp2). We placed the reference electrode (A1) epidurally 7 mm anterior to the bregma at the midline (Fig. 1). Inside the electrode ring, we drilled a hole into the skull at a half-radius distance from an electrode and injected penicillin (3 μl, 4 IU/ml) with a microinjection syringe 2.3 mm below the skull at a rate of 1 μl/min. The needle remained in place for 5 min after administration. The electrodes were fixed in place with dental resin. We used the EEG acquisition system to continuously monitor each animal for 1 h and confirm that the epilepsy model had been established successfully. Rats in the control group were subjected to the same treatment as those in the experimental group; however, a saline solution was administered to these animals.
Fig. 1.

Electrode positions for electrical impedance tomography (EIT) and electroencephalography (EEG) imaging. EIT and EEG electrodes are in the dashed box and the nondashed box, respectively.
Electrical impedance tomography system protocol and raw data selection
A software filter based on an fMRI artifact subtraction method was applied to the EEG signal to eliminate any residual noise artifacts 9. The eight-electrode EIT system (FMEIT-5-8) was specifically designed by our group to provide images during seizures in rats. To obtain good sensitivity and signal-to-noise ratio, we used an opposite-drive, adjacent-measurement protocol 11 for data acquisition with a sinusoidal current (50 kHz, 0.5 mA). We reconstructed EIT images using the damped least-squares algorithm 12. During EIT monitoring, images were acquired at 1 fps.
Data analysis
We only analyzed electrical impedance changes during seizures that lasted longer than 15 s and had long interictal durations before and after seizure activity. We established the test baseline (i.e. interictal period) as any impedance less than 2% of the mean value of the experimental baseline (i.e. all baseline values, except epileptic seizures). Within a region of interest of the EIT images, the average resistivity values (ARV) were calculated to quantify resistivity changes caused by seizures as follows:
 |
where, xk is the resistivity reconstructed for the kth element, Ak is the area of the kth element, and N is the total number of seizure elements. A seizure element was identified using the reconstructed resistivity values and calculated according to the following relationship:
where, xpeak is the peak value of all of the elements and t is the threshold parameter.
Results
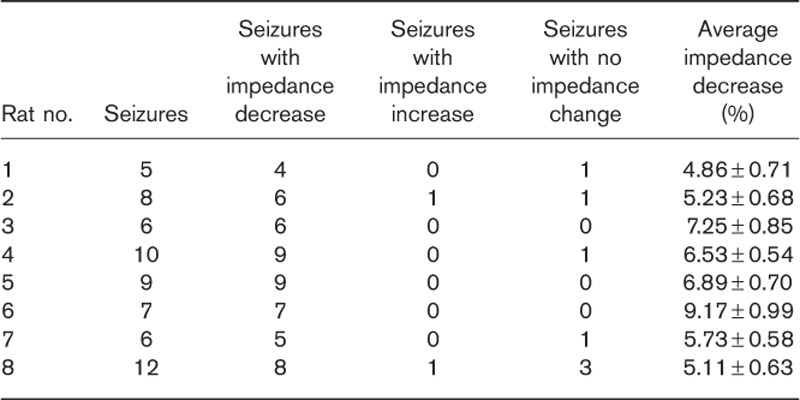
We excluded two rats from the experimental group because of the absence of EEG brain waves associated with seizure attacks or electrodes falling off. Throughout the experiment, we observed a gradual decrease in impedance in all rats. We analyzed 63 seizures in eight rats. Impedance decreased within the epileptic focus in 54 (85.71%) seizures and increased in two seizures. In seven seizures, there was no obvious change in impedance. On average, impedance decreased between 4.86 and 9.17% compared with the baseline (Table 1).
Table 1.
Impedance changes detected by electrical impedance tomography in the experimental group

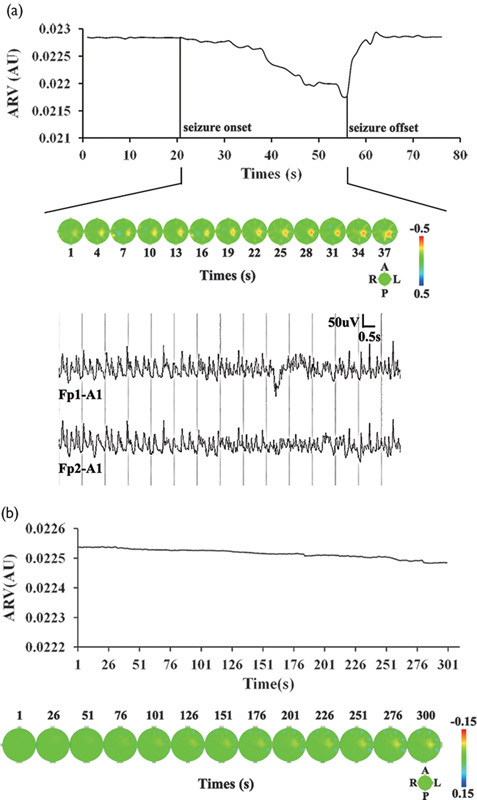
The ictal process was investigated on the basis of the identification of typical seizure patterns preceding clinically manifest seizures in cortical EEG recordings by visual inspection by experienced epileptologists. EIT and EEG data were simultaneously recorded in each rat. We can observe the changes in electrical impedance at the same time after determining the ictal period of seizures. Figure 2a shows the ARV before, during, and after seizure activity. ARV remained at baseline until seizure onset, began to decline as the seizure started, and reached its peak at the end of the seizure. Following seizure activity, ARV rapidly increased to a level slightly higher than that preceding the seizure. In Fig. 2a, EIT images (21–57 s) and the simultaneously recorded EEG segment during a seizure are also presented. With the onset of seizure activity, the electrical impedance at the epileptic foci gradually decreases and reaches its minimum at the end of the seizure.
Fig. 2.

(a) Average resistivity value and reconstructed impedance changes in an experimental rat (no. 2). Plots of the average resistivity value against time (top). Seizure onset and offset are marked by vertical solid lines. Reconstructed impedance changes during ictal activity (middle). At the middle right, image orientation is indicated in the diagram with the directions, anterior (A), left (L), posterior (P), and right (R). The spectral bar on the right represents resistivity states and associated colors, from decreased resistivity (red) to normal baseline intensity (green) to increased resistivity (blue). The numbers, 0.5 and −0.5, are the upper and lower limits of the resistivity values, respectively. Simultaneously recorded EEG segment during the ictal period from Fp1 and Fp2 electrodes (bottom). (b) Reconstruction of impedance changes in a control rat (no. 5; top) and plots of the corresponding average resistivity value against time (bottom).
In the control group, electrical impedance decreased slightly with a saline solution injection. The maximum amplitude fluctuation was under 1.00% for the control group. Following injection, there was no obvious change in electrical impedance (Fig. 2b).
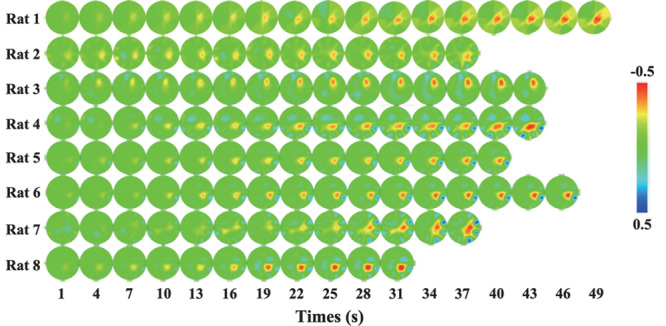
The average impedance decrease of the two groups was compared using one-way analysis of variance. There was a significant difference between the experimental and control groups (F=16.41, P=0.004). In experimental rats, impedance decreased gradually during a seizure and reached a minimum at the end of the seizure (Fig. 3). Following seizure activity, the impedance returned to the interictal baseline or increased to a level above the baseline.
Fig. 3.

Tomographic images of impedance changes showing the onset and progression of seizure activity in eight rats.
Discussion
In the present study, we investigated impedance changes during seizures in rats to determine the sensitivity of EIT when used concurrently with EEG, but recording from separate electrodes. We injected rats with penicillin to stimulate seizures. Penicillin-induced epilepsy is a well-known experimental epilepsy model 13. We observed generalized tonic–clonic seizures within 20–30 min following penicillin injection. We also noted characteristic epileptic EEG waves, which confirmed that the epilepsy model had been established successfully. The presence of EEG spikes also ensured that the impedance changes detected by EIT were caused by seizures.
To eliminate distortion of the EEG recording because of simultaneous EIT recording, we interposed a low-pass filter before the EEG amplifiers and a high-pass filter after the EIT switches. We also used a software filter developed by Fabrizi et al. 9, which uses individual sequential EEG channel processing without EIT artifact scaling. Our results show that EIT can be used simultaneously with EEG and this technique effectively tracks the propagation of epileptic activity.
In this study, the EIT was used with a measuring current of 5 mA at 50 kHz. According to a previous study 14, a lower frequency for the measuring current during seizures might be expected to produce larger changes and less error, but the amount of current that may be injected according to safety standards increases up to 50 kHz 7. Therefore, the optimal frequency for imaging seizures was estimated to be 50 kHz. Moreover, a higher signal-to-noise ratio could be obtained for a seizure measurement at 50 kHz with a current of 5 mA 15.
We analyzed seizure segments that lasted longer than 15 s, which was a suitable duration for epileptic EEG monitoring. We found that electrical impedance decreased during most seizures (85.71%) and that the changes could be localized to the penicillin injection site. Moreover, during two seizures, the impedance increased in the epileptic focus, whereas there was no change in impedance during seven seizures. There are a few potential factors that may have affected the recorded impedance. During seizures, movement artifacts may have caused apparent resistivity changes because of varied contact between the electrodes and the brain. Moreover, stimulus artifacts within certain recordings may have altered the electrode contact resistivity, potentially causing a small voltage distortion if current-driving electrodes were not ideal (Ideal conditions for current-driving electrodes are associated with the material comprising the electrode, electrode size and dimensions, skin conditions upon electrode connection, temperature, humidity, and other factors.).
The present report characterizes the slow decrease in cortical impedance that occurs during seizures. We describe the potential causes of impedance reduction during seizures next. It has long been suggested that the electrical impedance of brain tissue may be correlated with seizure states. The hemodynamic patterns of patients suffering from seizures have been well documented. During the ictal state, the epileptic focus is characterized by local increases in rCBF and metabolism 16,17. Some studies have shown that during seizures, the relative increase in CBF is greater than that in cerebral metabolism 18,19. Increased CBF can adequately meet the increased metabolic demands of epilepsy. Therefore, an increase in CBF at the epileptic focus could elicit a local decrease in electrical impedance.
Ion migration is another mechanism that could induce changes in impedance. However, in this experiment, penicillin was injected into the head to model epilepsy. This approach produces a model that is more representative of traumatic seizures. In model animals, cells within the traumatic epilepsy lesion site were destroyed, which may have reduced cell swelling associated with sodium ion influx. However, the brain vascular system and blood flow were not affected in these animals. The overall impedance measured would be the sum of the opposing impedance changes because of cell swelling and increased CBF 20. Thus, we infer that impedance changes induced by cell swelling are relatively small compared with those induced by CBF during seizures. Tissue impedance may also depend on the EIT signal frequency. Electrical impedance increases may be less impacted by cell swelling at 50 kHz than at other frequencies. Consequently, electrical impedance would decrease during seizures.
Conclusion
We measured changes in electrical impedance during seizures using EIT and EEG simultaneously. Our results suggest that electrical impedance decreased during the ictal period until the end of the seizure. Following a seizure, impedance increased to interictal period levels or higher. Our results indicate that EIT can be effectively used to track the propagation of epileptic activity.
Acknowledgements
This work was supported in part by the China Postdoctoral Science Foundation Funded Project under Grant 2014M562543, in part by the National Science and Technology Pillar Program during the 12th 5-year Plan Period under Grants 2012BAI20B02 and 2011BAI08B13.
Conflicts of interest
There are no conflicts of interest.
Footnotes
*Lei Wang and Yang Sun contributed equally to the writing of this article.
References
- 1.Spencer S, Huh L. Outcomes of epilepsy surgery in adults and children. Lancet Neurol 2008; 7:525–537. [DOI] [PubMed] [Google Scholar]
- 2.O’Brien TJ, So EL, Mullan BP, Hauser MF, Brinkmann BH, Bohnen NI, et al. Subtraction ictal SPECT co-registered to MRI improves clinical usefulness of SPECT in localizing the surgical seizure focus. Neurology 1998; 50:445–454. [DOI] [PubMed] [Google Scholar]
- 3.la Fougère C, Rominger A, Förster S, Geisler J, Bartenstein P. PET and SPECT in epilepsy: a critical review. Epilepsy Behav 2009; 15:50–55. [DOI] [PubMed] [Google Scholar]
- 4.Xu CH, Wang L, Shi XT, You FS, Fu F, Liu RG, et al. Real-time imaging and detection of intracranial haemorrhage by electrical impedance tomography in a piglet model. J Int Med Res 2010; 38:1596–1604. [DOI] [PubMed] [Google Scholar]
- 5.Abascal JF, Arridge SR, Bayford RH, Holder DS. Comparison of methods for optimal choice of the regularization parameter for linear electrical impedance tomography of brain function. Physiol Meas 2008; 29:1319–1334. [DOI] [PubMed] [Google Scholar]
- 6.Boone K, Lewis AM, Holder DS. Imaging of cortical spreading depression by EIT: implications for localization of epileptic foci. Physiol Meas 1994; 15 (Suppl 2a): A189–A198. [DOI] [PubMed] [Google Scholar]
- 7.Fabrizi L, McEwan A, Oh T, Woo EJ, Holder DS. A comparison of two EIT systems suitable for imaging impedance changes in epilepsy. Physiol Meas 2009; 30:S103–S120. [DOI] [PubMed] [Google Scholar]
- 8.Fabrizi L, McEwan A, Woo E, Holder DS. Analysis of resting noise characteristics of three EIT systems in order to compare suitability for time difference imaging with scalp electrodes during epileptic seizures. Physiol Meas 2007; 28:S217–S236. [DOI] [PubMed] [Google Scholar]
- 9.Fabrizi L, Yerworth R, McEwan A, Gilad O, Bayford R, Holder DS. A method for removing artefacts from continuous EEG recordings during functional electrical impedance tomography for the detection of epileptic seizures. Physiol Meas 2010; 31:S57–S72. [DOI] [PubMed] [Google Scholar]
- 10.Vongerichten AN, dos Santos GS, Aristovich K, Avery J, McEvoy A, Walker M, et al. Characterisation and imaging of cortical impedance changes during interictal and ictal activity in the anaesthetised rat. Neuroimage 2016; 124:813–823. [DOI] [PMC free article] [PubMed] [Google Scholar]
- 11.Shi X, Dong X, Shuai W, You F, Fu F, Liu R. Pseudo-polar drive patterns for brain electrical impedance tomography. Physiol Meas 2006; 27:1071–1080. [DOI] [PubMed] [Google Scholar]
- 12.Xu C, Dai M, You F, Shi X, Fu F, Liu R, et al. An optimized strategy for real-time hemorrhage monitoring with electrical impedance tomography. Physiol Meas 2011; 32:585–598. [DOI] [PubMed] [Google Scholar]
- 13.Silfverhuth MJ, Kortelainen J, Ruohonen J, Suominen K, Niinimaki J, Sonkajarvi E, et al. A characteristic time sequence of epileptic activity in EEG during dynamic penicillin-induced focal epilepsy: a preliminary study. Seizure 2011; 20:513–519. [DOI] [PubMed] [Google Scholar]
- 14.Fabrizi L, Sparkes M, Horesh L, Perez-Juste Abascal JF, McEwan A, Bayford RH, et al. Factors limiting the application of electrical impedance tomography for identification of regional conductivity changes using scalp electrodes during epileptic seizures in humans. Physiol Meas 2006; 27:S163–S174. [DOI] [PubMed] [Google Scholar]
- 15.Fabrizi L, Horesh L, McEwan A, Holder DS. A feasibility study for imaging of epileptic seizures by EIT using a realistic FEM of the head. In: IFMBE proceedings of the world congress on medical physics and biomedical engineering (2006 COEX Seoul, Korea), vol. 14; 2006. pp. 3874–3877.
- 16.Tae WS, Joo EY, Kim JH, Han SJ, Suh YL, Kim BT, et al. Cerebral perfusion changes in mesial temporal lobe epilepsy: SPM analysis of ictal and interictal SPECT. Neuroimage 2005; 24:101–110. [DOI] [PubMed] [Google Scholar]
- 17.Goto Y, Araki T, Kato M, Fukui M. Propagation of hippocampal seizure activity arising from the hippocampus: a local cerebral blood flow study. Brain Res 1994; 634:203–213. [DOI] [PubMed] [Google Scholar]
- 18.Ingvar M. Cerebral blood flow and metabolic rate during seizures. Relationship to epileptic brain damage. Ann N Y Acad Sci 1986; 462:194–206. [DOI] [PubMed] [Google Scholar]
- 19.Tanaka S, Sako K, Tanaka T, Nishihara I, Yonemasu Y. Uncoupling of local blood flow and metabolism in the hippocampal CA3 in kainic acid-induced limbic seizure status. Neuroscience 1990; 36:339–348. [DOI] [PubMed] [Google Scholar]
- 20.Tidswell T, Gibson A, Bayford RH, Holder DS. Three-dimensional electrical impedance tomography of human brain activity. Neuroimage 2001; 13:283–294. [DOI] [PubMed] [Google Scholar]


