Abstract
IL-36 cytokines are proinflammatory and have an important role in innate and adaptive immunity, but the role of IL-36 signaling in renal tubulointerstitial lesions (TILs), a major prognostic feature of renal inflammation and fibrosis, remains undetermined. In this study, increased IL-36α expression detected in renal biopsy specimens and urine samples from patients with renal TILs correlated with renal function impairment. We confirmed the increased expression of IL-36α in the renal tubular epithelial cells of a mouse model of unilateral ureteral obstruction (UUO) and related cell models using mechanically induced pressure, oxidative stress, or high mobility group box 1. In contrast, the kidneys of IL-36 receptor (IL-36R) knockout mice exhibit attenuated TILs after UUO. Compared with UUO-treated wild-type mice, UUO-treated IL-36 knockout mice exhibited markedly reduced NLRP3 inflammasome activation and macrophage/T cell infiltration in the kidney and T cell activation in the renal draining lymph nodes. In vitro, recombinant IL-36α facilitated NLRP3 inflammasome activation in renal tubular epithelial cells, macrophages, and dendritic cells and enhanced dendritic cell–induced T cell proliferation and Th17 differentiation. Furthermore, deficiency of IL-23, which was diminished in IL-36R knockout UUO mice, also reduced renal TIL formation in UUO mice. In wild-type mice, administration of an IL-36R antagonist after UUO reproduced the results obtained in UUO-treated IL-36R knockout mice. We propose that IL-36 signaling contributes to the pathogenesis of renal TILs through the activation of the NLRP3 inflammasome and IL-23/IL-17 axis.
Keywords: IL-36α, IL-36 receptor, IL-36 receptor antagonist, knockout mice, patients’ samples, unilateral ureteral obstruction
A new member of IL-1 family—IL-36 receptor (IL-36R) agonists—which consists of IL-36α (IL-1F6), IL-36β (IL-1F8), and IL-36γ (IL-1F9), is involved in the dysregulated signaling pathways involved in several inflammatory diseases, such as psoriasis, or pneumonia.1–5 These cytokines activate NF-κB and its dependent inflammatory pathways through IL-36R and IL-1 receptor accessory protein.1,6 In addition, NLRP3 inflammasome mediates the activation of caspase-1, which cleaves pro–IL-1β and pro–IL-18 to form mature IL-1β and IL-18.7
Although the pathogenesis of most types of CKD remains largely unknown, proinflammatory and profibrotic factors, such as IL-1, TNF-α, monocyte chemotactic peptide-1, and TGF-β, secreted from either inflammatory cells or renal resident cells are implicated in the development and progression of CKD.8,9 Renal tubulointerstitial lesions (TILs) have been considered a major prognostic feature of renal inflammation and fibrosis in CKD.10–13
Although overexpression of IL-36α locally in the kidney has been implicated in several mouse models of nephropathy,14 the causal relationship between IL-36 signaling and its related renal lesions of the animal models has yet to be determined. In this study, we showed that (1) increased IL-36α levels in renal tissues and urine samples were detected in patients with renal TILs, (2) induced expression of IL-36α in renal tubules was observed in a mouse unilateral ureteral obstruction (UUO) model, and (3) greatly increased expression of IL-36α in renal tubular epithelial cells (TECs) under mechanically induced pressure or incubation with H2O2 and high mobility group box 1 (HMGB-1) was observed. In contrast, IL-36R deficiency prevented renal TILs in UUO mice. Furthermore, mechanistic investigations in vitro and/or in vivo show that IL-36 signaling enhanced (1) NLRP3 inflammasome activation, (2) bone marrow–derived dendritic cells (BMDCs)–mediated T cell proliferation and T helper 17 cell (Th17) differentiation, and (3) activation of the IL-23/IL-17 axis. The IL-36 signaling pathway may be a potential target for medical intervention for renal inflammation and fibrosis.
Results
IL-36α Levels Were Increased in Renal Tissues and Urine Samples from Patients with Renal TILs
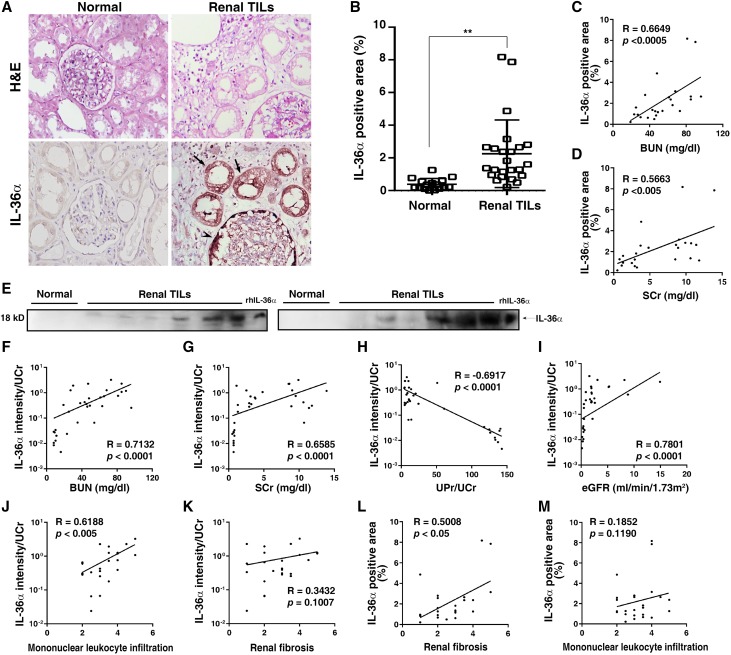
IL-36α was increased in injured murine renal TECs in various models that mimic CKD14; thus, we recruited patients whose renal biopsy specimens were classified as TIL under routine pathologic diagnosis. As shown in Figure 1, A and B, IL-36α was strikingly expressed in atrophic renal tubules and parietal epithelial cells of Bowman’s capsule relative to those of normal control subjects. The magnitudes of IL-36α in renal tissues were significantly positively correlated to BUN (Figure 1C) and serum creatinine (SCr) (Figure 1D). In parallel, urine levels of IL-36α were increased in patients with renal TILs (Figure 1E). The urinary creatinine-normalized IL-36α levels were significantly positively correlated to BUN (Figure 1F), SCr (Figure 1G), and urinary protein/urinary creatinine (Figure 1H) but negatively correlated to eGFR (Figure 1I). In addition, the urine level of IL-36α is highly correlated with the degree of mononuclear leukocyte infiltration in the kidney (Figure 1J), although the correlation between the level of the protein and extent of renal fibrosis was not statistically significant (Figure 1K). However, renal expression levels of IL-36α are significantly correlated with the extent of renal fibrosis (Figure 1L), although the correlation between the level of the protein and extent of mononuclear leukocyte infiltration in the kidney was not statistically significant (Figure 1M). All of the data reported above suggest that the increased production of IL-36α in these patients is involved in the evolution of their renal TILs of inflammation and fibrosis.
Figure 1.
IL-36α levels were increased in renal tissues and urine samples from patients with renal TILs. (A) IHC analysis of renal IL-36α expression; arrows indicate IL-36α–positive tubules, and the arrowhead indicates IL-36α–positive Bowman’s capsule parietal epithelial cells. Original magnification, ×400. (B) Quantitative analysis. Error bars indicate ±SEM. **P<0.01. Relationships (R values) between renal IL-36α (percentage) and (C) BUN or (D) SCr. (E) Representative Western blots for IL-36α in urine. Relationships between urinary IL-36α intensities/urine creatinine (UCr) and (F) BUN, (G) SCr, (H) urine protein (UPr)/UCr, (I) eGFR, (J) mononuclear leukocytes infiltration scores, or (K) renal fibrosis scores. Relationships between renal IL-36α (percentage) and (L) renal fibrosis scores or (M) mononuclear leukocytes infiltration scores. H&E, hematoxylin and eosin; rhIL-36α, recombinant human IL-36α.
IL-36α Expression in the Diseased Kidney of UUO Mice and Renal TECs
Induced IL-36α Expression in Renal Tubules
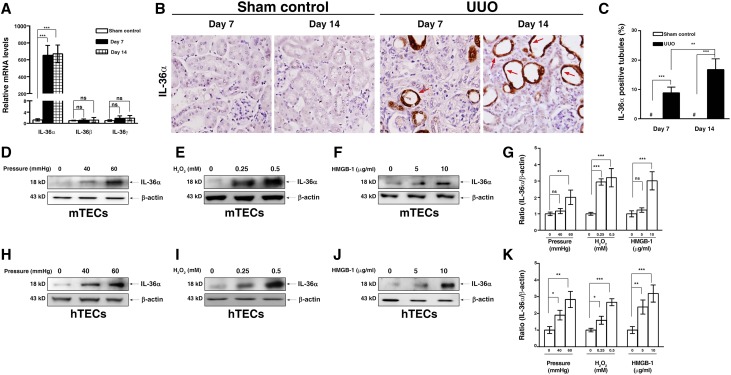
As shown in Figure 2A, renal mRNA expression levels of IL-36α but not IL-36β or IL-36γ were greatly increased in UUO mice in the early stage (7 days) and the late stage (14 days) compared with those of sham control mice (Figure 2A). In addition, striking IL-36α expression was detected mainly in renal TECs of UUO mice by immunohistochemistry (IHC), but no IL-36α was observed in sham control mice (Figure 2, B and C). The expression of IL-36α was localized in the cytoplasm and nuclei of the atrophic renal tubules in UUO mice (Figure 2B).
Figure 2.
IL-36α was induced in UUO kidney and renal TECs. (A) Real-time PCR showing relative renal levels of IL-36 mRNAs in sham control and UUO mice. (B) IHC staining showing IL-36α protein expression in sham control and UUO mice; the arrows indicate IL-36α–positive renal TECs of atrophic tubules. Original magnification, ×400. (C) Quantitative analysis for the IL-36α–positive tubules. Data are means±SEM of nine mice per group. Western blot analysis for IL-36α protein expression in mouse tubular epithelial cells (mTECs) M-1 under (D) mechanically induced pressure, (E) H2O2, or (F) HMGB-1. (G) Semiquantitative IL-36α levels in mTECs M-1 lysates. Western blot analysis for IL-36α protein expression in house tubular epithelial cells (hTECs) HK-2 under (H) mechanically induced pressure, (I) H2O2, or (J) HMGB-1. (K) Semiquantitative IL-36α levels in hTECs HK-2 lysates. Data are means±SEM of three replicative results obtained from in vitro experiments. *P<0.05; **P<0.01; ***P<0.01; #not detectable.
Increased IL-36α Expression in Renal TECs Stimulated with Mechanically Induced Pressure, H2O2, or HMGB-1
By using a cell-based mechanically induced pressure system (Supplemental Figure 1), increased IL-36α production in M-1 cells (a mouse renal TEC line) was observed under a pressure of 60 mmHg compared with that observed at 0 mmHg (Figure 2, D and G). Then, we showed that H2O2 (Figure 2, E and G) and HMGB-1 (Figure 2, F and G) significantly increased IL-36α production in M-1 cells compared with saline alone. The effect of mechanically induced pressure, H2O2, or HMGB-1 on IL-36α expression was also confirmed using the human renal TEC line (HK-2 cells) (Figure 2, H–K).
IL-36R Deficiency Prevented Renal Parenchymal Loss and Renal TILs in UUO Mice
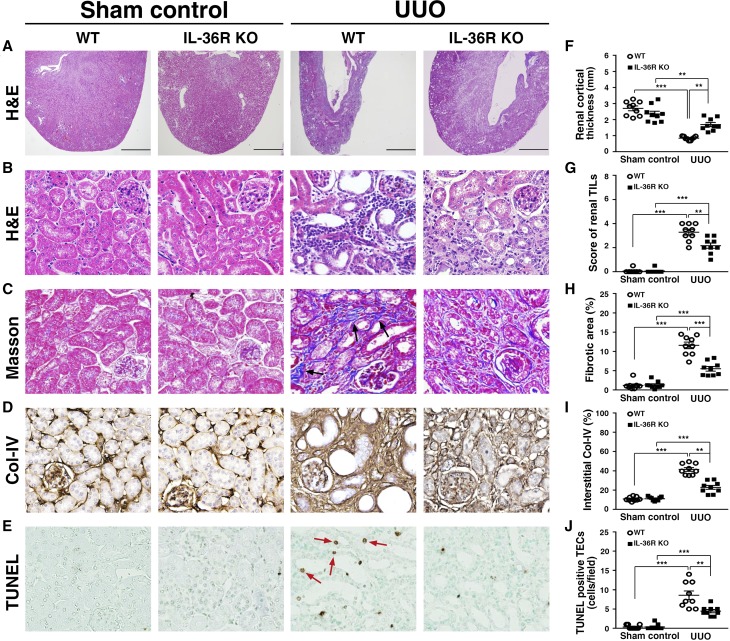
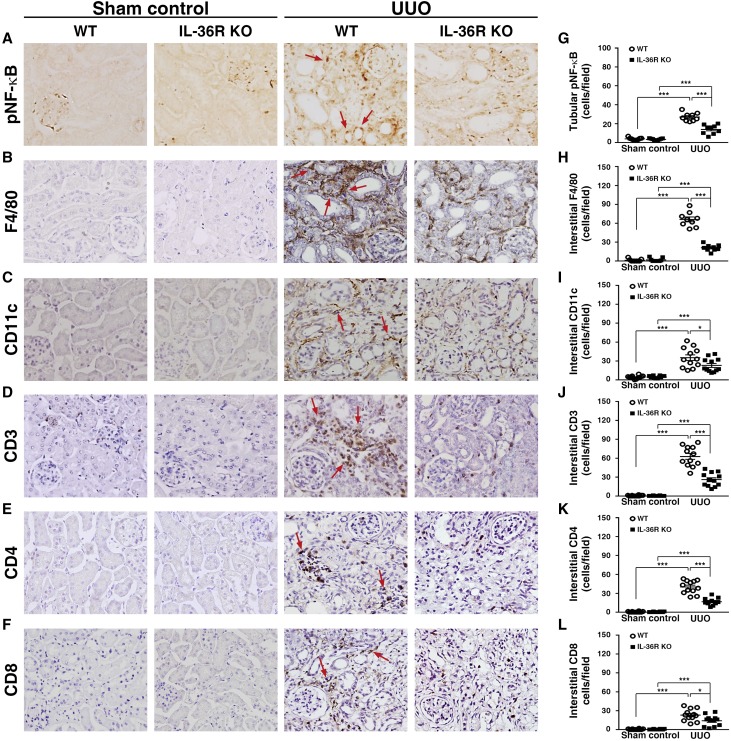
To investigate the role of IL-36 signal in the pathogenesis of UUO, we used IL-36R knockout (KO) mice to induce UUO (IL-36R KO + UUO), and their renal lesions were compared with those of wild-type (WT) mice (WT + UUO). As shown in Figure 3, IL-36R KO + UUO mice showed significantly reduced (1) parenchymal loss and renal TILs (Figure 3, A, B, F, and G), (2) fibrosis (Figure 3, C and H), (3) collagen 4 accumulation (Figure 3, D and I), and (4) renal cell death mainly in renal TECs (Figure 3, E and J) compared with WT + UUO mice. As shown in Figure 4A, a significantly reduced number of phospho–NF-κB (pNF-κB)–positive renal TECs (those localized in the nucleus) was observed in IL-36R KO + UUO mice compared with that observed in WT + UUO mice (Figure 4G). In addition, we showed that renal infiltration of macrophages (F4/80) (Figure 4, B and H), DCs (CD11c) (Figure 4, C and I), CD3 T cells (Figure 4, D and J), CD4 T cells (Figure 4, E and K), and CD8 T cells (Figure 4, F and L) was significantly reduced in IL-36R KO + UUO mice compared with WT + UUO mice.
Figure 3.
Renal TILs was reduced in IL-36R KO+UUO mice. (A) Cortical thickness, hematoxylin and eosin (H&E) staining. Scale bar, 1.5 mm. (B) Renal TILs, H&E staining. (C) Tubulointerstitial fibrosis, Masson trichrome staining. Arrows indicate extracellular matrix. (D) Collagen 4 (Col-IV) expression, IHC staining. (E) TUNEL staining (arrows). Original magnification, ×40 in A; ×400 in B–E. Quantitative analysis for (F) renal cortical thickness, (G) renal TILs, (H) fibrosis, (I) interstitial Col-IV, and (J) apoptotic TECs. Samples were collected 14 days post-UUO or sham operation. Data are means±SEM of nine mice per group. **P<0.01; ***P<0.01.
Figure 4.
Renal inflammatory responses was reduced in IL-36R KO+UUO mice. IHC staining for (A) pNF-κB, (B) F4/80, (C) CD11c, (D) CD3 T cells, (E) CD4 T cells, and (F) CD8 T cells; arrows indicate positive staining. Original magnification, ×400. Quantitative analysis for (G) pNF-κB, (H) F4/80, (I) CD11c, (J) CD3 T cells, (K) CD4 T cells, and (L) CD8 T cells. Samples were collected 14 days post-UUO or sham operation. Data are means±SEM of nine mice per group. *P<0.05; ***P<0.01.
IL-36 Signaling Facilitated the Activation of NLRP3 Inflammasome
Protein Levels of NLRP3 and IL-1β and Caspase-1 Activity Decreased in Diseased Kidney of IL-36R KO + UUO Mice
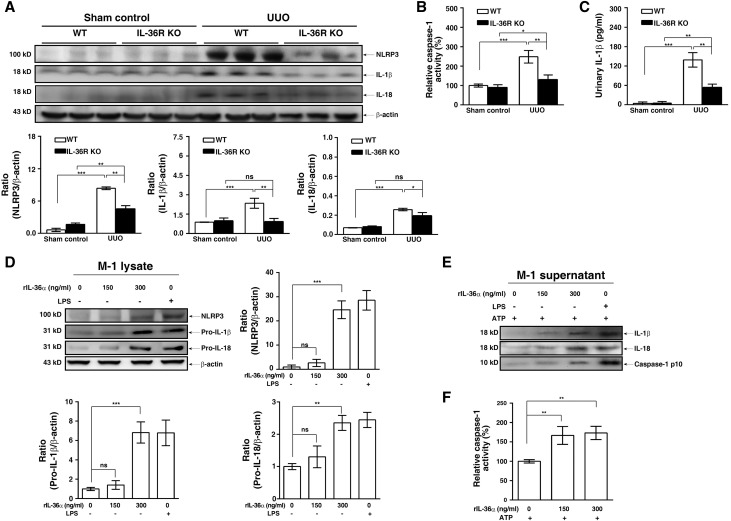
As shown in Figure 5, the renal protein levels of NLRP3, IL-1β, and IL-18 (Figure 5A) and caspase-1 activity (Figure 5B) were significantly increased in WT + UUO mice, but these effects were inhibited in IL-36R KO + UUO mice. In addition, IL-1β levels in WT + UUO mice pelvis urine were significantly increased compared with those in urine of sham control mice, and this effect was greatly inhibited in IL-36R KO + UUO mice (Figure 5C).
Figure 5.
IL-36 signaling facilitated NLRP3 inflammasome activation in renal tissues of UUO mice and renal TECs. (A) Representative Western blots analysis and semiquantitation for NLRP3, IL-18, and IL-1β in renal tissues. (B) Caspase-1 activity determined by an activity assay in renal tissues. (C) ELISA for urinary protein levels of IL-1β in normal (sham control) or pelvic (UUO) urine samples. Data are means±SEM of nine mice per group. M-1 TECs treated with (D) rIL-36α, LPS (2 μg/ml), or saline for 24 hours (representative Western blots and semiquantitation for NLRP3, pro–IL-18, and pro–IL-1β in lysates) or (E) rIL-36α, LPS, or saline for 24 hours and an additional 1 hour of ATP incubation (representative Western blots for IL-18, IL-1β, and caspase-1 p10 in supernatants). (F) Caspase-1 activity determined by an activity assay in lysate. Data are means±SEM of three replicative results obtained from in vitro experiments. *P<0.05; **P<0.01; ***P<0.01.
IL-36α Facilitated NLRP3 Inflammasome Activation in Renal TECs and Macrophages
Exogenous administration of recombinant IL-36α (rIL-36α) increased the expression levels of NLRP3, pro–IL-1β, and pro–IL-18 in M-1 cells (Figure 5D). In addition, rIL-36α induced the secretion of IL-1β, IL-18, and active caspase-1 p10 in M-1 cells (Figure 5E) and increased the caspase-1 activity (Figure 5F) in the presence of ATP. These results suggest that rIL-36α enhanced NLRP3 inflammasome activation in mice renal TECs.
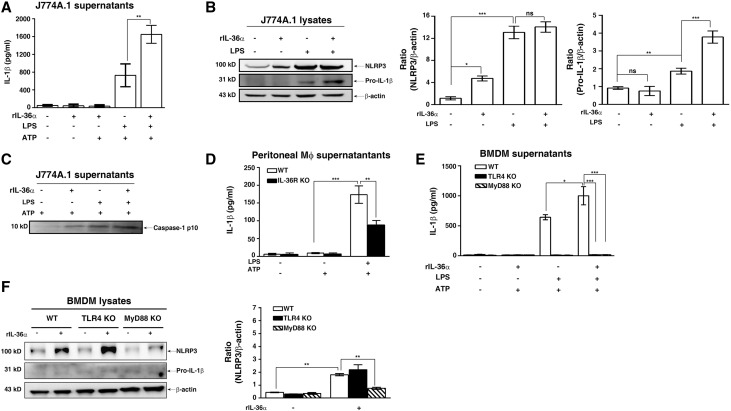
Next, we examined the effect of IL-36α on the NLRP3 inflammasome in macrophages. As shown in Figure 6A, rIL-36α significantly increased IL-1β secretion (Figure 6A) in LPS- and ATP-activated J774A.1 macrophages by increasing expression levels of pro–IL-1β (Figure 6B) and caspase-1 p10 (Figure 6C). The effect of IL-36 signaling in NLRP3 inflammasome activation was confirmed by peritoneal macrophages, because LPS- and ATP-induced IL-1β secretion was significantly lower in peritoneal macrophages isolated from IL-36R KO mice than those from WT mice (Figure 6D). Furthermore, we performed additional experiments to address this issue using bone marrow–derived macrophages (BMDMs) from WT, TLR4 KO, and MyD88 KO mice. The results showed that LPS and ATP induced IL-1β secretion in BMDMs from WT mice, and this effect was significantly enhanced by IL-36α (Figure 6E). However, BMDMs from TLR4 KO and MyD88 KO mice did not produce IL-1β in response to LPS and ATP in the presence or absence of IL-36α (Figure 6E). To further investigate how IL-36α enhances IL-1β secretion, BMDMs from WT, TLR4 KO, and MyD88 KO mice were stimulated with IL-36α alone. Our data showed that IL-36α did not induce NLRP3 expression in BMDMs from MyD88 KO mice, although IL-36α was capable of inducing NLRP3 expression in BMDMs from WT and TLR4 KO mice (Figure 6F). These results suggest that activation of IL-36 signaling positively regulates IL-1β secretion through the priming signal of NLRP3 inflammasome in an MyD88-dependent manner but independent of TLR4.
Figure 6.
IL-36 signaling facilitated NLRP3 inflammasome activation in cultured macrophages. (A) ELISA analysis of IL-1β protein levels in supernatant of murine J774A.1 macrophages incubated for 30 minutes with or without rIL-36α (150 ng/ml), 5.5 hours with or without 0.5 μg/ml LPS, and 30 minutes with or without 5 mM ATP. (B) Representative Western blots and semiquantitation for NLRP3 and pro–IL-1β in lysates of J774A.1 macrophages incubated with or without rIL-36α (150 ng/ml) for 30 minutes and then treated with or without LPS for 6 hours. (C) Representative Western blots for caspase-1 p10 in supernatants of J774A.1 incubated with or without rIL-36α (150 ng/ml), 5.5 hours with or without 0.5 μg g/ml LPS, and 30 minutes with or without 5 mM ATP. (D) ELISA analysis of IL-1β protein levels in supernatant of peritoneal macrophages from IL-36R KO and WT mice incubated for 5.5 hours with or without 1 μg g/ml LPS and 30 minutes with or without 5 mM ATP. (E) ELISA analysis of IL-1β protein levels in supernatant of BMDMs from WT, TLR4 KO, and MyD88 KO mice treated with similar conditions as J774A.1 above. (F) Representative Western blots and semiquantitation for NLRP3 and pro–IL-1β in lysates of BMDMs from WT, TLR4 KO, and MyD88 KO mice treated with or without rIL-36α (150 ng/ml). Data are means±SEM of three replicative results obtained from the experiments. Mϕ, macrophage *P<0.05; **P<0.01; ***P<0.01.
IL-36α Activated NLRP3 Inflammasome in BMDCs
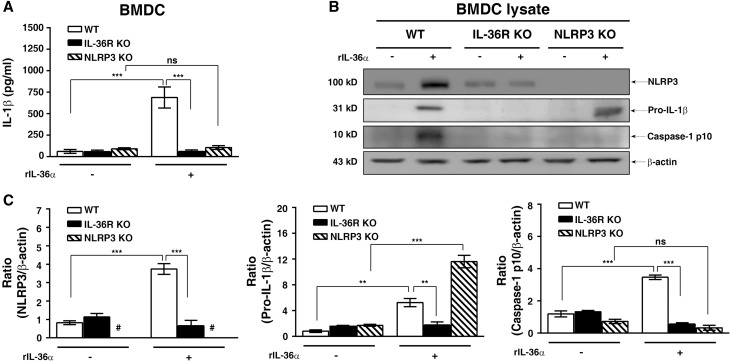
As shown in Figure 7, rIL-36α induced IL-1β secretion and the expression of NLRP3, pro–IL-1β, and caspase-1 p10 in BMDCs from WT mice, but these effects were significantly inhibited in BMDCs from IL-36R KO mice. The IL-1β secretion and caspase-1 activation induced by rIL-36α occurred through NLRP3, because these effects were impaired in BMDCs from NLRP3 KO mice (Figure 7). These results indicate that IL-36α directly induces NLRP3 inflammasome activation by providing both priming and activation signals of the inflammasome in BMDCs, and they also suggest that IL-36 effects are almost exclusive for DCs and cannot be ascribed to macrophages in the same manner.
Figure 7.
IL-36 signaling activated NLRP3 inflammasome activation in BMDCs. (A) ELISA analysis of IL-1β protein levels in supernatant of BMDCs from WT, IL-36R KO, and NLRP3 KO mice incubated with or without rIL-36α (150 ng/ml) for 24 hours. (B) Representative Western blots and (C) semiquantitation for NLRP3, pro–IL-1β, and caspase-1 p10 in lysates of BMDCs from WT, IL-36R KO, and NLRP3 KO mice incubated with or without rIL-36α (150 ng/ml) for 24 hours. Data are means±SEM of three replicative results obtained from the experiments. *P<0.01; ***P<0.01; #not detectable.
IL-36 Signaling Facilitated T Cell Activation in UUO Mice and Cell Models
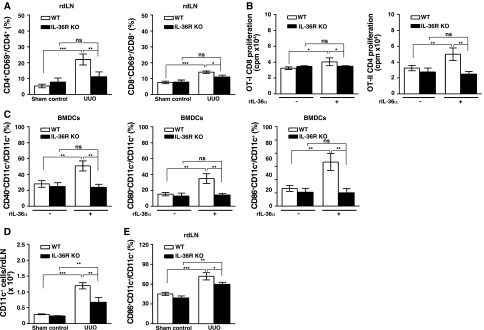
In renal draining lymph nodes from IL-36R KO + UUO mice, the percentage of CD4+/CD69+ T or CD8+/CD69+ T cells was significantly decreased compared with that of WT + UUO mice (Figure 8A). In addition, using OT-I or OT-II transgenic mice with CD8 or CD4 T cells that are specific to OVA257–264 or OVA323–339 peptides presented by DCs, we found that rIL-36α facilitated WT BMDCs-mediated proliferation of CD4 and CD8 T cells in response to OVA stimulation, but these effects were significantly inhibited in BMDCs from IL-36R KO mice (Figure 8B). As shown in Figure 8C, compared with saline alone, rIL-36α significantly increased surface expression levels of maturation markers CD40, CD80, and CD86 in BMDCs from WT mice, but these effects were significantly inhibited in BMDCs from IL-36R KO mice. Next, we tested the effect of IL-36 signaling on the enhancement of migration and activation of renal DCs to draining lymph nodes in the UUO model. Deficiency of IL-36R resulted in significant reduction of CD11c+ cells accumulation in renal draining lymph nodes (Figure 8D). In addition, the percentage of CD86+CD11c+ in renal draining lymph nodes was also significantly decreased in IL-36R KO + UUO mice compared with that of WT + UUO mice (Figure 8E), and the finding was consistent with that of the ex vivo experiments (Figure 8C).
Figure 8.
IL-36 signaling facilitated DC-induced T cells activation in UUO mice and cell models. (A) Flow cytometric analysis showing the percentages of CD4+/CD69+ and CD8+/CD69+ in renal draining lymphoid cells at day 7 after UUO or sham operation. Data are means±SEM of nine mice per group. (B) BMDCs were incubated with or without rIL-36α (150 ng/ml) for 16 hours, pulsed with OVA257–264 or OVA323–339 peptide, and then, cocultured with OT-I CD8 or OT-II CD4 T cells, respectively. After 3 days, the T cell proliferation was measured by [3H]thymidine incorporation. Data are means±SEM of three replicative results obtained from the experiments. (C) Flow cytometric analysis showing expression levels CD40, CD80, and CD86 (within gated CD11c cells) in BMDCs from WT and IL-36R KO mice, which were incubated with or without rIL-36α (150 ng/ml) for 24 hours. Data are means±SEM of three replicative results obtained from the experiments. (D) Flow cytometric analysis showing the numbers of CD11c+ cells in renal draining lymphoid cells at day 7 after UUO or sham operation; data are means±SEM of five mice per group. (E) Flow cytometric analysis showing the CD86+CD11c+ cells in renal draining lymphoid cells at day 7 after UUO or sham operation. Data are means±SEM of five mice per group. rdLN, renal draining lymph node. *P<0.05; **P<0.01; ***P<0.01.
IL-36 Enhanced IL-23/IL-17 Axis in UUO Mice
Reduced mRNA Levels of IL-23 and IL-17A in Renal Tissues of IL-36R KO + UUO Mice
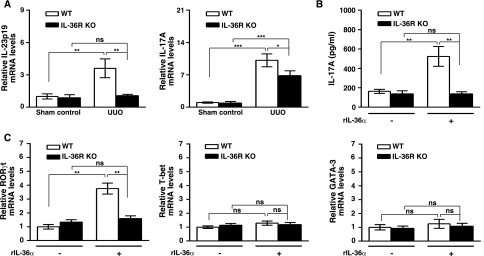
Renal mRNA levels of IL-23p19 and IL-17A were significantly reduced in IL-36R KO + UUO mice compared with WT + UUO mice (Figure 9A), indicating that IL-36 signal facilitated the IL-23/IL-17 response in the UUO model.
Figure 9.
IL-36 facilitated Th17 differentiation in UUO mice and in vitro T cell activation. (A) Real-time PCR showing relative renal mRNA levels of IL-23p19 and IL-17A in sham control and day14 UUO mice. Data are means±SEM of nine mice per group. (B) BMDCs were incubated with or without rIL-36α (150 ng/ml) for 16 hours, pulsed with OVA323–339 peptides, and then, cocultured with OT-II CD4 T cells. After 4 days, supernatants were collected, and the production of IL-17A was detected by ELISA. Data are means±SEM of three replicative results obtained from the experiments. (C) Real-time PCR showing mRNA levels of specific transcription factors for different Th cells in OT-II CD4 cocultured with BMDCs (preincubated with or without rIL-36α for 16 hours and then, pulsed with OVA323–339 peptides) for 4 days. Data are means±SEM of three replicative results obtained from the experiments. *P<0.05; **P<0.01; ***P<0.01.
Enhanced Th17 Differentiation Mediated by IL-36α–Primed BMDCs
In humans, T cells have shown that they are unable to respond to exogenous IL-36 cytokines.15 Direct effect of IL-36 cytokines on the differentiation of Th17 cells in mice is relative weak.16 Therefore, we used both BMDCs and OT-II CD4 cells to examine the effect of IL-36α on the differentiation of Th17 cells. As shown in Figure 9B, WT BMDCs pretreated with IL-36α significantly enhanced IL-17A production, but this effect was not observed in the IL-36R KO BMDCs group. We further performed additional experiments to determine the expression levels of RORγt, T-bet, and GATA-3 mRNA, which are specific transcription factors of Th17, Th1, and Th2, respectively. The results showed that, in the OVA-OT-II T cell activation model, RORγt expression was upregulated in the IL-36α primed WT BMDCs group (Figure 9C), but this effect was not observed in the IL-36R KO BMDCs group. In addition, the mRNA expression levels of T-bet and GATA-3 among all groups were similar (Figure 9C). These results showed that IL-36 signaling facilitated Th17 differentiation mediated by BMDCs.
Reduced Inflammation and Fibrosis in Kidney of IL-23 KO + UUO Mice
In mice that lack IL-17A and IL-17 receptors, UUO-induced renal inflammation and fibrosis are also attenuated.17,18 To further validate the pathogenic role of the IL-23/IL-17 axis in the UUO model, we evaluated renal macrophage infiltration and collagen 4 deposition between IL-23 KO + UUO and WT + UUO mice by F4/80 (Supplemental Figure 2A) and collagen 4 (Supplemental Figure 2B) IHC. Results showed that IL-23 deficiency attenuated UUO-induced renal inflammation and fibrosis (Supplemental Figure 2, C and D).
IL-36R Antagonist (IL-36Rn) Administration Attenuated Renal TILs in UUO Mice
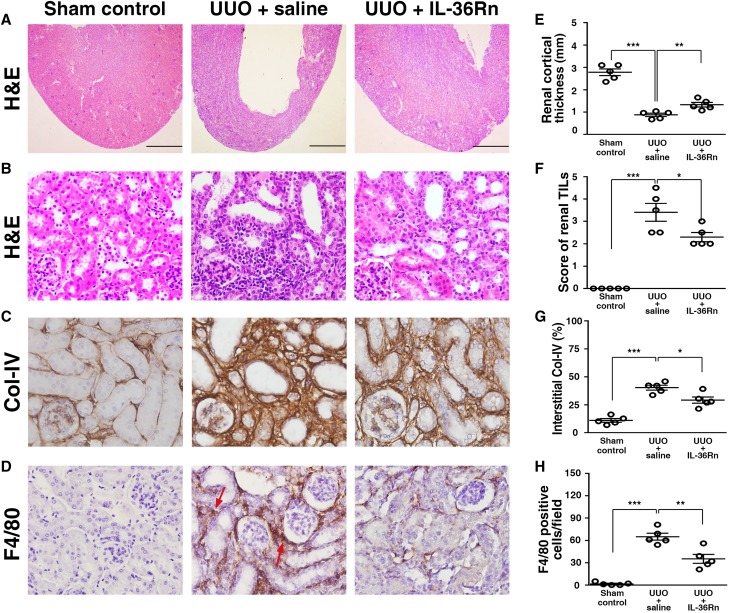
To assess the potential for IL-36R to be a therapeutic target, we further treated UUO mice with an IL-36Rn (UUO + IL-36Rn mice), and the mice treated with saline only (UUO + saline mice) were disease controls. Consistent with the results obtained from the IL-36R KO + UUO mice (Figures 3, A, B, and D and 4B), significant prevention of parenchymal loss and reduced severity of renal TILs (Figure 10, A, B, E, and F) and fibrosis (Figure 10, C and G) as well as decreased renal infiltration of macrophages (F4/80) (Figure 10, D and H) were observed in UUO + IL-36Rn mice compared with UUO + saline mice.
Figure 10.
Renal TILs was reduced in UUO + IL-36Rn mice. (A) Cortical thickness (hematoxylin and eosin [H&E] staining). Scale bar, 1.5 mm. (B) Renal TILs (H&E staining). (C) Collagen 4 (Col-IV). (D) F4/80 (arrows) expression (IHC staining). Original magnification, ×40 in A; ×400 in B–D. Quantitative analysis for (E) renal cortical thickness, (F) renal TILs, (G) interstitial Col-IV, and (H) F4/80; data are means±SEM of five mice per group. *P<0.05; **P<0.01; ***P<0.01.
Discussion
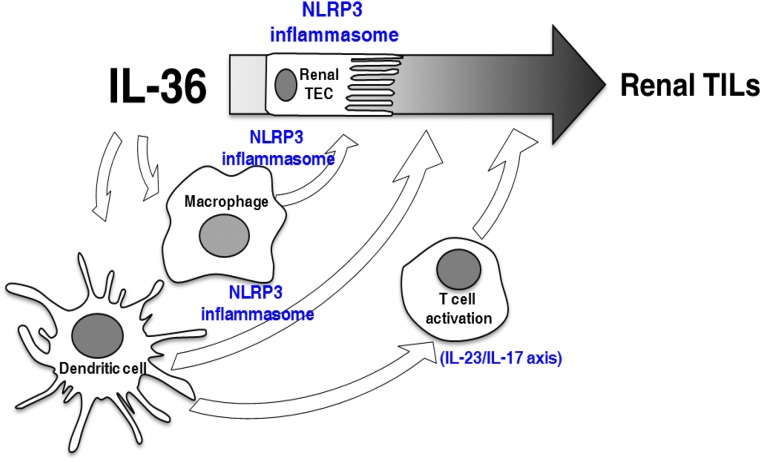
In human samples, we showed that IL-36α was highly expressed in renal tissues and urine samples from patients with histopathologic renal TILs. In this study, primary glomerular diseases, such as IgA nephropathy, were also included in the detection of IL-36 levels; thus, additional investigation should focus on identifying the potential differential roles of IL-36 in glomerular disorder–associated and primary TILs. The contribution of IL-36α of intrinsic renal cells seemed to be more important than that of mononuclear leukocytes that infiltrated in the kidney as shown by IHC in renal tissues. (1) IHC of human patients showed that the expression level of IL-36α was more intense in renal TECs and parietal cells than that of mononuclear leukocytes, and (2) IL-36α was barely expressed in mononuclear leukocytes of the renal sections of UUO mice. We further showed that renal IL-36α and urine IL-36α levels were proportionally correlated with renal function impairment or the magnitude of proteinuria. Consistent with the results, cultured human renal TECs under the stimulations mimicking UUO, mechanically induced pressure, ROS, or HMGB-119–22 all showed greatly increased production of IL-36α. We further showed that (1) IL-36α facilitates NLRP3 inflammasome activation in renal intrinsic (TECs) and immune cells (both macrophages and BMDCs); (2) IL-36 signaling facilitates activation of the IL-23/IL-17 axis, contributing to the development of renal inflammation and fibrosis in UUO mice; and (3) blockage of IL-36R by IL-36Rn attenuated renal TILs of UUO mice. Our proposed mechanistic network for the pathogenic role of IL-36 in the development of renal TILs is also summarized in Figure 11.
Figure 11.
Proposed mechanistic pathways underlying the pathogenic role of IL-36 in the development of renal TILs. IL-36 may be contributed to the pathogenesis of renal TILs, involving the activation of NLRP3 inflammasome and IL-23/IL-17 axis.
IL-36 cytokines have been shown to activate NF-κB through IL-36R.1,6 We showed, for the first time, that ablation of IL-36R dramatically decreased NF-κB activation in renal TECs as evidenced by reduced nuclear translocation of the transcription factor in IL-36R KO + UUO mice (Figure 4, A and G).
In this study, we showed that (1) IL-36R KO strikingly decreased the production of NLRP3, IL-1β, and IL-18 and the activity of caspase-1 in the kidney of UUO mice (Figure 5, A–C); (2) IL-36α induced NLRP3 expression in renal TECs (Figure 5D) and macrophages (Figure 6, B and F), indicating that IL-36α provided the priming signal of the NLRP3 inflammasome in these cells; and (3) IL-36α induced IL-1β secretion (Figure 7A) and NLRP3 expression as well as caspase-1 activation (Figure 7B) in BMDCs, indicating that IL-36α provided both priming and activation signals of the NLRP3 inflammasome in BMDCs. However, NLRP3 deficiency has been shown to reduce renal TEC apoptosis.23,24 We used terminal deoxynucleotidyl transferase–mediated digoxigenin-deoxyuridine nick-end labeling (TUNEL) staining to detect renal cell death in UUO mice (Figure 3, E and J). It should be pointed out that various cell death pathways are positive for TUNEL staining.25–27 TUNEL staining for DNA fragments is not specific for apoptosis.25,26 In fact, there is no cell death pathway that is not positive for TUNEL staining.27 With the conclusion of necrosis as a regulated process, such as in ferroptosis or necroptosis, further investigation for all of these pathways of cell deaths is worth pursuing for better understanding of the role of IL-36 signaling in the renal TILs of UUO. Using IHC of cleaved caspase-3 is an important strategy to specify apoptosis pathway in combination with TUNEL.
In addition, it has been shown that DCs, which migrate from the kidney to the draining lymph nodes, play a major role in immune responses in the kidney.28–30 In this regard, we showed that deficiency of IL-36R resulted in reduced activation of DCs (Figure 8D), CD4, and CD8 in the renal draining lymph node of UUO mice (Figure 8A). The data suggest that the IL-36 signaling pathway involves renal TILs in UUO mice partly by enhancing the DC-driven activation of T cells in the kidney (Figures 8 and 11), although the role of DCs in the pathogenesis of UUO mice requires further investigation.31 Even so, the UUO model that was used throughout the study is predominantly innate without the participation of foreign antigens,32 although adaptive immunity is important in UUO model.33 Showing that antigens from the UUO damaged kidney lead to nephritogenic immune responses contributing to the disease would suggest autoimmunity or autoinflammation. Thus, suggesting the existence of this process needs the inclusion of much more supportive evidence.
The effect of IL-36α on OT-II CD4 cells in vitro has little relevance to UUO. An antigen-specific injurious Th17 nephritic adaptive immune response would have to be shown before renal IL-17A can be attributed to IL-36α–induced Th17 cells in this model. IL-17A is made by many cells, mainly innate immune cells like γδ T cells, a major source of IL-17A.18 These cells have been shown to accumulate in the inflamed kidney to enhance injury by the production of IL-17A.34 To resolve the cellular source of the IL-17A detected in the UUO model would require isolating leukocytes from UUO diseased kidneys and using flow cytometric analysis to shows the relative proportions of γδ T cells and Th17 CD4+ cells.
Combined with the data obtained from relevant cell models and animal experiments, the results obtained from patients’ samples further support the notion that IL-36 signaling contributed to the pathogenesis of renal TILs (Figure 11).
Concise Methods
Renal and Urine Samples from Patients with Renal TILs and Normal Subjects
Between September of 2014 and March of 2016, patients ages 20–80 years old who underwent kidney biopsy at the Tri-Service General Hospital were recruited, and renal biopsy specimens were examined retrospectively. Twenty-four patients (14 men and ten women; mean age =58.9±11.0 years old) with the pathologic diagnosis of TILs were enrolled. Their renal and/or urine samples were obtained at the time of diagnosis. The underlying diseases of TILs included chronic interstitial nephritis, diabetic nephropathy, membranous GN, interstitial nephritis with FSGS, proliferative GN, and chronic GN. Renal tissues taken from the unaffected pole of kidneys removed because of renal cell carcinoma were used as normal controls (n=16). Normal urine samples were collected from apparently healthy volunteers (n=8). The exclusion criteria included those <20 years of age, inability to provide informed consent, presence of active infection, and pregnancy. The scoring of patients’ renal leukocytes infiltration and fibrosis was graded on a scale from zero to five: 0, normal; 1–2, mild: involvement of <25% of the cortex; 2–3, moderate: involvement of 25%–50% of the cortex; 3–4, severe: involvement of 50%–75% of the cortex; and 4–5, extensive damage involving >75% of the cortex. Healthy individuals were included in correlation charts of urinary IL-36α versus BUN, SCr, urinary protein/urinary creatinine, and eGFR. Correlation analyses involved with IHC or renal leukocytes infiltration and fibrosis included patients only.
Cells and Animals
Human renal TEC line HK-2 and mouse renal TEC line M-1 were purchased from Bioresource Collection and Research Center (Hsinchu, Taiwan). HK-2 was maintained in F12/DMEM (Invitrogen, Waltham, MA) with 10% FBS (Invitrogen). M-1 was maintained in F12/DMEM (Invitrogen) with 5% FBS and 5 nM dexamethasone (Sigma-Aldrich, St. Louis, MO). Murine macrophage cell line J774A.1 was purchased from the American Type Culture Collection (Manassas, VA) and maintained in RPMI 1640 with 10% FBS.
IL-36R KO mice were provided by Jennifer E. Towne (Amgen, Seattle, WA). IL-23 KO mice were provided by Frederic J. de Sauvage (Genentech). NLRP3 KO mice were provided by Cheng-Yeu Wu (Research Center of Bacterial Pathogenesis, Chang Gung University). OT-I and OT-II TCR transgenic mice were purchased from the Jackson Laboratory (Bar Harbor, ME). TLR4 KO mice were purchased from the Jackson Laboratory. MyD88 KO mice were provided by Ren-Yeong Huang (Department of Density, Tri-Service General Hospital, National Defense Medical Center, Taiwan, Taiwan). C57BL/6 serving as the WT was purchased from The National Laboratory Animal Center (Taipei, Taiwan). Peritoneal macrophages were collected from IL-36R KO and WT mice as described previously.35 BMDCs were generated from IL-36R KO, NLRP3 KO, and WT mice as described previously.36 BMDMs were generated from WT, TLR4 KO, and MyD88 KO mice as described previously.37
UUO Model
This model was implemented as described previously.38 Briefly, the mice (8–12 weeks of age) were anesthetized followed by a lateral incision on the back of the mouse. After the left ureter was exposed, it was tied with a silk suture at two points and permanently ligated. Sham-operated mice, which underwent an identical procedure but without ureteric ligation, were used as sham control. After 7 or 14 days, the mice were euthanized, and then, renal tissues, pelvis urine, and renal draining lymph nodes were collected. The therapeutic experiment with recombinant mouse IL-36Rn (R&D, McKinley, MA) was performed by injecting 6 μg/d protein intraperitoneally into the mice at day 3 after UUO induction until the mice were euthanized, and the mice that received saline only served as disease controls. The mice were then euthanized on day 14 for further histopathologic evaluation as below.
IL-36α Expression in Renal TECs
Mechanically Induced Pressure Model
To mimic the microenvironment inside the renal pelvis of the diseased kidney of UUO mice, we applied an apparatus as described previously,19 with a mild modification of the rubber stopper, in which an additional filter tip was inserted to prevent contamination (Supplemental Figure 1). Renal TECs (2×10⁵) were cultured in this closed system under different pressures maintained in a CO2 incubator for 24 hours, and then, cell lysates were subjected to Western blot analysis for IL-36α production as described below.
H2O2 or HMGB-1 Treatment
Renal TECs (2×10⁵) were incubated with H2O2 (Sigma-Aldrich), HMGB-1 (Sigma-Aldrich), or saline for 12 hours, and then, cell lysates were subjected to Western blot analysis for IL-36α production as described below.
NLRP3 Inflammasome Activation in Renal TECs, Macrophages, and BMDCs
Renal TECs (2×10⁵) were incubated with rIL-36α (BioLegend, San Diego, CA) or saline for 24 hours and incubated with or without 10 mM ATP for 1 hour. LPS (Sigma-Aldrich) was used as a positive control for renal TECs NLRP3 inflammasome activation.39 The supernatant and cell lysates were collected and stored until use.
Peritoneal macrophages were treated with LPS-ATP (InvivoGen, San Diego, CA) as described previously,35 and then, the supernatant was collected for the detection of IL-1β by ELISA as described below; 1×10⁵ J774A.1 cells or BMDMs were incubated for 30 minutes with or without rIL-36α (150 ng/ml), and then, LPS (0.5 μg/ml) or saline was added and incubated for 5.5 hours; later, 5 mM ATP or saline was added and incubated for 30 minutes. The supernatant was then collected for the determination of IL-1β levels by ELISA as described below, and cell lysates were collected for the determination of the levels of NLRP3 and pro–IL-1β by Western blot analysis as described below.
BMDCs (6×10⁵) were treated with 150 ng/ml rIL-36α or saline for 24 hours. The supernatant was collected. Furthermore, cell lysates were collected for the determination of IL-1β levels by ELISA as described below, and cell lysates were collected for the determination of the levels of NLRP3, caspase-1, and pro–IL-1β by Western blot analysis as described below.
OVA-Specific T Cell Activation
Activation of T cells by BMDCs was determined using an OVA-specific T cell proliferation assay in vitro as described previously.40 Briefly, BMDCs were primed with rIL-36α (150 ng/ml) or saline for 16 hours and washed with PBS. Then, the BMDCs (104 cells per well in a 96-well plate) were incubated with OVA257–264 (0.1 μg/ml for OT-I) or OVA323–339 (0.2 μg/ml for OT-II) peptide (both from InvivoGen) for 4 hours. CD4 or CD8 T cells were isolated from OT-II or OT-I mice, respectively, with an EasySep Positive Selection Kit (STEM Cell; Vancouver, BC, Canada) and added to BMDC cultures in a 1:4 (BMDCs-to-T cells) ratio. After 72 hours of incubation, T cell proliferation was determined by counting the scintillation photon of incorporated [3H]thymidine during the last 26 hours. For Th17 response, BMDCs and OT-II CD4 cells were cocultured for 4 days, and supernatant was collected for IL-17A ELISA as described below.
Clinical and Pathologic Evaluation
Urine was collected from the dilated pelvis of the diseased kidney of UUO mice using a needle and syringe as described previously,41 whereas urine samples were collected for sham controls mice by metabolic cages as described previously.42
The mice were euthanized on days 7 and 14 after UUO or sham operation, respectively, and renal tissues were collected for renal pathology, IHC, apoptosis, real-time PCR, and Western blot analysis as described below. At the same time, kidney draining lymph nodes were dissected for flow cytometry as described previously.43 For renal histopathology, renal tissues were fixed in 10% buffered formalin and embedded in paraffin. Sections measuring 3 μm were cut and stained with hematoxylin and eosin or Masson trichrome staining for light microscopy. Parenchymal loss was determined by measuring the thickness of the kidney using the open-source ImageJ software (Wayne Rasband, National Institutes of Health) as described previously.44 The scoring of renal TILs was evaluated for dilated renal tubules, atrophic tubules with protein casts, and interstitial inflammation and fibrosis in 40 consecutive selected fields by light microscopy at an original magnification of ×400 as described previously45,46 with minor modifications; scoring of renal TILs was graded on a scale from zero to four: 0, normal; 1, mild: involvement of <25% of the cortex; 2, moderate: involvement of 25%–50% of the cortex; 3, severe: involvement of 50%–75% of the cortex; 4, extensive damage involving >75% of the cortex.
For IHC analysis, formalin-fixed and paraffin-embedded renal tissue sections were incubated with primary antibodies against F4/80 (MCA497; Serotec, Kidlington, Oxford, United Kingdom), pNF-κB p65 (3033; Cell Signaling, Danvers, MA), mouse IL-36α (AF2297; R&D), collagen 4 (1340–01; Southern Biotech, Birmingham, AL), CD3 (A0452; Dako, Carpinteria, CA), or human IL-36α (AP5234c; Abgent, San Diego, CA) and then, incubated with HRP-conjugated secondary antibodies (Dako). DAB (Dako) was used as an HRP-specific substrate. Frozen sections of renal tissues fixed in periodate-lysine paraformaldehyde47 were used to incubate with primary antibodies against CD11c (550283; BD Pharmingen, San Diego, CA), CD4 (generated from hybridoma GK1.5; ATCC TIB207; American Type Culture Collection), and CD8 (550281; BD Pharmingen) and then, incubate with HRP-conjugated secondary antibodies (Dako). For the detection of apoptosis, a TUNEL was performed. Formalin-fixed and paraffin-embedded renal tissue sections were stained using the ApopTag Plus Peroxidase In-Situ Apoptosis Kit (Millipore, Billerica, MA) according to the manufacturer’s instructions. Scoring for the distribution of collagen 4 and IL-36α expression was performed using the quantitative image analysis software PAX-it (PAXcam, Villa Park, IL) as described previously.48 Quantitative analysis for the number of cells positive (expressed as cells per field) for pNF-κB, F4/80, CD11c, CD3, CD4, CD8, or apoptosis was performed under original magnification of ×400 in 40 selected consecutive fields from both cortical and outer medullary regions by the Pax-it software as described previously.48 The percentage of renal tubules in which most of their epithelial cells were positive for IL-36α by IHC was determined in 150 selected consecutive renal tubules from both cortical and outer medullary regions at an original magnification of ×400.
Real-Time PCR Assay
The renal RNA was extracted by REzol (Protech Technology, Taipei, Taiwan) according to the manufacturer’s instructions. cDNAs were synthesized from 1.5 μg total RNAs by SSRTII Reverse Transcriptase (Invitrogen). Real-time PCR reactions were performed using 7.5 μl cDNA, 10 μl SYBR Green RT-PCR Reagents Kit (Applied Biosystems, Waltham, MA), and 1.25 μl specific primer mixed in a total volume of 20 μl. The conditions of thermal cycler ABI ViiA7 (Applied Biosystems) were set up as follows: 2 minutes at 50°C, 10 minutes at 95°C, 40 cycles of denaturation (15 seconds at 95°C), and combined annealing/extension (1 minute at 60°C). The housekeeping gene glyceraldehyde-3-phosphate dehydrogenase (GAPDH) was used as the internal standard. The PCR-specific primer pairs used for analysis were as follows: mouse IL-36α forward: 5′-CAGCATCACCTTCGCTTAGAC-3′; mouse IL-36α reverse: 5′-AGTGTCCAGATATTGGCATGG-3′; mouse IL-36β forward: 5′-TGGCATAGAGGGCTCCACTTCTGT-3′; mouse IL-36β reverse: 5′-CCCCGCTGATGTGTGGAGGATGA-3′; mouse IL-36γ forward: 5′-ACCACACCCGGACAGGTGGA-3′; mouse IL-36γ reverse: 5′-TGGGGTTGCCAGTCTTGGAGGA-3′; mouse IL-17A forward: 5′-GCTCCAGAAGGCCCTCAGA-3′; mouse IL-17A reverse: 5′-AGCTTTCCCTCCGCATTGA-3′; mouse IL-23p19 forward: 5′-ACGGGGCACATTATTTTTAGTCT-3′; mouse IL-23p19 reverse: 5′-ATGCTGGATTGCAGAGCAGTA-3′; mouse GAPDH forward: 5′-TCCGCCCCTTCTGCCGATG-3′; mouse GAPDH reverse: 5′-CACGGAAGGCCATGCCAGTGA-3′; mouse RORγt forward: 5′-TGTCCTGGGCTACCCTACTG-3′; mouse RORγt reverse: 5′-GTGCAGGAGTAGGCCACATT-3′; mouse T-bet forward: 5′-TCCCATTCCTGTCCTTCA-3′; mouse T-bet reverse: 5′-GCTGCCTTCTGCCTTTC-3′; mouse GATA-3 forward: 5′-ACCACGGGAGCCAGGTATG-3′; and mouse GATA-3 reverse: 5′-CGGAGGGTAAACGGACAGAG-3′.
ELISA
Protein levels of IL-1β in urine of mice or supernatants of cell cultures were detected using respective commercial IL-1β DuoSet ELISA Kits (R&D) according to the manufacturer’s instructions. IL-17A in the supernatants of cell cultures was detected using the IL-17A Quantikine ELISA Kit (R&D) following the manufacturer’s guidance. The OD was measured by a multimode ELISA plate reader (Bio-Tek, Winooski, VT).
Caspase-1 Activity Assay
This assay was measured using a commercial caspase-1 activity assay kit (R&D) according to the manufacturer’s instructions.
Western Blot Analyses
Tissues or cells were lysed in RIPA Buffer (Millipore) as described previously.49 Cell culture supernatants (400 μl each) or patients’ urine samples (400 μl each) were precipitated by the addition of an equal volume of methanol and 250 μl chloroform, vortexed, and centrifuged for 10 minutes at 20,000×g as described previously.40 The upper phase was removed by pipetting, and 500 μl methanol was added to the remaining phase. This mixture was centrifuged for 10 minutes at 20,000×g, and the protein pellet was dried at 55°C, resuspended in Laemmli buffer, and boiled for 5 minutes at 99°C. Supernatants or lysates were separated on 8% or 15% SDS-PAGE as described previously.50 The target proteins were probed with respective primary antibodies against mouse IL-36α (AF2297; R&D), β-actin (sc-130656; Santa Cruz Biotech, Santa Cruz, CA), human IL-36α (AP5234c; Abgent), NLRP3 (AG-20B-0014; Adipogen, San Diego, CA), IL-18 (sc-7954; Santa Cruz Biotech), caspase-1 (AG-20B-0044; Adipogen), or IL-1β (AF-401; R&D) followed by the addition of HRP-conjugated secondary antibodies (Santa Cruz Biotech).
Flow Cytometry
Cell suspensions were prepared from renal draining lymph nodes as described previously51 and incubated with anti–CD69-FITC (11–0691–82; eBioscience), anti–CD4-allophycocyanin (APC; 17–0042; eBioscience), or CD8-APC (17–0081–8; eBioscience). BMDCs (6×10⁵) were treated with 150 ng/ml rIL-36α or saline for 24 hours. Maturation of BMDCs was determined by flow cytometric analysis with CD40, CD80, and CD86 as described previously.37 Cells were acquired on a Calibur Flow Cytometer with CellQuest software as described previously.52
Statistical Analyses
For animal experiments, data were presented as means±SEM, and data obtained were determined using paired t test. For in vitro and ex vivo experiments, data were presented as means±SEM, and data obtained were analyzed using one-way ANOVA with a subsequent Scheffe test. Correlations were analyzed using the Spearman correlation test. P<0.05 was considered statistically significant.
Study Approval
All animal experiments were performed with the approval of the Institutional Animal Care and Use Committee of National Defense Medical Center in compliance with the National Institutes of Health Guide for the Care and Use of Laboratory Animals. The informed consent was observed from each individual included in the human sample study, and the ethics approval was obtained in advance from the Institutional Review Board of the Tri-Service General Hospital, National Defense Medical Center (TSGH-IRB-1–102–05–130).
Disclosures
None.
Supplementary Material
Acknowledgments
We thank Dr. Jennifer E. Towne (Amgen), Dr. Frederic J. de Sauvage (Genentech), Dr. Cheng-Yeu Wu (Chang Gung University), and Dr. Ren-Yeong Huang (National Defense Medical Center) for mice usage and all of the members of our laboratory for kind cooperation, discussion, and animal care. We thank the staff of the Instrument Center and Animal Center of the National Defense Medical Center for providing their assistance and animal care.
This study was supported by Ministry of Science and Technology grant MOST 103-2320-B-016-011-MY3, MOST 105-2321-B-016-002, and Tri-Service General Hospital grant TSGH-C105-69.
Footnotes
Published online ahead of print. Publication date available at www.jasn.org.
This article contains supplemental material online at http://jasn.asnjournals.org/lookup/suppl/doi:10.1681/ASN.2016080840/-/DCSupplemental.
References
- 1.Ramadas RA, Ewart SL, Iwakura Y, Medoff BD, LeVine AM: IL-36α exerts pro-inflammatory effects in the lungs of mice. PLoS One 7: e45784, 2012 [DOI] [PMC free article] [PubMed] [Google Scholar]
- 2.Blumberg H, Dinh H, Dean C Jr., Trueblood ES, Bailey K, Shows D, Bhagavathula N, Aslam MN, Varani J, Towne JE, Sims JE: IL-1RL2 and its ligands contribute to the cytokine network in psoriasis. J Immunol 185: 4354–4362, 2010 [DOI] [PubMed] [Google Scholar]
- 3.Tortola L, Rosenwald E, Abel B, Blumberg H, Schäfer M, Coyle AJ, Renauld JC, Werner S, Kisielow J, Kopf M: Psoriasiform dermatitis is driven by IL-36-mediated DC-keratinocyte crosstalk. J Clin Invest 122: 3965–3976, 2012 [DOI] [PMC free article] [PubMed] [Google Scholar]
- 4.Marrakchi S, Guigue P, Renshaw BR, Puel A, Pei XY, Fraitag S, Zribi J, Bal E, Cluzeau C, Chrabieh M, Towne JE, Douangpanya J, Pons C, Mansour S, Serre V, Makni H, Mahfoudh N, Fakhfakh F, Bodemer C, Feingold J, Hadj-Rabia S, Favre M, Genin E, Sahbatou M, Munnich A, Casanova JL, Sims JE, Turki H, Bachelez H, Smahi A: Interleukin-36-receptor antagonist deficiency and generalized pustular psoriasis. N Engl J Med 365: 620–628, 2011 [DOI] [PubMed] [Google Scholar]
- 5.Frey S, Derer A, Messbacher ME, Baeten DL, Bugatti S, Montecucco C, Schett G, Hueber AJ: The novel cytokine interleukin-36α is expressed in psoriatic and rheumatoid arthritis synovium. Ann Rheum Dis 72: 1569–1574, 2013 [DOI] [PubMed] [Google Scholar]
- 6.Towne JE, Garka KE, Renshaw BR, Virca GD, Sims JE: Interleukin (IL)-1F6, IL-1F8, and IL-1F9 signal through IL-1Rrp2 and IL-1RAcP to activate the pathway leading to NF-kappaB and MAPKs. J Biol Chem 279: 13677–13688, 2004 [DOI] [PubMed] [Google Scholar]
- 7.Latz E, Xiao TS, Stutz A: Activation and regulation of the inflammasomes. Nat Rev Immunol 13: 397–411, 2013 [DOI] [PMC free article] [PubMed] [Google Scholar]
- 8.Kahlenberg JM, Kaplan MJ: The inflammasome and lupus: Another innate immune mechanism contributing to disease pathogenesis? Curr Opin Rheumatol 26: 475–481, 2014 [DOI] [PMC free article] [PubMed] [Google Scholar]
- 9.Zhao J, Wang H, Huang Y, Zhang H, Wang S, Gaskin F, Yang N, Fu SM: Lupus nephritis: Glycogen synthase kinase 3β promotion of renal damage through activation of the NLRP3 inflammasome in lupus-prone mice. Arthritis Rheumatol 67: 1036–1044, 2015 [DOI] [PMC free article] [PubMed] [Google Scholar]
- 10.Haas KM, Watanabe R, Matsushita T, Nakashima H, Ishiura N, Okochi H, Fujimoto M, Tedder TF: Protective and pathogenic roles for B cells during systemic autoimmunity in NZB/W F1 mice. J Immunol 184: 4789–4800, 2010 [DOI] [PMC free article] [PubMed] [Google Scholar]
- 11.Tucci M, Stucci S, Strippoli S, Silvestris F: Cytokine overproduction, T-cell activation, and defective T-regulatory functions promote nephritis in systemic lupus erythematosus. J Biomed Biotechnol 2010: 457146, 2010 [DOI] [PMC free article] [PubMed] [Google Scholar]
- 12.Hodgkins KS, Schnaper HW: Tubulointerstitial injury and the progression of chronic kidney disease. Pediatr Nephrol 27: 901–909, 2012 [DOI] [PMC free article] [PubMed] [Google Scholar]
- 13.Rodríguez-Iturbe B, García García G: The role of tubulointerstitial inflammation in the progression of chronic renal failure. Nephron Clin Pract 116: c81–c88, 2010 [DOI] [PubMed] [Google Scholar]
- 14.Ichii O, Otsuka S, Sasaki N, Yabuki A, Ohta H, Takiguchi M, Hashimoto Y, Endoh D, Kon Y: Local overexpression of interleukin-1 family, member 6 relates to the development of tubulointerstitial lesions. Lab Invest 90: 459–475, 2010 [DOI] [PubMed] [Google Scholar]
- 15.Foster AM, Baliwag J, Chen CS, Guzman AM, Stoll SW, Gudjonsson JE, Ward NL, Johnston A: IL-36 promotes myeloid cell infiltration, activation, and inflammatory activity in skin. J Immunol 192: 6053–6061, 2014 [DOI] [PMC free article] [PubMed] [Google Scholar]
- 16.Vigne S, Palmer G, Lamacchia C, Martin P, Talabot-Ayer D, Rodriguez E, Ronchi F, Sallusto F, Dinh H, Sims JE, Gabay C: IL-36R ligands are potent regulators of dendritic and T cells. Blood 118: 5813–5823, 2011 [DOI] [PubMed] [Google Scholar]
- 17.Ge S, Hertel B, Susnik N, Rong S, Dittrich AM, Schmitt R, Haller H, von Vietinghoff S: Interleukin 17 receptor A modulates monocyte subsets and macrophage generation in vivo. PLoS One 9: e85461, 2014 [DOI] [PMC free article] [PubMed] [Google Scholar]
- 18.Peng X, Xiao Z, Zhang J, Li Y, Dong Y, Du J: IL-17A produced by both γδ T and Th17 cells promotes renal fibrosis via RANTES-mediated leukocyte infiltration after renal obstruction. J Pathol 235: 79–89, 2015 [DOI] [PubMed] [Google Scholar]
- 19.Broadbelt NV, Stahl PJ, Chen J, Mizrahi M, Lal A, Bozkurt A, Poppas DP, Felsen D: Early upregulation of iNOS mRNA expression and increase in NO metabolites in pressurized renal epithelial cells. Am J Physiol Renal Physiol 293: F1877–F1888, 2007 [DOI] [PubMed] [Google Scholar]
- 20.Tian S, Zhang L, Tang J, Guo X, Dong K, Chen SY: HMGB1 exacerbates renal tubulointerstitial fibrosis through facilitating M1 macrophage phenotype at the early stage of obstructive injury. Am J Physiol Renal Physiol 308: F69–F75, 2015 [DOI] [PMC free article] [PubMed] [Google Scholar]
- 21.Kawada N, Moriyama T, Ando A, Fukunaga M, Miyata T, Kurokawa K, Imai E, Hori M: Increased oxidative stress in mouse kidneys with unilateral ureteral obstruction. Kidney Int 56: 1004–1013, 1999 [DOI] [PubMed] [Google Scholar]
- 22.Felsen D, Schulsinger D, Gross SS, Kim FY, Marion D, Vaughan ED Jr.: Renal hemodynamic and ureteral pressure changes in response to ureteral obstruction: The role of nitric oxide. J Urol 169: 373–376, 2003 [DOI] [PubMed] [Google Scholar]
- 23.Vilaysane A, Chun J, Seamone ME, Wang W, Chin R, Hirota S, Li Y, Clark SA, Tschopp J, Trpkov K, Hemmelgarn BR, Beck PL, Muruve DA: The NLRP3 inflammasome promotes renal inflammation and contributes to CKD. J Am Soc Nephrol 21: 1732–1744, 2010 [DOI] [PMC free article] [PubMed] [Google Scholar]
- 24.Pulskens WP, Butter LM, Teske GJ, Claessen N, Dessing MC, Flavell RA, Sutterwala FS, Florquin S, Leemans JC: Nlrp3 prevents early renal interstitial edema and vascular permeability in unilateral ureteral obstruction. PLoS One 9: e85775, 2014 [DOI] [PMC free article] [PubMed] [Google Scholar]
- 25.Zhu Y, Cui H, Xia Y, Gan H: RIPK3-mediated necroptosis and apoptosis contributes to renal tubular cell progressive loss and chronic kidney disease progression in rats. PLoS One 11: e0156729, 2016 [DOI] [PMC free article] [PubMed] [Google Scholar]
- 26.Pulkkanen KJ, Laukkanen MO, Naarala J, Yla-Herttuala S: False-positive apoptosis signal in mouse kidney and liver detected with TUNEL assay. Apoptosis 5: 329–333, 2000 [DOI] [PubMed] [Google Scholar]
- 27.Linkermann A: Nonapoptotic cell death in acute kidney injury and transplantation. Kidney Int 89: 46–57, 2016 [DOI] [PubMed] [Google Scholar]
- 28.Pindjakova J, Griffin MD: The renal lymph node and immune tolerance to filtered antigens. J Am Soc Nephrol 24: 519–521, 2013 [DOI] [PubMed] [Google Scholar]
- 29.Bagavant H, Deshmukh US, Wang H, Ly T, Fu SM: Role for nephritogenic T cells in lupus glomerulonephritis: Progression to renal failure is accompanied by T cell activation and expansion in regional lymph nodes. J Immunol 177: 8258–8265, 2006 [DOI] [PubMed] [Google Scholar]
- 30.Macconi D, Chiabrando C, Schiarea S, Aiello S, Cassis L, Gagliardini E, Noris M, Buelli S, Zoja C, Corna D, Mele C, Fanelli R, Remuzzi G, Benigni A: Proteasomal processing of albumin by renal dendritic cells generates antigenic peptides. J Am Soc Nephrol 20: 123–130, 2009 [DOI] [PMC free article] [PubMed] [Google Scholar]
- 31.Rogers NM, Ferenbach DA, Isenberg JS, Thomson AW, Hughes J: Dendritic cells and macrophages in the kidney: A spectrum of good and evil. Nat Rev Nephrol 10: 625–643, 2014 [DOI] [PMC free article] [PubMed] [Google Scholar]
- 32.Anders HJ, Muruve DA: The inflammasomes in kidney disease. J Am Soc Nephrol 22: 1007–1018, 2011 [DOI] [PubMed] [Google Scholar]
- 33.Tapmeier TT, Fearn A, Brown K, Chowdhury P, Sacks SH, Sheerin NS, Wong W: Pivotal role of CD4+ T cells in renal fibrosis following ureteric obstruction. Kidney Int 78: 351–362, 2010 [DOI] [PubMed] [Google Scholar]
- 34.Turner JE, Krebs C, Tittel AP, Paust HJ, Meyer-Schwesinger C, Bennstein SB, Steinmetz OM, Prinz I, Magnus T, Korn T, Stahl RA, Kurts C, Panzer U: IL-17A production by renal γδ T cells promotes kidney injury in crescentic GN. J Am Soc Nephrol 23: 1486–1495, 2012 [DOI] [PMC free article] [PubMed] [Google Scholar]
- 35.Ka SM, Lin JC, Lin TJ, Liu FC, Chao LK, Ho CL, Yeh LT, Sytwu HK, Hua KF, Chen A: Citral alleviates an accelerated and severe lupus nephritis model by inhibiting the activation signal of NLRP3 inflammasome and enhancing Nrf2 activation. Arthritis Res Ther 17: 331, 2015 [DOI] [PMC free article] [PubMed] [Google Scholar]
- 36.Chu CL, Yu YL, Shen KY, Lowell CA, Lanier LL, Hamerman JA: Increased TLR responses in dendritic cells lacking the ITAM-containing adapters DAP12 and FcRgamma. Eur J Immunol 38: 166–173, 2008 [DOI] [PMC free article] [PubMed] [Google Scholar]
- 37.Weischenfeldt J, Porse B: Bone marrow-derived macrophages (BMM): Isolation and applications. CSH Protoc 2008: pdb.prot5080, 2008 [DOI] [PubMed] [Google Scholar]
- 38.Ophascharoensuk V, Giachelli CM, Gordon K, Hughes J, Pichler R, Brown P, Liaw L, Schmidt R, Shankland SJ, Alpers CE, Couser WG, Johnson RJ: Obstructive uropathy in the mouse: Role of osteopontin in interstitial fibrosis and apoptosis. Kidney Int 56: 571–580, 1999 [DOI] [PubMed] [Google Scholar]
- 39.Liu D, Wen Y, Tang TT, Lv LL, Tang RN, Liu H, Ma KL, Crowley SD, Liu BC: Megalin/Cubulin-lysosome-mediated albumin reabsorption is involved in the tubular cell activation of NLRP3 inflammasome and tubulointerstitial inflammation. J Biol Chem 290: 18018–18028, 2015 [DOI] [PMC free article] [PubMed] [Google Scholar]
- 40.Yu YL, Chen IH, Shen KY, Huang RY, Wang WR, Chou CJ, Chang TT, Chu CL: A triterpenoid methyl antcinate K isolated from Antrodia cinnamomea promotes dendritic cell activation and Th2 differentiation. Eur J Immunol 39: 2482–2491, 2009 [DOI] [PubMed] [Google Scholar]
- 41.Kuwabara T, Mori K, Mukoyama M, Kasahara M, Yokoi H, Saito Y, Yoshioka T, Ogawa Y, Imamaki H, Kusakabe T, Ebihara K, Omata M, Satoh N, Sugawara A, Barasch J, Nakao K: Urinary neutrophil gelatinase-associated lipocalin levels reflect damage to glomeruli, proximal tubules, and distal nephrons. Kidney Int 75: 285–294, 2009 [DOI] [PubMed] [Google Scholar]
- 42.Yang SM, Ka SM, Wu HL, Yeh YC, Kuo CH, Hua KF, Shi GY, Hung YJ, Hsiao FC, Yang SS, Shieh YS, Lin SH, Wei CW, Lee JS, Yang CY, Chen A: Thrombomodulin domain 1 ameliorates diabetic nephropathy in mice via anti-NF-κB/NLRP3 inflammasome-mediated inflammation, enhancement of NRF2 antioxidant activity and inhibition of apoptosis. Diabetologia 57: 424–434, 2014 [DOI] [PubMed] [Google Scholar]
- 43.Dong X, Swaminathan S, Bachman LA, Croatt AJ, Nath KA, Griffin MD: Antigen presentation by dendritic cells in renal lymph nodes is linked to systemic and local injury to the kidney. Kidney Int 68: 1096–1108, 2005 [DOI] [PubMed] [Google Scholar]
- 44.Zhou X, Fukuda N, Matsuda H, Endo M, Wang X, Saito K, Ueno T, Matsumoto T, Matsumoto K, Soma M, Kobayashi N, Nishiyama A: Complement 3 activates the renal renin-angiotensin system by induction of epithelial-to-mesenchymal transition of the nephrotubulus in mice. Am J Physiol Renal Physiol 305: F957–F967, 2013 [DOI] [PubMed] [Google Scholar]
- 45.Mizuno S, Matsumoto K, Nakamura T: Hepatocyte growth factor suppresses interstitial fibrosis in a mouse model of obstructive nephropathy. Kidney Int 59: 1304–1314, 2001 [DOI] [PubMed] [Google Scholar]
- 46.Pulskens WP, Rampanelli E, Teske GJ, Butter LM, Claessen N, Luirink IK, van der Poll T, Florquin S, Leemans JC: TLR4 promotes fibrosis but attenuates tubular damage in progressive renal injury. J Am Soc Nephrol 21: 1299–1308, 2010 [DOI] [PMC free article] [PubMed] [Google Scholar]
- 47.Bajwa A, Huang L, Kurmaeva E, Gigliotti JC, Ye H, Miller J, Rosin DL, Lobo PI, Okusa MD: Sphingosine 1-phosphate receptor 3-deficient dendritic cells modulate splenic responses to ischemia-reperfusion injury. J Am Soc Nephrol 27: 1076–1090, 2016 [DOI] [PMC free article] [PubMed] [Google Scholar]
- 48.Yang SM, Chan YL, Hua KF, Chang JM, Chen HL, Tsai YJ, Hsu YJ, Chao LK, Feng-Ling Y, Tsai YL, Wu SH, Wang YF, Tsai CL, Chen A, Ka SM: Osthole improves an accelerated focal segmental glomerulosclerosis model in the early stage by activating the Nrf2 antioxidant pathway and subsequently inhibiting NF-κB-mediated COX-2 expression and apoptosis. Free Radic Biol Med 73: 260–269, 2014 [DOI] [PubMed] [Google Scholar]
- 49.Majdalawieh A, Zhang L, Ro HS: Adipocyte enhancer-binding protein-1 promotes macrophage inflammatory responsiveness by up-regulating NF-kappaB via IkappaBalpha negative regulation. Mol Biol Cell 18: 930–942, 2007 [DOI] [PMC free article] [PubMed] [Google Scholar]
- 50.Ka SM, Rifai A, Chen JH, Cheng CW, Shui HA, Lee HS, Lin YF, Hsu LF, Chen A: Glomerular crescent-related biomarkers in a murine model of chronic graft versus host disease. Nephrol Dial Transplant 21: 288–298, 2006 [DOI] [PubMed] [Google Scholar]
- 51.Griffin MD, Lutz WH, Phan VA, Bachman LA, McKean DJ, Kumar R: Potent inhibition of dendritic cell differentiation and maturation by vitamin D analogs. Biochem Biophys Res Commun 270: 701–708, 2000 [DOI] [PubMed] [Google Scholar]
- 52.Yang SM, Ka SM, Hua KF, Wu TH, Chuang YP, Lin YW, Yang FL, Wu SH, Yang SS, Lin SH, Chang JM, Chen A: Antroquinonol mitigates an accelerated and progressive IgA nephropathy model in mice by activating the Nrf2 pathway and inhibiting T cells and NLRP3 inflammasome. Free Radic Biol Med 61: 285–297, 2013 [DOI] [PubMed] [Google Scholar]
Associated Data
This section collects any data citations, data availability statements, or supplementary materials included in this article.


