Abstract
Several animal studies have shown an important role for endoplasmic reticulum (ER) stress in AKI, whereas human studies are lacking. We recently reported that Reticulon-1A (RTN1A) is a key mediator of ER stress and kidney cell injury. Here, we investigated whether modulation of RTN1A expression during AKI contributes to the progression to CKD. In a retrospective study of 51 patients with AKI, increased expression of RTN1A and other ER stress markers were associated with the severity of kidney injury and with progression to CKD. In an inducible tubular cell–specific RTN1A-knockdown mouse model subjected to folic acid nephropathy (FAN) or aristolochic acid nephropathy, reduction of RTN1A expression during the initial stage of AKI attenuated ER stress and kidney cell injury in early stages and renal fibrosis development in later stages. Treatment of wild-type mice with tauroursodeoxycholic acid, an inhibitor of ER stress, after the induction of kidney injury with FA facilitated renoprotection similar to that observed in RTN1A-knockdown mice. Conversely, in transgenic mice with inducible tubular cell–specific overexpression of RTN1A subjected to FAN, induction of RTN1A overexpression aggravated ER stress and renal injury at the early stage and renal fibrosis at the late stage of FAN. Together, our human and mouse data suggest that the RTN1A-mediated ER stress response may be an important determinant in the severity of AKI and maladaptive repair that may promote progression to CKD.
Keywords: acute kidney injury, reticulon-1, renal fibrosis, renal tubular epithelial cells, ER stress
Because the kidney has the ability to return to normal function after an insult, the functional loss seen in patients with AKI is transient in most cases. However, evidence from humans and experimental models suggests that complete functional recovery is impaired in certain conditions1,2 and that survivors of AKI have a significantly increased risk to develop CKD.3,4 AKI with severe and persistent kidney cell injury will more likely progress to CKD.1,5 Animal studies demonstrated that AKI-induced G2/M cell cycle arrest and maladaptive repair lead to the activation of profibrotic and proinflammatory responses that mediate the progression of CKD.6,7 The key elements of this maladaptive response include tubular cell loss, prolonged inflammatory response, and activation of myofibroblasts.8 However, the exact cellular and molecular mechanisms mediating the progression of AKI to CKD remain incompletely understood.
Recent studies suggest a significant role of endoplasmic reticulum (ER) stress in kidney cell injury. ER stress is known to contribute to the progression of CKD such as diabetic nephropathy.9–12 Elevated urinary protein excretion is associated with ER stress and tubular cell injury.13–15 ER stress has also been considered as a key pathologic process leading to tubular cell injury and loss in AKI.16 Reactive oxygen species–mediated (ROS-mediated) ER stress is involved in contrast-induced renal tubular cell apoptosis,17 and ischemia-reperfusion injury induces renal tubule pyroptosis via the C/EBP homologous protein (CHOP)–caspase-11 pathway.18 It was also shown that paracetamol induces renal tubular injury via ER stress.19 Recent studies suggest that angiogenin is a novel mediator of the ER stress–dependent inflammatory response and a potential noninvasive biomarker of AKI.20 Deficiency of CHOP expression attenuates renal ischemia-reperfusion injury in mice.21 ER stress inhibitor 4-phenylbutyrate is able to protect the kidney from tunicamycin-induced AKI through the repression of ER stress–induced CHOP expression.22 Although many studies such as these provide a strong evidence for a critical role of ER stress in AKI in animal models, the human studies are nevertheless lacking. Furthermore, no study has examined whether intensity of the ER stress at the early stage of AKI significantly contributes to the progression to CKD.
Reticulons, a family of ER membrane–associated proteins, are known to induce apoptosis of neuronal cells in neurodegenerative diseases.23–27 The human RTN1 gene has three transcript variants that encode for three RTN1 isoforms: RTN1A, RTN1B, and RTN1C. They share the same sequence homology in C-terminal and transmembrane domains but differ in their N-terminal domain.28 Recently, we reported that RTN1A expression is highly associated with the progression of human diabetic nephropathy and that increased RTN1A expression in tubular epithelial cells induces apoptosis through the activation of ER stress.29 Knockdown of RTN1A expression attenuated ER stress, apoptosis, and renal injury in mice with unilateral ureteral obstruction, diabetic nephropathy, and albumin-overload kidney disease.29,30 In addition, we demonstrated that RTN1A interacts with PERK (PKR-like ER kinase), leading to the activation of CHOP-mediated ER stress pathways.29 On the basis of these findings, we hypothesized that increased expression of RTN1A at the AKI stage may promote a heightened and sustained ER stress response, leading to more severe tubular cell injury that may contribute to CKD progression. In this study, we sought to determine this hypothesis in both patients and mouse models of AKI.
Results
Expression of ER Stress Markers Correlates with the Severity of AKI and Progression to CKD in Human Kidneys
To examine whether ER stress was involved in human kidneys in AKI, we sought to determine the level of ER stress markers in kidneys of patients with AKI. We performed a retrospective review of all patients with a diagnosis of AKI from January of 2008 to June of 2015 in three major hospitals in Shanghai (Shanghai Jiao Tong University Affiliated Sixth People’s Hospital, Shanghai Jiao Tong University Affiliated Xinhua Hospital, and Second Military Medical University Affiliated Changhai Hospital). A total of 51 patients with AKI who underwent a renal biopsy were identified, including nine cases of acute tubular necrosis (ATN) and 42 cases of acute interstitial nephropathy (AIN). The average time of follow-up for these patients was 34.2 months. Ten nephrectomy samples of normal kidneys served as controls. The diagnosis and staging of AKI was performed on the basis of the Kidney Disease: Improving Global Outcomes (KDIGO) AKI classification and staging system.31 Among the 51 patients, there were 11 patients with stage 1, 13 patients with stage 2, and 27 patients with stage 3 (Supplemental Table 1). Among the stage 3 patients, 12 patients had progressed to CKD, whereas AKI was completely resolved in the other 15 patients. The clinical characteristics of these patients are summarized in Supplemental Table 2. The peak serum creatinine (sCr) and eGFR levels as well as peak-to-nadir sCr were compared among patients with different stages of AKI (Supplemental Figure 1). We then examined the expression pattern of key ER stress markers, namely GRP78 (glucose-regulated protein, 78 kD), p-PERK (the phosphorylated form of PERK), CHOP, and XBP-1s (X-box binding protein 1, spliced form), as well as RTN1A in their kidneys by immunohistochemical analysis.
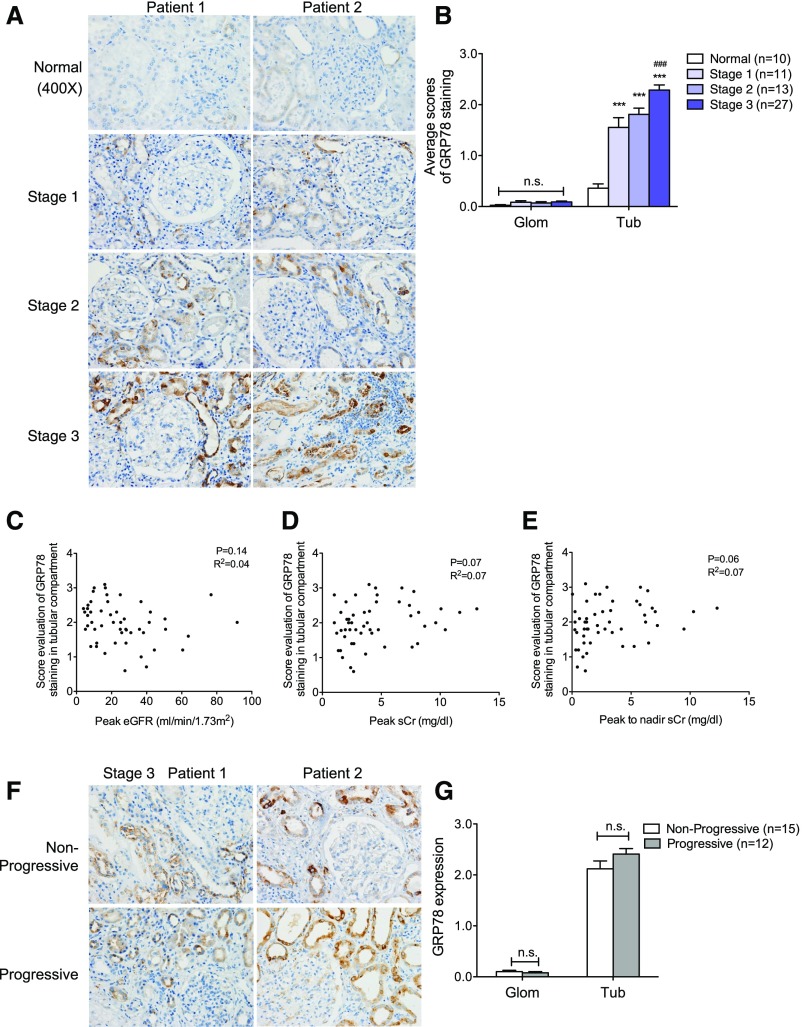
We first examined the expression pattern of GRP78, an ER-resident molecular chaperone that controls the activation of transmembrane ER sensors.32,33 We found that GRP78 staining increased in kidneys of patients with AKI as compared with normal controls and localized mostly in the tubular compartment (Figure 1A). In addition, increased GRP78 expression was observed in patients with more advanced stages of AKI (Figure 1, A and B). However, we did not detect any correlation between the intensity of GRP78 staining and renal function of patients with AKI (Figure 1, C–E). Furthermore, there was no difference in GRP78 expression between stage 3 AKI patients with and without progression to CKD (classified as progressive and nonprogressive, respectively) (Figure 1, F and G). We also did not detect any correlation between the intensity of tubular expression of GRP78 and proteinuria in patients with AKI (Supplemental Figure 2A).
Figure 1.
Expression of GRP78 was increased in kidneys of patients with AKI. (A) Immunostaining of GRP78 in kidney sections of patients with AKI. Representative images of two randomized patients in four groups consisting of stage 1 (n=11), stage 2 (n=13), stage 3 (n=27), and normal kidneys of nephrectomy samples (n=10). Original magnification, ×400. (B) Semiquantitative scoring of GRP78 staining for both glomerular and tubular interstitial compartments is summarized in a bar graph. ***P<0.001, compared with normal samples; ###P<0.001, compared with stage 1 or stage 2. (C–E) Correlation between the intensity of GRP78 staining in tubular compartment and renal function (peak eGFR [C], peak sCr [D], or peak-to-nadir sCr [E]) was calculated in patients with AKI using Pearson correlation analysis. P and R2 are indicated on the graph; n=51. (F) Immunostaining of GRP78 in kidney sections of AKI stage 3 patients defined as nonprogressive (those that did not progress into CKD) or progressive (those that progressed into CKD). The representative pictures of staining are shown for patients in both groups. Original magnification, ×400. (G) Semiquantitative scoring of GRP78 staining in kidneys of both nonprogressive and progressive AKI stage 3 patients is summarized in a bar graph. Glom, glomerular; Tub, tubular.
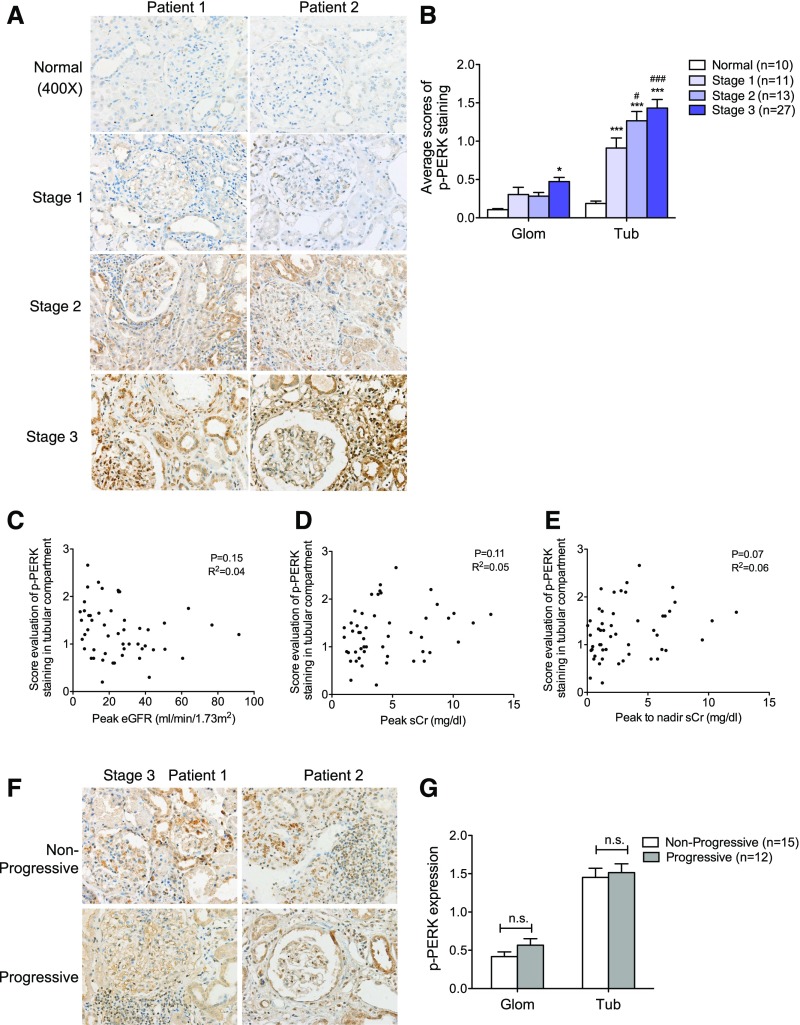
PERK, an ER transmembrane protein kinase, oligomerizes and becomes autophosphorylated in response to ER stress. Similar to GRP78, expression of p-PERK also increased in the AKI kidneys as compared with those of normal controls (Figure 2, A and B), with more pronounced staining patterns in the tubular compartment than in the glomerular compartment of the AKI kidneys. Nevertheless, similar to GRP78, we did not detect any correlation between the tubular or glomerular expression of p-PERK and renal function in patients with AKI (Figure 2, C–E, Supplemental Figure 3A) or any difference in expression between patients with progressive and nonprogressive AKI (Figure 2, F and G).
Figure 2.
Expression of p-PERK was increased in kidneys of patients with AKI. (A) Immunostaining of p-PERK in kidney sections of patients with AKI. Representative images are shown for each group. Original magnification, ×400. (B) Semiquantitative scoring of p-PERK staining for both glomerular and tubular interstitial compartments is summarized in a bar graph. *P<0.05 and ***P<0.001, compared with normal; #P<0.05 and ###P<0.001, compared with stage 1. (C–E) Correlation between the intensity of p-PERK staining and tubular compartment and renal function was calculated in patients with AKI using Pearson correlation analysis. P and R2 are indicated on the graph; n=51. (F) Immunostaining of p-PERK in kidney sections of AKI stage 3 patients with or without disease progression. The representative pictures are shown for each group. Original magnification, ×400. (G) Semiquantitative scoring of p-PERK staining in kidneys of both nonprogressive and progressive AKI stage 3 patients is summarized in a bar graph. P values between nonprogressive and progressive groups are annotated. Glom, glomerular; Tub, tubular.
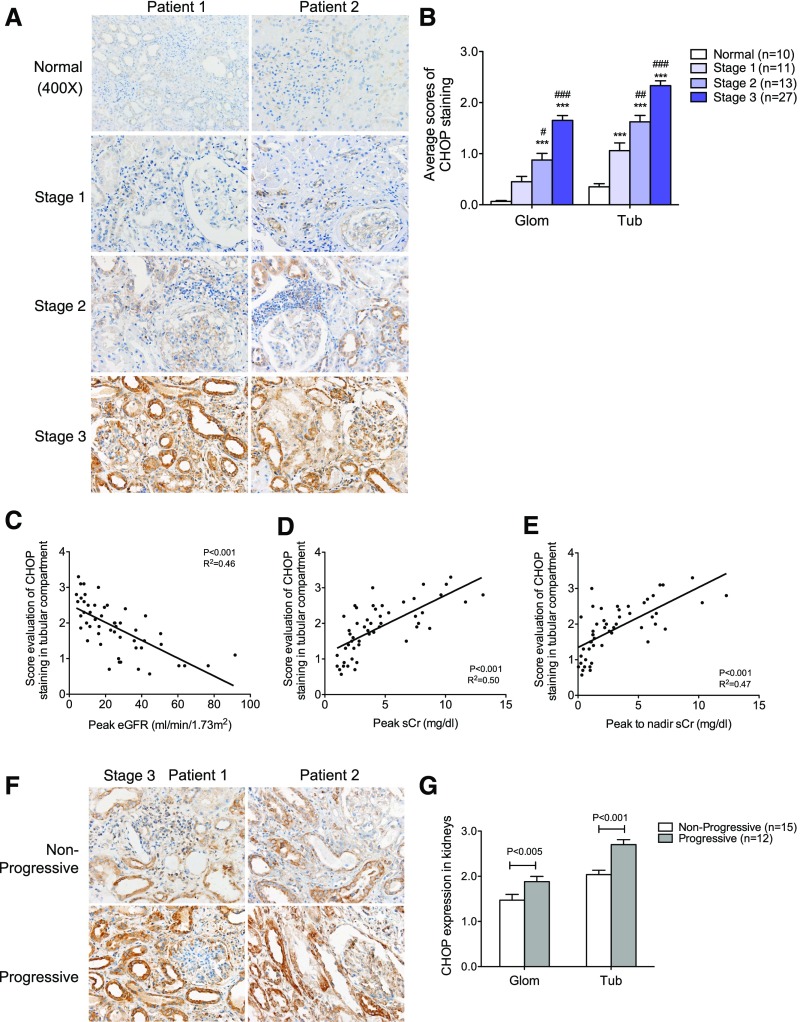
We next examined the expression of CHOP. It is known that persistent activation of CHOP mediates ER stress–induced apoptosis of cells,34 and thus CHOP is considered to be a marker of nonadaptive ER stress. CHOP expression was increased in both glomerular and tubular compartments in patients with AKI, with a more prominent staining in the tubular compartment (Figure 3, A and B). Interestingly, the intensity of CHOP staining in both glomerular and tubular compartments was inversely correlated with the renal function of patients with AKI (Figure 3, C–E, Supplemental Figure 3B). In addition, the intensity of both glomerular and tubular staining of CHOP was higher in the patients with stage 3 AKI that progressed into CKD than those that did not (Figure 3, F and G), suggesting that increased apoptosis in response to sustained ER stress may result in increased severity of AKI, promoting the CKD transition. However, we did not observe any correlation between glomerular or tubular CHOP staining and proteinuria in these patients (Supplemental Figure 2B).
Figure 3.
Expression of CHOP was increased in kidneys of patients with AKI. (A) Immunostaining of CHOP in kidney sections of patients with AKI. Representative images are shown for each group. Original magnification, ×400. (B) Semiquantitative scoring of CHOP staining for both glomerular and tubular interstitial compartments is summarized in a bar graph. ***P<0.001, compared with normal; #P<0.05, ##P<0.01, and ###P<0.001, compared with Stage 1. (C–E) Correlation between the intensity of CHOP staining in both glomerular and tubular compartment and renal function was calculated in patients with AKI using Pearson correlation analysis. P and R2 are indicated on the graph; n=51. (F) Immunostaining of CHOP in kidney sections of AKI stage 3 patients with or without disease progression. The representative pictures of staining are shown for both groups. Original magnification, ×400. (G) Semiquantitative scoring of CHOP staining in kidneys of both nonprogressive and progressive AKI stage 3 patients is summarized in a bar graph. Glom, glomerular; Tub, tubular.
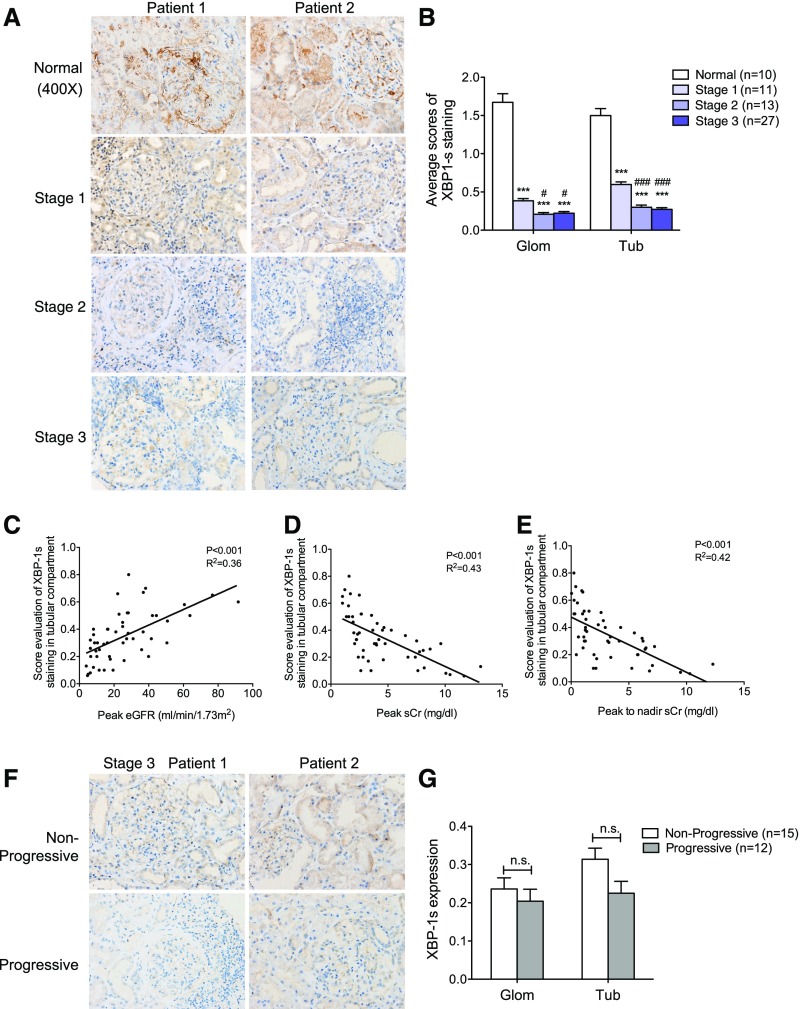
We also examined the expression of X-box binding protein 1 (XBP-1), which is thought to have a protective effect on ER stress–induced cell injury by promoting the adaptive ER stress response.33,35 Prolonged nonadaptive ER stress has been shown to attenuate both the unspliced and spliced isoform of XBP-1 expression (XBP-1/XBP-1s), while continuing to activate the other ER stress pathway involving PERK and CHOP.36 In contrast to other ER stress proteins, we found that XBP-1s expression in both glomerular and tubular compartments was reduced in the AKI kidneys as compared with those of normal controls (Figure 4, A and B). There was also an inverse correlation between tubular XBP-1s expression and renal function (Figure 4, C–E). We also detected a trend in decreased expression of XBP-1s in stage 3 patients with progressive AKI versus nonprogressive AKI (Figure 4, F and G). These findings are consistent with the loss of the protective effects of XBP-1 in prolonged ER stress observed in patients with AKI.
Figure 4.
Expression of XBP-1s was decreased in kidneys of patients with AKI. (A) Immunostaining of XBP-1s in kidney sections of patients with AKI. The representative images are shown for each group. Original magnification, ×400. (B) Semiquantitative scoring of XBP-1s staining for both glomerular and tubular interstitial compartments was summarized in a bar graph. *P<0.05, compared with normal; #P<0.05, compared with stage 1. (C–E) Decreased expression of XBP-1s in tubular compartment was correlated inversely with renal function in patients with AKI using Pearson correlation analysis. P and R2 are indicated on the graph; n=51. (F) Immunostaining of XBP-1s in kidney sections of AKI stage 3 patients with or without disease progression. The representative pictures are shown for both nonprogressive and progressive groups. (G) Semiquantitative scoring of XBP-1s staining in kidneys of both nonprogressive and progressive AKI stage 3 patients is summarized in a bar graph. Glom, glomerular; Tub, tubular.
Expression of RTN1A Correlates with the Severity of AKI, ER Stress, and Progression to CKD
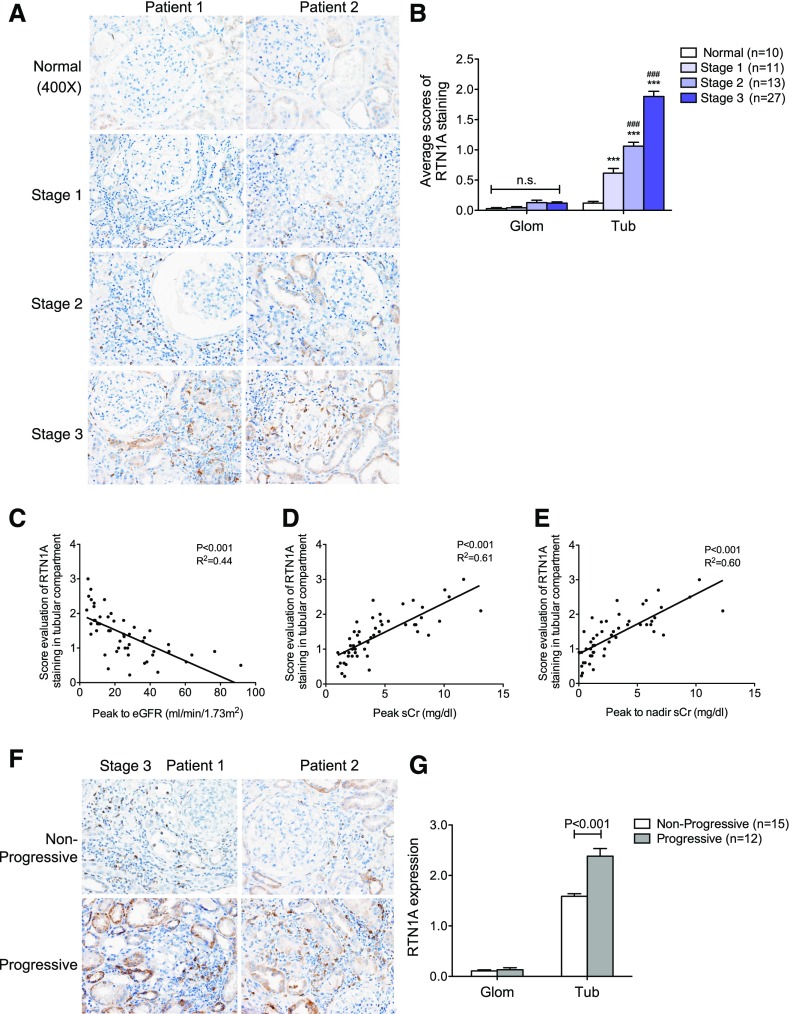
Our previous study showed that RTN1A expression increases in response to kidney cell injury and that it mediates the activation of PERK and CHOP to heighten ER stress response, leading to worsened CKD progression.29 We confirmed that there was a significant increase of RTN1A staining in the kidneys of patients with AKI, which was found mostly in the tubular compartment (Figure 5A). The extent of RTN1A expression also progressively increased from stage 1 to stage 3 (Figure 5, A and B). Interestingly, the tubular expression of RTN1A correlated with renal function in these patients with AKI in a manner similar to that observed for CHOP (Figure 5, C–E). In addition, tubular expression of RTN1A was significantly increased in stage 3 patients that progressed to CKD as compared with those that did not (Figure 5, F and G). We also observed a correlation of RTN1A expression with expression of ER stress markers such as GRP78, CHOP, and XBP-1s in the tubular compartment (Supplemental Table 3), consistent with our previous finding that increased RTN1A results in heightened ER stress. However, we again did not observe any correlation between glomerular or tubular RTN1A expression and proteinuria (Supplemental Figure 2C).
Figure 5.
The expression of RTN1A was increased in kidneys of patients with AKI. (A) Immunostaining of RTN1A in kidney sections of patients with AKI showed that the expression of RTN1A was mainly increased in the tubular interstitial compartment of patients with AKI. The representative images are shown for each group. Original magnification, ×400. (B) Semiquantitative scoring of RTN1A staining for both glomerular and tubular interstitial compartments is summarized in a bar graph. ***P<0.001, compared with normal; ###P<0.001, compared with stage 1; n.s., not significant. (C–E) Increased expression of RTN1A in the tubular compartment was associated with renal function in patients with AKI using Pearson correlation analysis. P and R2 are indicated on the graph; n=51. (F) Immunostaining of RTN1A in kidney sections of AKI stage 3 patients with or without disease progression. The representative pictures are shown for both nonprogressive and progressive groups. Original magnification, ×400. (G) Semiquantitative scoring of RTN1A staining in nonprogressive and progressive AKI stage 3 patients is summarized in a bar graph. Glom, glomerular; Tub, tubular.
Rtn1a Knockdown in Renal Tubules Attenuates ER Stress and Apoptosis during the Early Stage of Kidney Injury and Subsequent Renal Fibrosis in Mice with Folic Acid Nephropathy
Because we found a strong association between RTN1A, ER stress response, and severity of early acute injury in human kidneys, and because our previous work showed that RTN1A is intricately involved in the ER stress response and apoptosis,29 we reasoned that RTN1A may play a pivotal role in ER stress response during the initial kidney injury that may influence the long-term outcome. In order to determine whether RTN1A has a causative effect during the early stage of kidney injury leading to worsened kidney disease, we sought to determine the effects of transient decrease or increase in RTN1A expression in the setting of AKI. Because the majority of the human samples that we had obtained consisted of patients with AIN, we decided to test our hypothesis similarly in the experimental models of toxicity-mediated AKI, namely folic acid nephropathy (FAN) and aristolochic acid nephropathy (AAN).
We first examined the effects of reduced RTN1A in FAN. We employed an inducible, tubular cell–specific Rtn1a-knockdown mouse model by crossing Pax8–reverse tetracycline transactivator (rtTA) mice with TRE-Rtn1a-shRNA transgenic mice, as described in our previous study (Pax8;Rtn1aRNAi).29 Mice expressing shRNA sequence against firefly luciferase gene (Pax8;LuciRNAi) were used as controls.29 Both Pax8;Rtn1aRNAi and Pax8;LuciRNAi mice were fed with doxycycline (Dox)-supplemented chow (625 mg/kg) for 3 weeks to induce the expression of respective shRNAs. Three weeks post–Dox-induction, Pax8;Rtn1aRNAi and Pax8;LuciRNAi mice were injected with FA or with vehicle control. Dox-supplemented chow was withdrawn 7 days post–FA injection, allowing for a transient knockdown of Rtn1a expression only during the early stage of kidney injury. Mice were euthanized at either 3 days postinjection to study early kidney injury or 4 weeks postinjection to assess the extent of renal fibrosis that ensues with sustained injury. In addition, to determine whether the transient suppression of ER stress response after the induction of kidney injury would have similar effects to those of RTN1A suppression, wild-type (WT) mice were treated with tauroursodeoxycholic acid (TUDCA), an ER stress inhibitor, or vehicle control from day 1 to day 7 post–FA injection, and their kidneys were harvested 4 weeks post–FA injection.
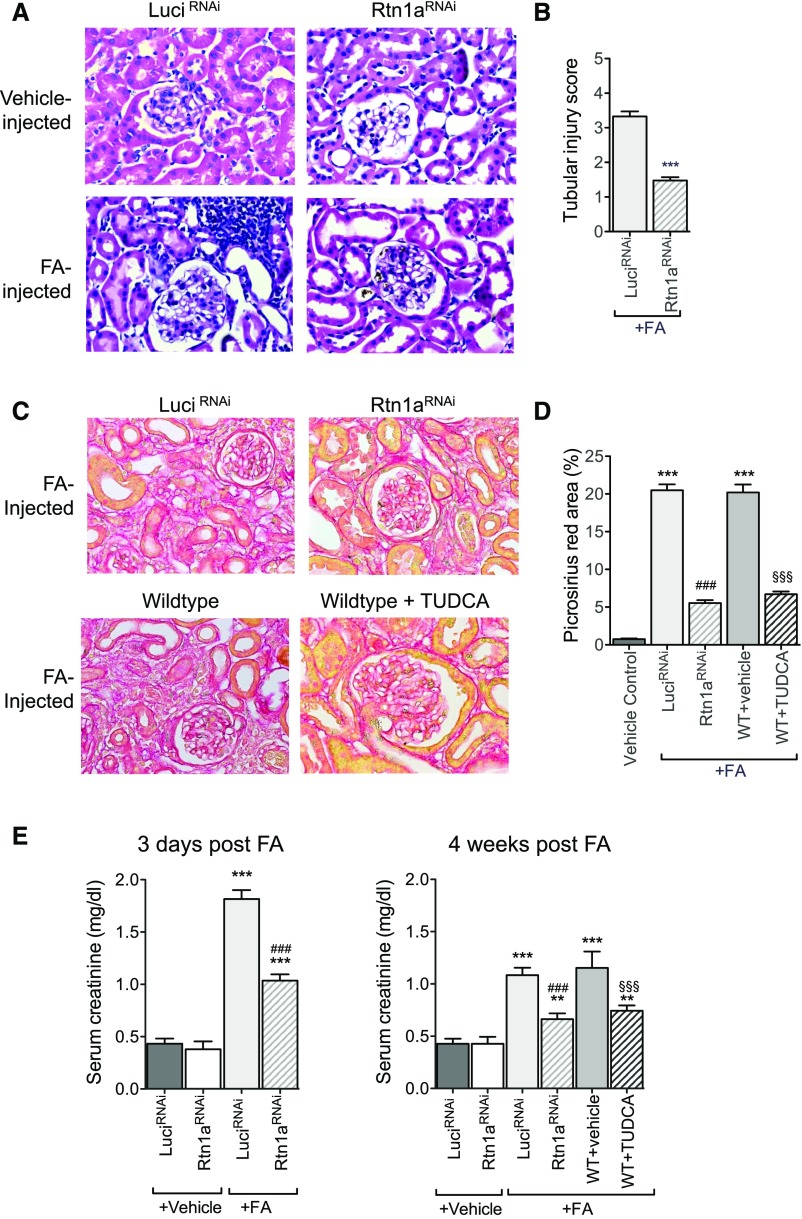
As expected, histologic analysis showed a significant tubular cell injury and infiltration of inflammatory cells in FA-injected mice as compared with vehicle-injected mice at 3 days postinjection (Figure 6A). However, these injuries were markedly attenuated in the Pax8;Rtn1aRNAi mice compared with Pax8;LuciRNAi (Figure 6, A and B). Assessment of renal fibrosis in kidneys at 4 weeks by picrosirius red, Masson trichrome staining, and collagen I immunostaining showed a significant renal fibrosis development in Pax8;LuciRNAi FAN mice, which was markedly attenuated in Pax8;Rtn1aRNAi FAN mice (Figure 6, C and D, Supplemental Figure 4). Fibrosis was similarly attenuated in TUDCA-treated WT mice in comparison to vehicle-treated mice (Figure 6, C and D, Supplemental Figure 4). Their renal function was then assessed by sCr and blood urea nitrogen (BUN) levels at both 3 days and 4 weeks postinjection (Figure 6E, Supplemental Figure 5A). Consistent with the histologic observations, both Pax8;Rtn1aRNAi and TUDCA-treated FAN mice had considerably lower BUN and sCr in comparison to Pax8;LuciRNAi and vehicle-treated FAN mice at both early and late stages of kidney injury, indicating that the transient reduction in RTN1A expression or TUDCA-mediated ER stress inhibition during the early stage of kidney injury ameliorated further disease progression.
Figure 6.
Rtn1a knockdown in renal tubules attenuated early renal injury and renal fibrosis in mice with FAN. Pax8;Rtn1aRNAi (Rtn1aRNAi) and Pax8;Luci RNAi (Luci RNAi) mice received either FA or vehicle injection after 3 weeks’ Dox feeding and Dox was withdrawn at day 7 after FA injection. WT mice injected with FA were treated with TUDCA or vehicle starting at day 1 after FA injection and ending at day 7. Mice were euthanized at either day 3 postinjection for assessing AKI or week 4 postinjection for analysis of renal fibrosis (n=5 in each group). (A) Representative images of H&E-stained kidney sections of mice at 3 days postinjection. Original magnification, ×400. (B) Tubular injury scoring of kidneys at 3 days postinjection in FA-treated mice. (C) Representative images of picrosirius red–stained kidney sections of mice at 4 weeks postinjection. Original magnification, ×400. (D) Picrosirius red–positive areas were quantified as the percentage of the sirius red–positive area to total kidney area per field (n=5 mice). (E) Renal function was assessed at 3 days and 4 weeks postinjection by measuring sCr levels. **P<0.01 and ***P<0.001 compared with vehicle-treated control mice; ###P<0.001 compared with FA-treated LuciRNAi or FA-treated WT mice; and §§§P<0.001 compared with vehicle-treated, FA-injected WT mice (n=5 in each group).
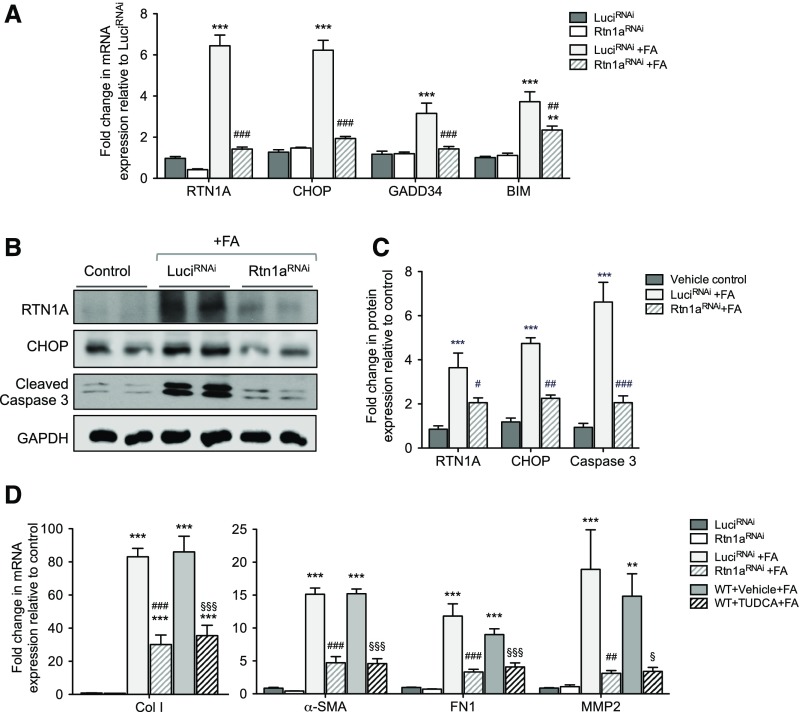
In order to confirm whether the renoprotection observed in the Pax8;Rtn1aRNAi kidneys in FAN was indeed due to the inhibition of ER stress and apoptosis during early kidney injury, we examined the markers of ER stress and apoptosis at 3 days post–FA injection (Figure 7A). We found that FA injection markedly increased the mRNA levels for RTN1A, markers of ER stress (CHOP and GADD34), and apoptosis (BIM) in Pax8;LuciRNAi kidneys, which were significantly suppressed in Pax8;Rtn1aRNAi kidneys. Western blot analysis also revealed that at 3 days post–FA injection the protein levels of RTN1A, CHOP, and cleaved caspase-3 were elevated in Pax8;LuciRNAi kidneys, which were all significantly suppressed in Pax8;Rtn1aRNAi kidneys (Figure 7, B and C). At 4 weeks post–FA injection, consistent with the Masson trichrome and picrosirius red staining, we found that the expression of fibrosis markers (collagen I, fibronectin, MMP2, and α-SMA) was highly elevated in the Pax8;LuciRNAi and vehicle-treated WT kidneys, whereas it was significantly suppressed in Pax8;Rtn1aRNAi and TUDCA-treated WT kidneys (Figure 7D). Given that the renal function and the expression levels of fibrosis markers at 4 weeks post–FA injury are altered by transient knockdown of Rtn1a or by short-term treatment with TUDCA immediately after the early injury, our data suggest that the early inhibition of ER stress reduces the extent of early kidney injury that may influence the subsequent disease progression and renal fibrosis.
Figure 7.
Rtn1a knockdown in renal tubules attenuated the early expression of ER stress and apoptosis markers and subsequent expression of renal fibrosis markers in mice with FAN. (A) Real-time PCR analysis of ER stress markers in mouse kidneys at 3 days postinjection. (B) Western blot analyses of markers of ER stress and apoptosis at 3 days postinjection. (C) Densitometric analysis of RTN1A, CHOP, and cleaved caspase-3 in kidney lysates of mice 3 days postinjection. (D) Real-time PCR analysis of fibrosis markers at 4 weeks postinjection. **P<0.01 and ***P<0.001 compared with vehicle-treated control mice; #P<0.05, ##P<0.01, and ###P<0.001 compared with FA-injected LuciRNAi mice; §P<0.05 and §§§P<0.001 compared with vehicle-treated, FA-injected WT mice (n=5 in each group).
RTN1A Overexpression in Renal Tubules Aggravates ER Stress and Apoptosis During the Early Stage of Kidney Injury and Worsens Renal Fibrosis in Mice with FAN
Because transient reduction in RTN1A levels during early kidney injury was found to be renoprotective in FAN, we examined whether the transient overexpression of RTN1A in tubular cells might conversely heighten ER stress and apoptosis of tubular cells, and aggravate renal fibrosis in FAN. We generated a tetracycline-inducible transgenic mouse model of hRTN1A overexpression, TRE-hRTN1A (Supplemental Figure 6A shows the IRES-containing bicistronic expression vector that allows for a simultaneous expression of His-tagged RTN1A protein and EGFP). These were crossed with Pax8-rtTA transgenic mice in order to achieve the inducible renal tubule–specific RTN1A overexpression (Pax8;RTN1AOE). We confirmed that hRTN1A overexpression was specifically induced in mice fed with Dox-supplemented chow by detection of EGFP signal in the kidney, which showed approximately 50%–60% of EGFP signal in the renal tubular epithelial cells (Supplemental Figure 6C). We next induced FAN in Pax8;RTN1AOE and in the WT littermates as performed above. In order to achieve a transient overexpression of hRTN1A, Dox was administered 3 weeks before FA injection and withdrawn at day 7 post–FA injection. Mice were euthanized at either 3 days or 4 weeks post–FA injection, similarly to above.
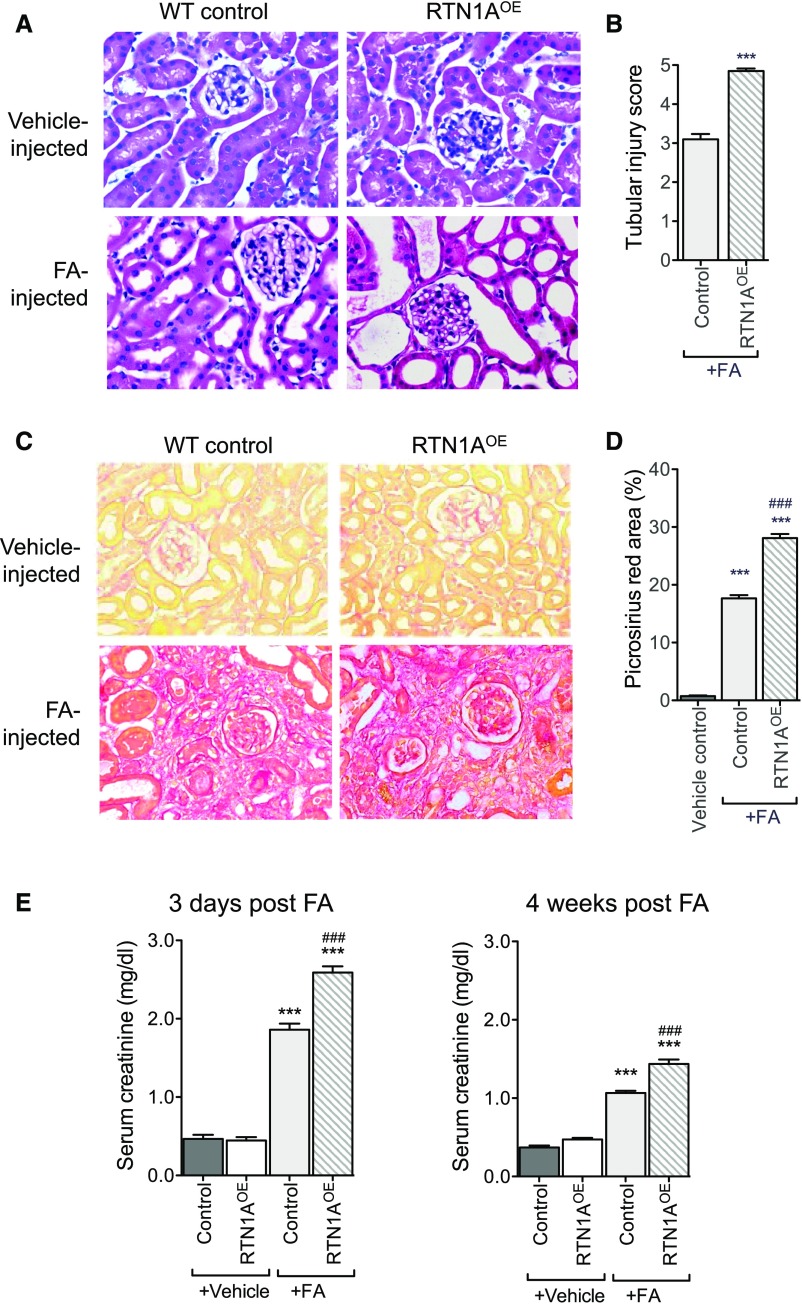
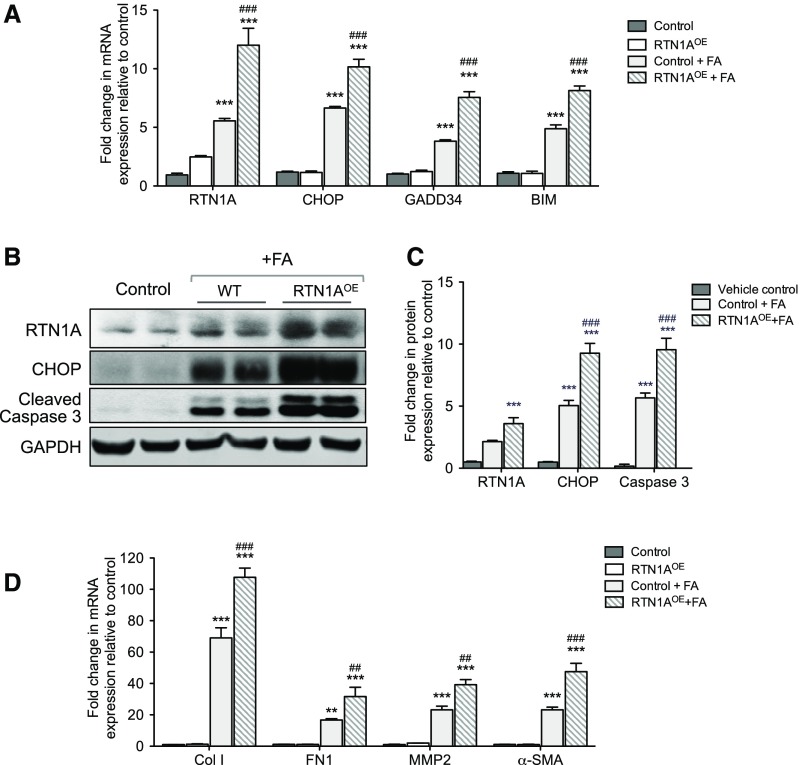
Histologic analysis of their kidneys revealed that Pax8;Rtn1aOE mice developed more severe renal injury at day 3 and renal fibrosis at week 4 than WT control mice in response to FA (Figure 8, A–D, Supplemental Figure 7). Immunostaining of collagen I also confirmed that the overexpression of RTN1A in renal tubules in FAN increased the extent of renal fibrosis when compared with WT mice with FAN (Supplemental Figure 7). Consistent with these findings, Pax8;Rtn1aOE mice had further elevated sCr and BUN than WT mice at both 3 days and 4 weeks post–FA injection (Figure 8E, Supplemental Figure 5B). In addition, real-time PCR analysis showed that Pax8;Rtn1aOE mice had further increased levels of RTN1A, ER stress, and apoptosis markers in the kidneys than WT mice at day 3 after FA injection (Figure 9A). Western blot analysis confirmed a significant induction of RTN1A, CHOP, and cleaved caspase-3 expression in the kidneys of FA-treated mice in comparison to vehicle controls, with further elevations in FA-treated Pax8;Rtn1aOE mice at this early stage of injury (Figure 9, B and C). By 4 weeks post–FA injection mRNA levels of fibrosis markers were further elevated in the kidneys of Pax8;Rtn1aOE mice than in WT mice (Figure 9C). Together with the Rtn1a-knockdown results above, these findings confirm a significant role of RTN1A in mediating ER stress and worsening of FA-induced renal cell injury at the early stage that contributes to declining renal function and subsequent progression of renal fibrosis.
Figure 8.
RTN1A overexpression in renal tubules exacerbated early renal injury and renal fibrosis in mice with FAN. RTN1A overexpression was induced transiently in renal tubules in Pax8; Rtn1aOE mice by Dox feeding starting 3 weeks before FA injection and ending 7 days after FA injection. Mice were euthanized at either 3 days or 4 weeks after FA injection. (A) Representative images of H&E-stained kidney sections of mice at 3 days postinjection. Original magnification, ×400. (B) Tubular injury scoring of kidneys at 3 days postinjection in FA-treated mice. (C) Representative images of picrosirius red–stained kidney sections of mice at 4 weeks postinjection. Original magnification, ×400. (D) Picrosirius red–positive areas were quantified as the percentage of the sirius red–positive area to total kidney area per field (n=5 mice). (E) Renal function was assessed at 3 days and 4 weeks postinjection by measuring sCr levels. ***P<0.001 compared with vehicle-treated control mice; ###P<0.001 compared with FA-treated WT mice (n=5 in each group).
Figure 9.
RTN1A overexpression in renal tubular cells heightened the early expression of ER stress and apoptosis markers and subsequent expression of renal fibrosis markers in mice with FAN. (A) Real-time PCR analysis of ER stress markers in mouse kidneys at 3 days postinjection. (B) Western blot analyses of markers of ER stress and apoptosis at 3 days postinjection (vehicle-injected WT and Pax8;Rtn1aOE show comparable low levels of CHOP and cleaved caspase-3; therefore, the data are shown with one vehicle control). (C) Densitometric analysis of RTN1A, CHOP, and cleaved caspase-3 in kidney lysates of mice 3 days postinjection. (D) Real-time PCR analysis of fibrosis markers at 4 weeks postinjection. **P<0.01 and ***P<0.001 compared with vehicle-treated control mice; ##P<0.01 and ###P<0.001 compared with FA-injected WT mice (n=5 in each group).
Rtn1a Knockdown in Renal Tubules Attenuates ER Stress and Apoptosis during the Early Stage of Kidney Injury and Subsequent Renal Fibrosis in Mice with AAN
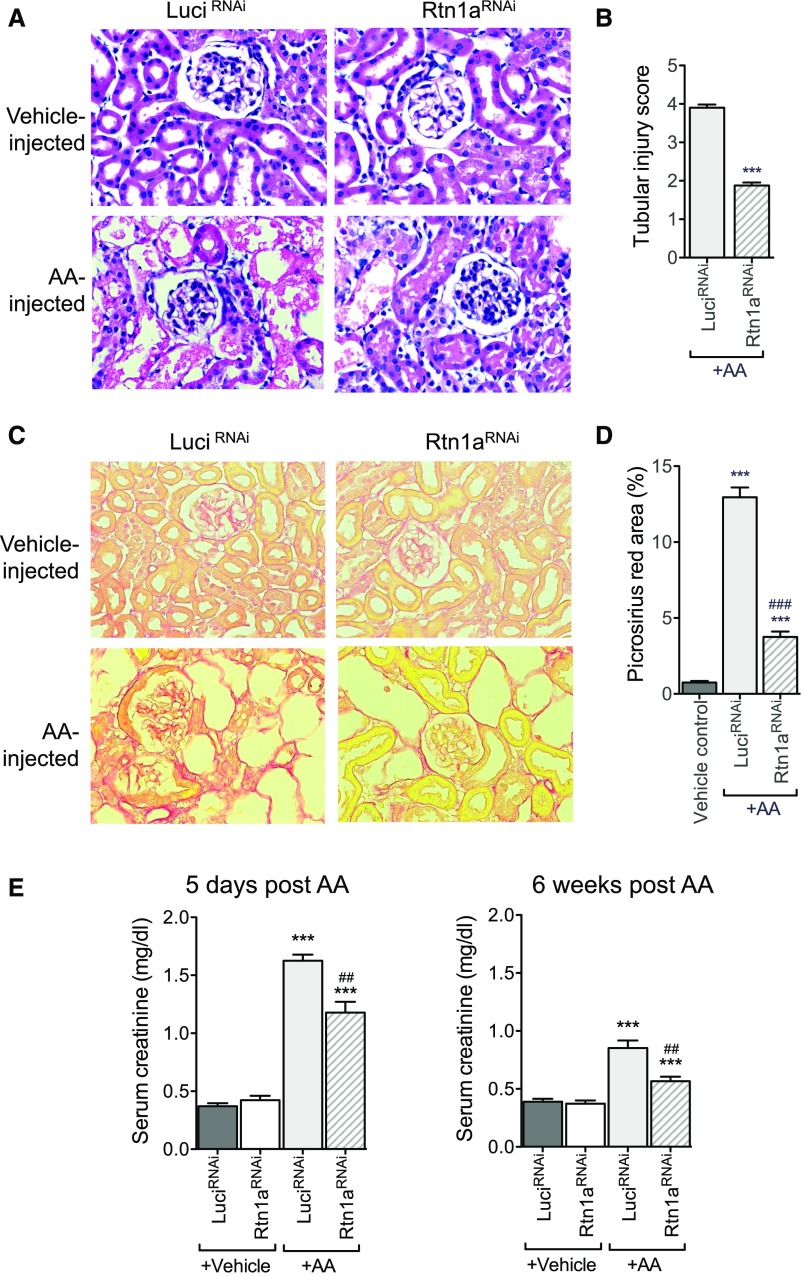
To further validate the role of RTN1A and ER stress in mediating worsening disease progression after AKI, we employed a second model of AKI, AAN. AAN was induced in both Pax8;Rtn1aRNAi and Pax8;LuciRNAi mice as described in the Concise Methods. Mice were euthanized at either 5 days or 6 weeks after injection of AA for examination of both acute and chronic kidney injury. Similar to what we observed in FAN, H&E staining revealed that AA-induced early kidney injury was significantly ameliorated in Pax8;Rtn1aRNAi mice in comparison to Pax8;LuciRNAi mice at 5 days postinjection (Figure 10, A and B). Consistent with these observations, renal fibrosis at 6 weeks post–AA injection was significantly attenuated in Pax8;Rtn1aRNAi mice in comparison to Pax8;LuciRNAi mice, as observed by picrosirius red, Masson trichrome staining, and by collagen I immunostaining (Figure 10, C and D, Supplemental Figure 8). In addition, sCr and BUN analysis showed a significant improvement in kidney function in the Pax8;Rtn1aRNAi mice as compared with Pax8;LuciRNAi mice at both 5 days and 6 weeks after AA administration (Figure 10E, Supplemental Figure 5C).
Figure 10.
Rtn1a knockdown in renal tubular cells attenuated early renal injury and renal fibrosis in mice with AAN. Pax8; Rtn1aRNAi and Pax8; Luci RNAi mice received either AA or vehicle injection after 3 weeks’ Dox feeding and Dox was withdrawn at day 7 after FA injection. All mice were euthanized at either 5 days postinjection for assessing AKI or 6 weeks postinjection for analysis of renal fibrosis (n=5 in each group). (A) Representative images of H&E-stained kidney sections of mice at 5 days postinjection. Original magnification, ×400. (B) Tubular injury scoring of kidneys at 5 days postinjection in AA-treated mice. (C) Representative images of picrosirius red–stained kidney sections of mice at 6 weeks postinjection. Original magnification, ×400. (D) Picrosirius red–positive areas were quantified as the percentage of the sirius red–positive area to total kidney area per field (n=5 mice). (E) Renal function was assessed at 3 days and 4 weeks postinjection by measuring sCr levels. ***P<0.001 compared with vehicle-treated control mice; ###P<0.001 compared with AA-treated LuciRNAi mice (n=5 in each group).
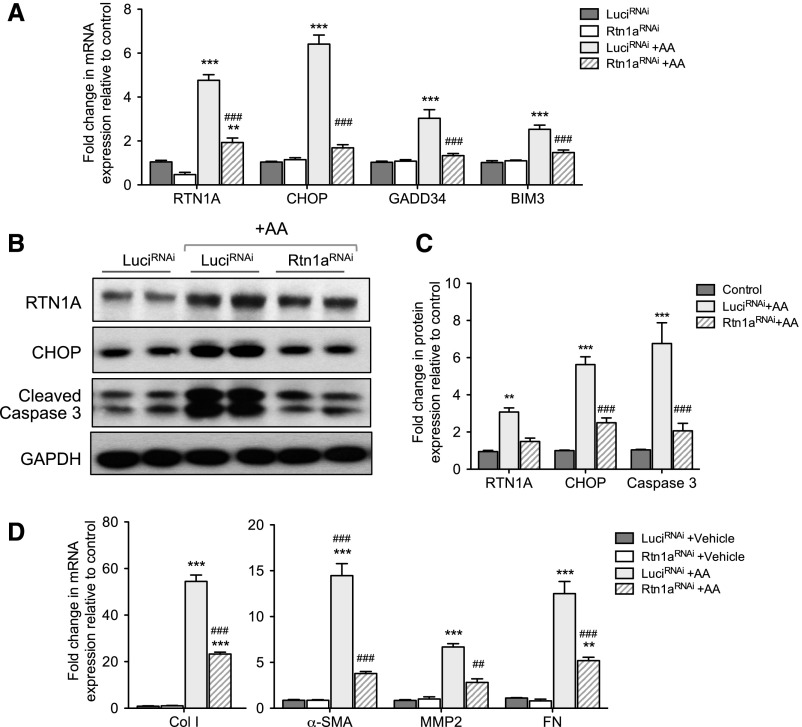
As observed in the above findings in FAN, real-time PCR analysis confirmed that the marked increase in expression levels for RTN1A, ER stress, and apoptosis markers after AA injection was significantly suppressed in Pax8;Rtn1aRNAi in comparison to Pax8;LuciRNAi at day 5 postinjection (Figure 11A). Further, western blot analysis showed that the protein levels of RTN1A, CHOP, and cleaved caspase-3 were also significantly attenuated in Pax8;Rtn1aRNAi at this early stage of injury (Figure 11, B and C). Real-time PCR analysis at 6 weeks postinjection showed that AA induced a marked increase in the expression levels of fibrosis markers in Pax8;LuciRNAi, which were markedly attenuated in Pax8;Rtn1aRNAi (Figure 11D), consistent with the above histologic observations. Together with observations in FAN, these results suggest a critical role of RTN1A in mediating ER stress during the early stage of renal injury that may have significant effects in the eventual renal fibrosis development and declining renal function.
Figure 11.
Rtn1a knockdown in renal tubular cells attenuated the early expression of ER stress and apoptosis markers and subsequent expression of renal fibrosis markers in mice with FAN. (A) Real-time PCR analysis of ER stress markers in mouse kidneys at 5 days postinjection. (B) Western blot analyses of markers of ER stress and apoptosis at 5 days postinjection. (C) Densitometric analysis of RTN1A, CHOP, and cleaved caspase-3 in kidney lysates of mice 5 days postinjection. (D) Real-time PCR analysis of fibrosis markers at 6 weeks postinjection. **P<0.01 and ***P<0.001 compared with vehicle-treated control mice; ##P<0.01 and ###P<0.001 compared with AA-injected LuciRNAi mice (n=5 in each group).
Discussion
In our recent studies, we demonstrated that RTN1A is a key mediator of ER stress in kidney cells: increased expression of RTN1A activated PERK and CHOP, leading to apoptosis and worsened CKD progression, whereas reduced RTN1A in vivo attenuated kidney injury in mice with unilateral ureteral obstruction, diabetic nephropathy, and albumin-overload nephropathy.29,30 In this study we show that RTN1A-mediated augmentation of ER stress response during the early stage of kidney injury may promote sustained ER stress and apoptosis that escalate the extent of kidney injury and impede recovery, leading to renal fibrosis and worsened renal function at the later stage.
It is well known that AKI may resolve or progress to CKD depending on the severity and duration of the injury, but its underlying mechanisms remain obscure. ER stress can elicit both adaptive and nonadaptive responses on the basis of the intensity and duration of exposure to the cellular stress. The role of ER stress has been reported in animal models of AKI.16 However, human studies are limited due to the scarcity of available kidney samples from patients with AKI. In this study, we were able to obtain 51 samples from three major hospitals in Shanghai, China, which is a reasonable sample size in the setting of AKI, given the general difficulty in obtaining biopsy samples in AKI. To our knowledge, this is the first study to (1) demonstrate a clear association of ER stress response with the severity of kidney injury in patients with AKI, and (2) show that specific ER stress marker expression is associated with the worsening disease progression of AKI to CKD. Even with a limited sample size we found that the expression of CHOP is positively associated with the progression of AKI to CKD, whereas the expression of XBP-1s is negatively associated with it. Consistent with this finding, CHOP is known to mediate ER stress–induced apoptosis by targeting proapoptotic genes,37 and several animals studies suggest a critical role of CHOP in mediating ER stress–induced kidney cell injury in AKI.18,21 In contrast, XBP-1s has been shown to mediate the antiapoptotic pathway as part of an adaptive ER stress response.33,38 Notably, we also found that RTN1A expression is also significantly associated with the expression of ER stress markers in these patients. These findings confirm an important role of RTN1A and ER stress in contributing to severe kidney cell injury in patients with AKI that leads to the progression to CKD. Future studies with larger sample size and longer follow-up are required to confirm these observations in patients with AKI.
Because human studies can only indicate an association between RTN1A-mediated ER stress and progression of AKI to CKD, we employed genetic approaches in mouse models of AKI to validate a causative role of RTN1A in augmented ER stress response, resulting in increased severity of early renal injury and leading to subsequent renal fibrosis and declining renal function. We took advantage of inducible tubular cell–specific shRNA knockdown and overexpression mouse models of RTN1A in two different models of AKI (FAN and AAN). Both reduction and overexpression of RTN1A were induced transiently by withdrawal of Dox-supplemented chow at 7 days after the induction of the injury, allowing for restoration of normal levels of RTN1A after the first 7–10 days after the induction of the injury. We found that the transient knockdown of RTN1A was sufficient to attenuate the extent of early kidney injury by reducing ER stress and to mitigate the development of renal fibrosis at the later stages of nephropathy in the mice with FAN or AAN. Conversely, transient overexpression of RTN1A during the first 7–10 days after the injury aggravated ER stress and early kidney cell injury and led to augmented renal fibrosis at the later stage. In addition, we also took a pharmacologic approach to inhibit ER stress in order to determine whether the direct inhibition of ER stress would have a similar effect to suppression of RTN1A. We treated a set of FA-injected control mice with TUDCA for 7 days starting the day after the induction of AKI with FA, which indeed showed a similar extent of renoprotection as observed in the transient RTN1A-knockdown kidneys. Together, these in vivo data not only corroborate the findings by others on the important role of ER stress in AKI, but also suggest that increased ER stress mediated by RTN1A may shift the ER response from adaptive to nonadaptive, thereby augmenting early kidney injury and leading to further disease progression. Therefore, attenuation of RTN1A function and ER stress response during the early stage of kidney injury may ameliorate potential downstream progressive renal fibrosis and decline in renal function. Nevertheless, there are a few limitations in this study. First, in addition to the limited sample size of AKI biopsy samples and the nature of retrospective studies as mentioned above, because the amount of biopsy samples obtained generally do not allow for more quantitative analyses, such as western blotting or real-time PCR, our current analysis of ER stress markers and RTN1A expression is limited to the immunohistochemical approach, which is semiquantitative. Second, although there are multiple causes of AKI, our biopsy samples were obtained mostly from patients with AIN and a small portion from ATN. Therefore, our findings may not be generalizable in all patients with AKI, and future studies are required to confirm whether ER stress is involved in AKI of different causes. However, with regard to mouse models, in addition to what we have shown here the role of ER stress has been clearly demonstrated in multiple models of AKI, including an ischemic-reperfusion model,18 contrast-induced AKI,17 and paracetamol-induced AKI.19 Because our human AKI samples were of AIN due to drug toxicity, we used in parallel two toxin-mediated AKI experimental models in this study. Whether RTN1A is involved in ER stress response in nontoxin-induced AKI models will have to be further validated in future studies, particularly as we cannot rule out the potential lingering toxic effects of FA or AA in kidney injury.
In conclusion, our work demonstrates for the first time a significant association of expression of RTN1A and ER stress markers with the severity of kidney cell injury in patients with AKI at the early stage and in its progression to CKD. Our data in experimental AKI models confirm a causative role of RTN1A and ER stress in mediating kidney cell injury during the early injury stage and in subsequent progression of renal fibrosis at the later stage. Together, these findings suggest that therapeutic targeting of RTN1A and ER stress response may be novel strategies to promote adaptive renal repair and to minimize progressive fibrosis and potential kidney disease progression after acute renal injury.
Concise Methods
AKI Patient Samples
A retrospective study enrolled 51 patients diagnosed with AKI between 2008 and 2015. Patients were recruited from three major hospitals in Shanghai, namely the Sixth People’s Hospital affiliated to Jiaotong University, Xinhua Hospital affiliated to Jiaotong University, and Changhai Hospital affiliated to the Second Military Medical University. The study has been approved by the Ethics Committees of each hospital. Human renal biopsy samples were collected on the basis of clinical indications. Informed consent was obtained from all of these patients according to the guidelines of the local ethics committees. Among them, 42 patients were diagnosed with AIN which was caused mostly by drug toxicity, and nine patients had a diagnosis of ATN. Ten normal kidney sections from normal nephrectomy samples adjacent to tumors were used as controls.
AKI Classification and Staging
The definition of AKI was performed on the basis of the KDIGO AKI classification and staging system.31 Baseline sCr was defined as the lowest value among the following: the sCr value that was measured at a time closest to the admission within the prior 1 year; the minimum sCr value within 3 months before admission; or the minimum sCr value during the hospital stay. Peak sCr was defined as the highest value recorded in up to the first eight hospitalized days after the nadir value. AKI was defined by using an absolute peak-to-nadir sCr difference of 0.3 mg/dl, or ≥50% relative increase in sCr level, or dialysis requirement, as previously described.39,40 Patients who developed AKI were classified into three stages. Stage 1 is defined when sCr rises ≥26 μmol/L within 48 hours, or 50%–99% from baseline within 7 days, or urine output <0.5 ml/kg per hour for >6 hours. Stage 2 is defined when sCr rises 100%–199% from baseline within 7 days, or urine output <0.5 ml/kg per hour for >12 hours. Stage 3 is defined when sCr rises ≥200% from baseline within 7 days, or sCr concentration ≥354 μmol/L with either rise of ≥26 μmol/L within 48 hours or ≥50% rise from baseline within 7 days, or any requirement for renal replacement therapy, or urine output is <0.3 ml/kg per hour for 24 hours, or anuria for 12 hours. AKI patients at stage 3 who progressed from AKI to CKD were defined as follows: sCr doubles or >200 μmol/L that persists at least for >3 months, or requirement for initiation of RRT, or death due to renal diseases.
Histopathologic Diagnosis and Analysis
The renal biopsy specimens were cut at a thickness of 3 μm and examined by light microscopy with hematoxylin and eosin, periodic acid–Schiff, and Masson trichrome staining and immunofluorescence staining. The tubular brush border loss, necrosis and atrophy, interstitial edema, inflammation, and fibrosis were assessed according to the Banff working classification.41 ATN and AIN were defined as previously described.42
Immunohistochemistry
We performed immunostaining on kidney biopsy samples of patients with AKI and normal kidney sections using the following antibodies: RTN1A (ab8957; Abcam), GRP78 (#3177; Cell Signaling), phospho-PERK (sc-3257; Santa Cruz), XBP-1s (#12782; Cell Signaling), and CHOP (ab179823; Abcam). Positive staining was visualized by avidin-biotin-peroxidase complex using the Vectastain ABC elite kit (Vector Laboratories) according to the manufacturer’s instructions. The staining of glomerulus and tubulointerstitium was scored separately on a scale of 0–4 by two independent investigators in a blinded manner (score 0: absence of specific staining; score 1: <25% area has specific staining for RTN1A; score 2: 25%–50%; score 3: 50%–75%; score 4: >75%).
Generation of Tubular Cell–Specific RTN1A-Knockdown Mice
We developed a Dox-inducible RNAi model for RTN1, as previously described.29 To obtain renal tubular epithelial cell–specific Rtn1a-knockdown mice, we crossed the Pax8-rtTA mice with TRE-Rtn1aRNAi mice. Mice were fed with 625 mg/kg Dox-supplemented chow (Bio-Serv, Frenchtown, NJ) to induce RTN1A knockdown. Mice expressing Pax8-rtTA and shRNA against luciferase, TRE-LuciRNAi, were used as controls.
Generation of RTN1A-Overexpression Transgenic Mice
Human RTN1 cDNA corresponding to NM_021136.2 was purchased from GeneCopoeia Inc. A fusion C-terminal 6xHis-tagged RTN1A was generated by PCR and subcloned into the pGEM-T Easy plasmid (Promega Life Sciences). The RTN1A fusion construct was then subcloned into the pTRE-TIGHT acceptor vector (Clontech Laboratories, Inc.). The expression vector was then further modified to express enhanced green fluorescent protein (EGFP) bicistronically, and named pTRE-Tight-hRTN1A-HIS6-IRES-EGFP. The sequence and orientation of the RTN1A-HIS6 insert were confirmed by restriction endonuclease and DNA sequencing. Dox-inducible expression of RTN1A-HIS6 was confirmed in the Tet-ON U2OS cell line. The 4.2 kb Scal-Drdl DNA fragment of pTRE-Tight-hRTN1A-HIS6-IRES-EGFP was used for microinjection to generate the TRE-hRTN1AOE transgenic mice in FVB/N background. These mice were crossed with Pax8-rtTA to generate tubular epithelial cell–specific overexpression of RTN1A. RTN1A overexpression was validated by real-time PCR and western blot analysis of kidney cortices from these mice.
FAN Mouse Model
For RTN1A-knockdown or -overexpression mice, 9-week-old male mice (n=5 in each group) were injected with 250 mg/kg folic acid (Sigma-Aldrich) or equivalent volumes of vehicle intraperitoneally 3 weeks after Dox feeding commenced. Dox foods were withdrawn at day 7 postinjection for a transient knockdown or overexpression of RTN1A at the early stage of kidney injury. In addition, FA-injected WT mice received TUDCA or vehicle at 250 mg/kg per day starting at day 1 post–FA injection and ending by day 7 post–FA injection. Mice were euthanized at two time points—3 days for assessing AKI and 4 weeks for renal fibrosis.
AAN Mouse Model
After 3 weeks of Dox feeding, AAN was induced in 9-week-old male Pax8;Rtn1RNAi mice and Pax8;LuciRNAi mice by intraperitoneal injection with aristolochic acid I (Sigma-Aldrich) at 3 mg/kg for 5 days, followed by injections every other day for 3 weeks, and they were allowed to recover for 3 weeks. Dox was withdrawn at 7 days post–AA injection. The mice were euthanized either at day 5 post–AA injection for assessing early kidney injury or at 6 weeks post–AA injection for assessing renal fibrosis after a period of remodeling. The control mice were injected with PBS vehicle.
Measurement of BUN and sCr
BUN was measured from mouse sera using a commercially available kit (BioAssay Systems), according to manufacturer’s protocol. Mouse sCr measurements were performed by the Bioanalytical Core at The O’Brien Kidney Center at the University of Alabama at Birmingham by LC–mass spectrometry method.
Real-Time PCR
Primers for real-time PCR (Supplemental Table 4) were designed by using the National Center for Biotechnology Information Primer BLAST tool. PCR was performed using SYBR Green Master Mix (Applied Biosystems) and the Applied Biosystems 7500 Real-Time PCR system. Gene expression was normalized to housekeeping gene GAPDH and fold change in expression relative to the control group was calculated using the 2−ΔΔCt method.
Western Blot Analysis
Tissues were lysed with buffer containing 1% NP40 with a protease and phosphatase inhibitor cocktail. The specific antibodies described below were used for immunoblot analysis: mouse RTN1A (Abcam), CHOP (Cell Signaling Technology), cleaved caspase-3 (Cell Signaling Technology), and GAPDH (Cell Signaling Technology). Western blots were imaged and band intensities were quantified using the Odyssey Fc Imaging System (LI-COR Biosciences).
Picrosirius Red and Masson Trichrome Staining
Renal fibrosis was evaluated histologically by picosirius red staining on paraffin slides of mouse kidney tissues according to the manufacturer’s instructions (#ab150681; Abcam). Masson trichrome staining on paraffin slices of mouse kidney tissue was performed according to manufacturer’s instructions (#87019; Thermo Scientific). Picrosirius red–stained slides were analyzed using methods previously described using Image J.43
Mouse Kidney Tubular Injury Scoring
Tubular injury was scored semiquantitatively in a blinded manner of at least 20 cortical fields (original magnification, ×20) of PAS-stained mouse kidneys. Tubular injury was defined as tubular dilation, tubular atrophy, sloughing of tubular epithelial cells, or thickening of the tubular basement membrane. Score 0: no tubular injury; score 1, <10% of tubules injured; score 2, 10%–25% of tubules injured; score 3, 26%–50% of tubules injured; score 4, 51%–75% of tubules injured; score 5, >75% tubules injured.
Statistical Analyses
Data are expressed as mean±SEM (X±SEM). The two-sided unpaired t test was used to analyze data between two groups after determination of data distributions and variance. The ANOVA with Bonferroni correction was used when more than two groups were present. To determine the association of clinical factors with AKI classification and renal outcome of patients with AKI, we used univariate logistic regression analysis followed by multivariate logistic regression with stepwise backward inclusion of variables to minimize the number of covariates in the model. GraphPad Prism software, version 6.0 was used for statistical analyses. P values were two sided, and P<0.05 was considered statistically significant.
Disclosures
None.
Supplementary Material
Acknowledgments
J.C.H. is supported by National Institutes of Health (NIH) 1R01DK109683, NIH 1R01DK078897, NIH 1R01DK088541, and NIH P01-DK-56492. N.W. is supported by the National Natural Science Foundation of China (81270824, 81670657) and Translational Medicine Funding of Shanghai Jiao Tong University (152H2011). Y.F. is supported by the National Natural Science Foundation of China (81400735) and Chinese Medical Association Funding (15020140602). K.L. is supported by NIH P30 DK079307.
J.C.H. and N.W. designed the study; Y.F., W.X., J.W., L.H., J.Z., and Y.F. conducted the experiments; D.C., H.B., and Y.L. collected the clinical data; F.L., G.J., and Z.G. contributed material; Y.F., W.X., K.L., F.S., and J.C.H. analyzed the data; and Y.F., W.Z., K.L., and J.C.H. wrote the manuscript.
Footnotes
Published online ahead of print. Publication date available at www.jasn.org.
This article contains supplemental material online at http://jasn.asnjournals.org/lookup/suppl/doi:10.1681/ASN.2016091001/-/DCSupplemental.
References
- 1.Chawla LS, Kimmel PL: Acute kidney injury and chronic kidney disease: An integrated clinical syndrome. Kidney Int 82: 516–524, 2012 [DOI] [PubMed] [Google Scholar]
- 2.Schmitt R, Coca S, Kanbay M, Tinetti ME, Cantley LG, Parikh CR: Recovery of kidney function after acute kidney injury in the elderly: A systematic review and meta-analysis. Am J Kidney Dis 52: 262–271, 2008 [DOI] [PubMed] [Google Scholar]
- 3.Coca SG, Singanamala S, Parikh CR: Chronic kidney disease after acute kidney injury: A systematic review and meta-analysis. Kidney Int 81: 442–448, 2012 [DOI] [PMC free article] [PubMed] [Google Scholar]
- 4.Ishani A, Xue JL, Himmelfarb J, Eggers PW, Kimmel PL, Molitoris BA, Collins AJ: Acute kidney injury increases risk of ESRD among elderly. J Am Soc Nephrol 20: 223–228, 2009 [DOI] [PMC free article] [PubMed] [Google Scholar]
- 5.Belayev LY, Palevsky PM: The link between acute kidney injury and chronic kidney disease. Curr Opin Nephrol Hypertens 23: 149–154, 2014 [DOI] [PMC free article] [PubMed] [Google Scholar]
- 6.Yang, L, Besschetnova, TY, Brooks, CR, Shah, JV, Bonventre, JV: Epithelial cell cycle arrest in G2/M mediates kidney fibrosis after injury. Nat Med 16: 535–543, 531p following 143, 2010. [DOI] [PMC free article] [PubMed]
- 7.Grgic I, Campanholle G, Bijol V, Wang C, Sabbisetti VS, Ichimura T, Humphreys BD, Bonventre JV: Targeted proximal tubule injury triggers interstitial fibrosis and glomerulosclerosis. Kidney Int 82: 172–183, 2012 [DOI] [PMC free article] [PubMed] [Google Scholar]
- 8.Ferenbach DA, Bonventre JV: Mechanisms of maladaptive repair after AKI leading to accelerated kidney ageing and CKD. Nat Rev Nephrol 11: 264–276, 2015 [DOI] [PMC free article] [PubMed] [Google Scholar]
- 9.Liu G, Sun Y, Li Z, Song T, Wang H, Zhang Y, Ge Z: Apoptosis induced by endoplasmic reticulum stress involved in diabetic kidney disease. Biochem Biophys Res Commun 370: 651–656, 2008 [DOI] [PubMed] [Google Scholar]
- 10.Wu X, He Y, Jing Y, Li K, Zhang J: Albumin overload induces apoptosis in renal tubular epithelial cells through a CHOP-dependent pathway. OMICS 14: 61–73, 2010 [DOI] [PubMed] [Google Scholar]
- 11.Wu J, Zhang R, Torreggiani M, Ting A, Xiong H, Striker GE, Vlassara H, Zheng F: Induction of diabetes in aged C57B6 mice results in severe nephropathy: An association with oxidative stress, endoplasmic reticulum stress, and inflammation. Am J Pathol 176: 2163–2176, 2010 [DOI] [PMC free article] [PubMed] [Google Scholar]
- 12.Inagi R, Nangaku M, Onogi H, Ueyama H, Kitao Y, Nakazato K, Ogawa S, Kurokawa K, Couser WG, Miyata T: Involvement of endoplasmic reticulum (ER) stress in podocyte injury induced by excessive protein accumulation. Kidney Int 68: 2639–2650, 2005 [DOI] [PubMed] [Google Scholar]
- 13.Cybulsky AV: Endoplasmic reticulum stress in proteinuric kidney disease. Kidney Int 77: 187–193, 2010 [DOI] [PubMed] [Google Scholar]
- 14.Lee EK, Jeong JU, Chang JW, Yang WS, Kim SB, Park SK, Park JS, Lee SK: Activation of AMP-activated protein kinase inhibits albumin-induced endoplasmic reticulum stress and apoptosis through inhibition of reactive oxygen species. Nephron Exp Nephrol 121: e38–e48, 2012 [DOI] [PubMed] [Google Scholar]
- 15.Lindenmeyer MT, Rastaldi MP, Ikehata M, Neusser MA, Kretzler M, Cohen CD, Schlöndorff D: Proteinuria and hyperglycemia induce endoplasmic reticulum stress. J Am Soc Nephrol 19: 2225–2236, 2008 [DOI] [PMC free article] [PubMed] [Google Scholar]
- 16.Linkermann A, Chen G, Dong G, Kunzendorf U, Krautwald S, Dong Z: Regulated cell death in AKI. J Am Soc Nephrol 25: 2689–2701, 2014 [DOI] [PMC free article] [PubMed] [Google Scholar]
- 17.Yang Y, Yang D, Yang D, Jia R, Ding G: Role of reactive oxygen species-mediated endoplasmic reticulum stress in contrast-induced renal tubular cell apoptosis. Nephron Exp Nephrol 128: 30–36, 2014 [DOI] [PubMed] [Google Scholar]
- 18.Yang JR, Yao FH, Zhang JG, Ji ZY, Li KL, Zhan J, Tong YN, Lin LR, He YN: Ischemia-reperfusion induces renal tubule pyroptosis via the CHOP-caspase-11 pathway. Am J Physiol Renal Physiol 306: F75–F84, 2014 [DOI] [PubMed] [Google Scholar]
- 19.Lorz C, Justo P, Sanz A, Subirá D, Egido J, Ortiz A: Paracetamol-induced renal tubular injury: A role for ER stress. J Am Soc Nephrol 15: 380–389, 2004 [DOI] [PubMed] [Google Scholar]
- 20.Mami I, Bouvier N, El Karoui K, Gallazzini M, Rabant M, Laurent-Puig P, Li S, Tharaux PL, Beaune P, Thervet E, Chevet E, Hu GF, Pallet N: Angiogenin mediates cell-autonomous translational control under endoplasmic reticulum stress and attenuates kidney injury. J Am Soc Nephrol 27: 863–876, 2016 [DOI] [PMC free article] [PubMed] [Google Scholar]
- 21.Noh MR, Kim JI, Han SJ, Lee TJ, Park KM: C/EBP homologous protein (CHOP) gene deficiency attenuates renal ischemia/reperfusion injury in mice. Biochim Biophys Acta 1852: 1895–1901, 2015 [DOI] [PubMed] [Google Scholar]
- 22.Carlisle RE, Brimble E, Werner KE, Cruz GL, Ask K, Ingram AJ, Dickhout JG: 4-Phenylbutyrate inhibits tunicamycin-induced acute kidney injury via CHOP/GADD153 repression. PLoS One 9: e84663, 2014 [DOI] [PMC free article] [PubMed] [Google Scholar]
- 23.Masliah E, Xie F, Dayan S, Rockenstein E, Mante M, Adame A, Patrick CM, Chan AF, Zheng B: Genetic deletion of Nogo/Rtn4 ameliorates behavioral and neuropathological outcomes in amyloid precursor protein transgenic mice. Neuroscience 169: 488–494, 2010 [DOI] [PMC free article] [PubMed] [Google Scholar]
- 24.Heath JE, Siedlak SL, Zhu X, Lee HG, Thakur A, Yan R, Perry G, Smith MA, Castellani RJ: Widespread distribution of reticulon-3 in various neurodegenerative diseases. Neuropathology 30: 574–579, 2010 [DOI] [PMC free article] [PubMed] [Google Scholar]
- 25.Abdesselem H, Shypitsyna A, Solis GP, Bodrikov V, Stuermer CA: No Nogo66- and NgR-mediated inhibition of regenerating axons in the zebrafish optic nerve. J Neurosci 29: 15489–15498, 2009 [DOI] [PMC free article] [PubMed] [Google Scholar]
- 26.Xiang R, Zhao S: RTN3 inducing apoptosis is modulated by an adhesion protein CRELD1. Mol Cell Biochem 331: 225–230, 2009 [DOI] [PubMed] [Google Scholar]
- 27.Liu Y, Vidensky S, Ruggiero AM, Maier S, Sitte HH, Rothstein JD: Reticulon RTN2B regulates trafficking and function of neuronal glutamate transporter EAAC1. J Biol Chem 283: 6561–6571, 2008 [DOI] [PMC free article] [PubMed] [Google Scholar]
- 28.GrandPré T, Nakamura F, Vartanian T, Strittmatter SM: Identification of the Nogo inhibitor of axon regeneration as a Reticulon protein. Nature 403: 439–444, 2000 [DOI] [PubMed] [Google Scholar]
- 29.Fan Y, Xiao W, Li Z, Li X, Chuang PY, Jim B, Zhang W, Wei C, Wang N, Jia W, Xiong H, Lee K, He JC: RTN1 mediates progression of kidney disease by inducing ER stress. Nat Commun 6: 7841, 2015 [DOI] [PMC free article] [PubMed] [Google Scholar]
- 30.Xiao W, Fan Y, Wang N, Chuang PY, Lee K, He JC: Knockdown of RTN1A attenuates ER stress and kidney injury in albumin overload-induced nephropathy. Am J Physiol Renal Physiol 310: F409–F415, 2016 [DOI] [PMC free article] [PubMed] [Google Scholar]
- 31.Section 2: AKI definition. Kidney Int Suppl (2011) 2: 19–36, 2012. [DOI] [PMC free article] [PubMed] [Google Scholar]
- 32.Oakes SA, Papa FR: The role of endoplasmic reticulum stress in human pathology. Annu Rev Pathol 10: 173–194, 2015 [DOI] [PMC free article] [PubMed] [Google Scholar]
- 33.Hetz C: The unfolded protein response: Controlling cell fate decisions under ER stress and beyond. Nat Rev Mol Cell Biol 13: 89–102, 2012 [DOI] [PubMed] [Google Scholar]
- 34.Oyadomari S, Mori M: Roles of CHOP/GADD153 in endoplasmic reticulum stress. Cell Death Differ 11: 381–389, 2004 [DOI] [PubMed] [Google Scholar]
- 35.Yoshida H: Unconventional splicing of XBP-1 mRNA in the unfolded protein response. Antioxid Redox Signal 9: 2323–2333, 2007 [DOI] [PubMed] [Google Scholar]
- 36.Chiang CK, Hsu SP, Wu CT, Huang JW, Cheng HT, Chang YW, Hung KY, Wu KD, Liu SH: Endoplasmic reticulum stress implicated in the development of renal fibrosis. Mol Med 17: 1295–1305, 2011 [DOI] [PMC free article] [PubMed] [Google Scholar]
- 37.Taniguchi M, Yoshida H: Endoplasmic reticulum stress in kidney function and disease. Curr Opin Nephrol Hypertens 24: 345–350, 2015 [DOI] [PubMed] [Google Scholar]
- 38.Takatani T, Shirakawa J, Roe MW, Leech CA, Maier BF, Mirmira RG, Kulkarni RN: IRS1 deficiency protects β-cells against ER stress-induced apoptosis by modulating sXBP-1 stability and protein translation. Sci Rep 6: 28177, 2016 [DOI] [PMC free article] [PubMed] [Google Scholar]
- 39.Broce JC, Price LL, Liangos O, Uhlig K, Jaber BL: Hospital-acquired acute kidney injury: An analysis of nadir-to-peak serum creatinine increments stratified by baseline estimated GFR. Clin J Am Soc Nephrol 6: 1556–1565, 2011 [DOI] [PMC free article] [PubMed] [Google Scholar]
- 40.Koulouridis I, Price LL, Madias NE, Jaber BL: Hospital-acquired acute kidney injury and hospital readmission: A cohort study. Am J Kidney Dis 65: 275–282, 2015 [DOI] [PMC free article] [PubMed] [Google Scholar]
- 41.Racusen LC, Solez K, Colvin RB, Bonsib SM, Castro MC, Cavallo T, Croker BP, Demetris AJ, Drachenberg CB, Fogo AB, Furness P, Gaber LW, Gibson IW, Glotz D, Goldberg JC, Grande J, Halloran PF, Hansen HE, Hartley B, Hayry PJ, Hill CM, Hoffman EO, Hunsicker LG, Lindblad AS, Marcussen N, Mihatsch MJ, Nadasdy T, Nickerson P, Olsen TS, Papadimitriou JC, Randhawa PS, Rayner DC, Roberts I, Rose S, Rush D, Salinas-Madrigal L, Salomon DR, Sund S, Taskinen E, Trpkov K, Yamaguchi Y: The Banff 97 working classification of renal allograft pathology. Kidney Int 55: 713–723, 1999 [DOI] [PubMed] [Google Scholar]
- 42.Chu R, Li C, Wang S, Zou W, Liu G, Yang L: Assessment of KDIGO definitions in patients with histopathologic evidence of acute renal disease. Clin J Am Soc Nephrol 9: 1175–1182, 2014 [DOI] [PMC free article] [PubMed] [Google Scholar]
- 43.Grimm PC, Nickerson P, Gough J, McKenna R, Stern E, Jeffery J, Rush DN: Computerized image analysis of Sirius Red-stained renal allograft biopsies as a surrogate marker to predict long-term allograft function. J Am Soc Nephrol 14: 1662–1668, 2003 [DOI] [PubMed] [Google Scholar]
Associated Data
This section collects any data citations, data availability statements, or supplementary materials included in this article.


