Abstract
Histologic analysis of the allograft biopsy specimen is the standard method used to differentiate rejection from other injury in kidney transplants. Donor-derived cell-free DNA (dd-cfDNA) is a noninvasive test of allograft injury that may enable more frequent, quantitative, and safer assessment of allograft rejection and injury status. To investigate this possibility, we prospectively collected blood specimens at scheduled intervals and at the time of clinically indicated biopsies. In 102 kidney recipients, we measured plasma levels of dd-cfDNA and correlated the levels with allograft rejection status ascertained by histology in 107 biopsy specimens. The dd-cfDNA level discriminated between biopsy specimens showing any rejection (T cell–mediated rejection or antibody-mediated rejection [ABMR]) and controls (no rejection histologically), P<0.001 (receiver operating characteristic area under the curve [AUC], 0.74; 95% confidence interval [95% CI], 0.61 to 0.86). Positive and negative predictive values for active rejection at a cutoff of 1.0% dd-cfDNA were 61% and 84%, respectively. The AUC for discriminating ABMR from samples without ABMR was 0.87 (95% CI, 0.75 to 0.97). Positive and negative predictive values for ABMR at a cutoff of 1.0% dd-cfDNA were 44% and 96%, respectively. Median dd-cfDNA was 2.9% (ABMR), 1.2% (T cell–mediated types ≥IB), 0.2% (T cell–mediated type IA), and 0.3% in controls (P=0.05 for T cell–mediated rejection types ≥IB versus controls). Thus, dd-cfDNA may be used to assess allograft rejection and injury; dd-cfDNA levels <1% reflect the absence of active rejection (T cell–mediated type ≥IB or ABMR) and levels >1% indicate a probability of active rejection.
Keywords: cell-free DNA, kidney, transplant, rejection, biomarker, DART
Accurate and timely detection of allograft rejection and effective treatment are essential for long-term survival of renal transplants. Although histology obtained via needle biopsy remains the standard for diagnosis of rejection, this technique is infrequently used for surveillance because of the cost, logistics, potential complications, and patient discomfort and inconvenience. Donor-derived cell-free DNA (dd-cfDNA) detected in the blood of transplant recipients has been proposed as a noninvasive marker for diagnosis of graft rejection.1–3 The premise for quantitative interpretation of this biomarker is that rejection entails injury, including increased cell death in the allograft, leading to increased dd-cfDNA released into the bloodstream.
Data from several single-center studies suggest that dd-cfDNA levels in blood, measured as a fraction of the total cell-free DNA (cfDNA), can discriminate rejection from nonrejection in heart, lung, liver, and kidney allografts. In stable heart transplant recipients, the fraction of cfDNA originating from the graft is nearly always <1%,4–6 whereas during rejection the levels of dd-cfDNA are significantly higher.5,7 In stable lung and liver transplant recipients, the level of dd-cfDNA is higher than in stable heart transplant recipients, and it further increases in moderate-to-severe rejection.8,9 Up to now, dd-cfDNA has been least studied in renal transplants; levels in stable kidney recipients are similar to those in heart transplant recipients,4,10 and analyses of individual patients and a small single-center study identified higher levels during biopsy-proven acute rejection.11
In kidney transplantation, there are no existing biomarkers that adequately measure the status of active injury to the allograft. Serum creatinine allows estimation of the GFR, but it is not specific or sensitive for allograft injury, and may not distinguish acute from chronic loss of function.12,13
This report from the Circulating Donor-Derived Cell-Free DNA in Blood for Diagnosing Acute Rejection in Kidney Transplant Recipients (DART) study (ClinicalTrials.gov Identifier: NCT02424227) validates that plasma levels of dd-cfDNA can discriminate active rejection status. The DART study is the first multicenter study of renal allograft recipients using an analytically validated dd-cfDNA test7 that employs targeted amplification and sequencing of single-nucleotide polymorphisms to quantify donor and recipient DNA contributions, without the need for prior genotyping of donor or recipient DNA (AlloSure).
Results
Patients, Biopsies, and Blood Samples
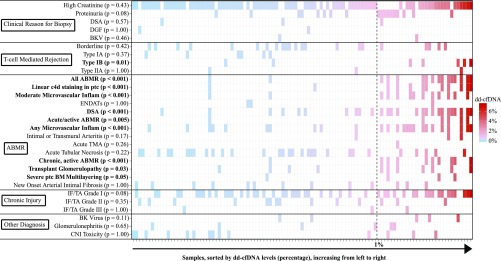
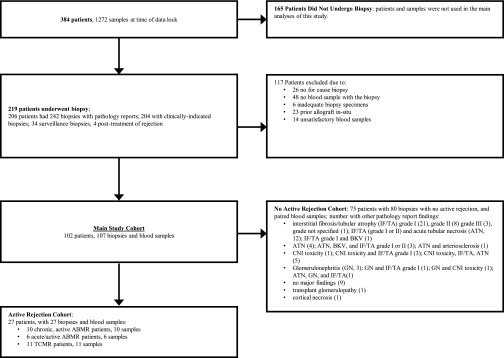
From April of 2015 until May of 2016, 384 renal transplant patients were enrolled (245 within 1–3 months of their kidney transplantation and 139 at the time of a clinically indicated renal biopsy) from 14 clinical sites. Figures 1 and 2 show the pathologists’ diagnostic findings for the 107 clinically indicated biopsies that had matched plasma dd-cfDNA results. This subset provides the core dataset used for the analyses of dd-cfDNA to discriminate rejection from no rejection status (using the biopsy-based pathologists’ reports as the diagnostic standard).
Figure 1.
Banff elementary lesions and clinical features correlate with dd-cfDNA level. The 107 samples (27 patients with 27 samples with active rejection; 75 patients with 80 samples with no active rejection) are rank-ordered and color-coded by dd-cfDNA level. White indicates the element was not associated with that biopsy/visit. For each sample (x axis), associated elements (y axis) are shown as a colored box, by the level of dd-cfDNA associated with the sample; highest dd-cfDNA in red, lowest in blue, with a vertical dashed line at the 1% cutoff. The significance (P value) of association of dd-cfDNA >1% with each element is shown. BM, (glomerular) basement membrane; CNI, calcineurin inhibitor; DGF, delayed graft function; ENDATs, (gene expression profiles of) endothelial activation (and injury) transcripts; Inflam, inflammation; ptc, peritubular capillary.
Figure 2.
Patients, blood samples, and biopsies used in this study.
The patient characteristics of the study cohort are shown in Table 1. The DART study population was representative of the United States renal transplant registry population (Supplemental Table 1). The active rejection subgroup contained a higher proportion of black and deceased donor organ recipients than the group without active rejection and the overall DART population. Patients with active rejection were also significantly younger than patients with no rejection.
Table 1.
Patient characteristics
| Clinical Characteristic | Active Rejection Group | No Active Rejection Group | P Valuea |
|---|---|---|---|
| Number of patients | 27 | 75 | |
| Number of samples | 27 | 80 | |
| Race, n (%) | 0.23 | ||
| Black | 13 (48) | 23 (31) | |
| White | 13 (48) | 41 (55) | |
| Native Hawaiian or Other Pacific Islander | 1 (4) | 0 (0) | |
| Hispanic/Latino | 0 (0) | 4 (5) | |
| Asian | 0 (0) | 1 (1) | |
| Other | 0 (0) | 6 (8) | |
| Men, n (%) | 16 (59) | 45 (60) | >0.99 |
| Age at enrollment, y | 46±16 | 53±13 | 0.04 |
| Post-transplant, d | 968±1107 | 1189±1482 | 0.42 |
| CMV serologic status, n (%) | 0.15 | ||
| D−/R+ | 4 (15) | 13 (17) | |
| D+/R+ | 5 (19) | 24 (32) | |
| D−/R− | 3 (11) | 16 (21) | |
| D+/R− | 4 (15) | 9 (12) | |
| Unknown | 11 (41) | 13 (17) | |
| Donor type, n (%) | 0.03 | ||
| Deceased donor | 20 (74) | 42 (56) | |
| Living unrelated | 2 (7) | 24 (32) | |
| Living related | 5 (19) | 9 (12) | |
| Child | 2 (7) | 3 (4) | |
| Sibling | 2 (7) | 4 (5) | |
| Parent | 0 (0) | 1 (1) | |
| Half-sibling | 0 (0) | 0 (0) | |
| Other biologic blood relation | 1 (4) | 1 (1) | |
| Creatinine | 2.5±1.0 | 2.4±1.4 | 0.69 |
| eGFR | 32±12 | 36±21 | 0.21 |
| HLA class 1 no. of mismatches (A, B) | 2.7±1.4 | 2.6±1.4 | 0.59 |
| HLA class 2 no. of mismatches (DR) | 1.2±0.6 | 1.1±0.8 | 0.67 |
| Weight, kg | 85±19 | 84±21 | 0.73 |
| Height, cm | 170±10 | 171±8 | 0.58 |
Data ranges are presented as mean±standard deviation. CMV, cytomegalovirus.
The P values are the level of statistical significance in the differences of values found in the DART active rejection group and the no active rejection group. For continuous covariates, Wilcoxon rank sum test was used to generate the P values. For categoric covariates, Fisher exact test was used to generate the P values.
At the time of data lock, 219 patients had at least one renal biopsy; 242 biopsies had sufficient specimens and associated pathologists’ reported results (Figure 2). The majority of biopsies (204 of 242) were performed for clinical suspicion of rejection, 34 for surveillance, and four for follow-up of treated rejection. Only one of 34 (3%) surveillance biopsies revealed rejection (Supplemental Table 2). Therefore, we did not calculate the performance characteristics for dd-cfDNA to discriminate active rejection in the scenario of no clinical indication for biopsy.
Our primary analyses in this study combined three subclasses of rejection (T cell–mediated rejection [TCMR], “acute/active” antibody-mediated rejection [ABMR], and “chronic, active” ABMR) defined by the Banff working groups14,15 because they share some common histologic criteria and the related cell injury manifestations have potential to involve active cell injury and death,16 and therefore result in increased levels of dd-cfDNA (Supplemental Figure 1). We use the term active rejection to describe these rejection subclasses and distinguish them from all other biopsy-based diagnoses not phenotypically associated with active rejection (details in Concise Methods).
A diagnosis of active rejection was confirmed in review of 59 pathologists’ biopsy reports: 58 cases of active rejection in 204 biopsies, performed for clinical suspicion, most commonly an elevation in serum creatinine, and one case of active rejection in 34 surveillance biopsies. The types of active rejection are summarized in Supplemental Table 2.
dd-cfDNA Levels in Blood Plasma
To define the area under the curve–receiver operating characteristic (AUC-ROC) performance of dd-cfDNA, we included all dd-cfDNA results that were collected at the same time that a clinically indicated biopsy was performed. There were 27 biopsy specimens from 27 patients with, and 80 biopsy specimens from 75 patients without, active rejection. A correlation matrix of Banff elementary lesions and clinical features for the 107 samples are rank-ordered and color-coded by dd-cfDNA level in Figure 1. Samples with >1% dd-cfDNA occurred significantly more often (P<0.01) in the following types of rejection and subelements: acute/active ABMR; chronic, active ABMR; any or moderate microvascular inflammation; linear C4d staining in peritubular capillaries; and presence of donor-specific antibody. The dd-cfDNA threshold of 1% also discriminated type IB TCMR (P=0.01) and transplant glomerulopathy (P=0.03). We computed the AUC-ROC performance of serum creatinine on this set. For estimating the positive predictive value (PPV) and negative predictive value (NPV) of dd-cfDNA to predict active rejection versus no active rejection, we used the prevalence of 58 active rejections in the 170 patients with 204 biopsy reports available from clinically indicated biopsies (Figure 2).
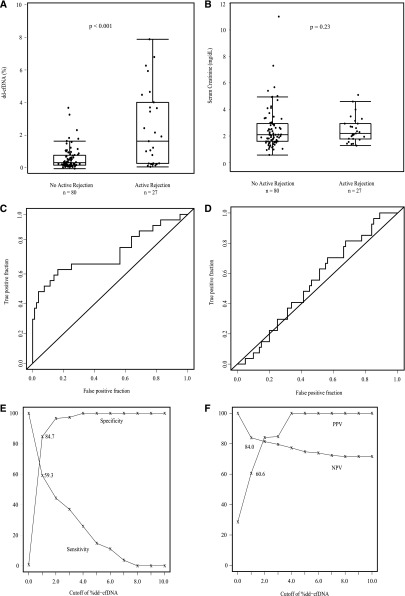
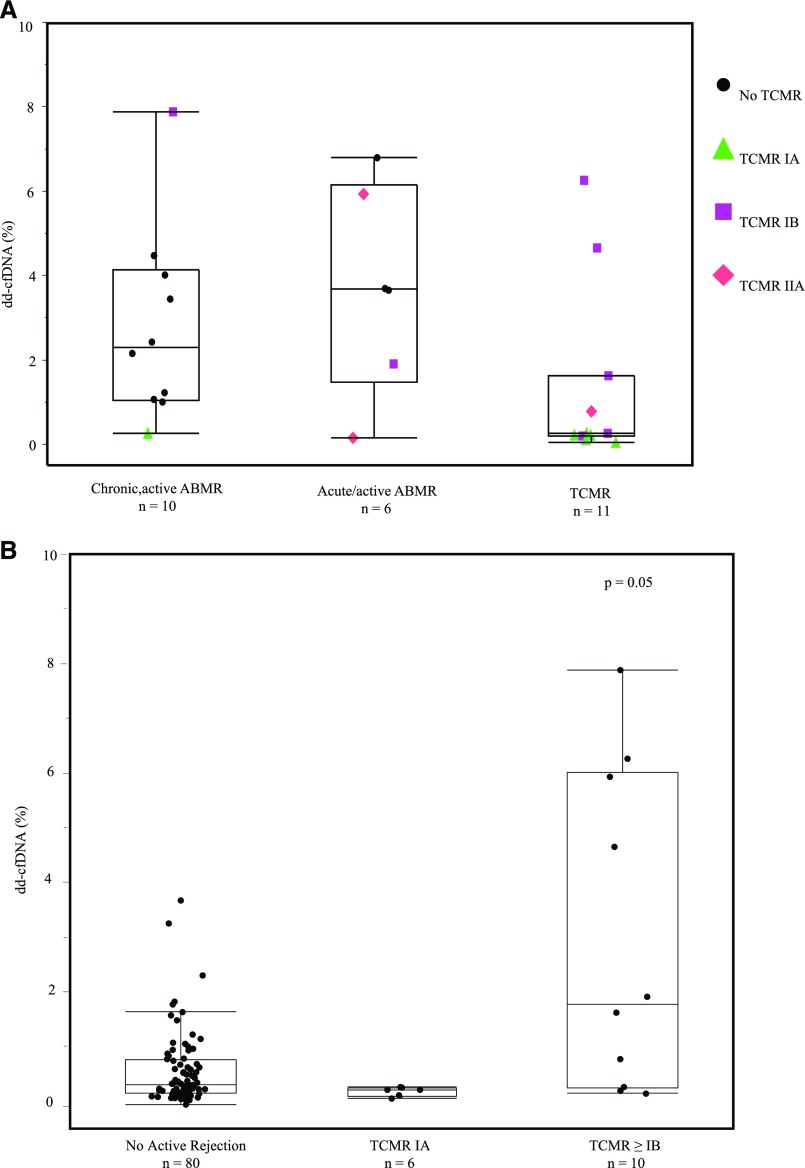
The fraction of dd-cfDNA in blood plasma differed significantly between the groups (Figure 3A). The median level of dd-cfDNA in patients with active rejection was significantly higher (1.6%) than in the comparator group (0.3%) of biopsy specimens without active rejection (P<0.001). Median dd-cfDNA levels varied by type of active rejection: 2.9% (ABMR), 1.2% (TCMR only, types IB and IIA), 0.2% (TCMR only type IA). Because of small numbers, comparison of TCMR types included the cases of mixed TCMR and ABMR. Figure 4B shows the data for TCMR ≥types IB (P=0.05 versus no active rejection) and TCMR type IA.
Figure 3.
dd-cfDNA discriminates active rejection. (A) Fraction of dd-cfDNA in active rejection (n=27) versus no active rejection (n=80). Box and whisker plots; horizontal line represents the median; bottom and top of each box represents 25th and 75th percentiles. Dots are individual results. Median dd-cfDNA in active rejection 1.6% versus 0.3% for no rejection (P<0.001). (B) Serum creatinine (milligrams per deciliter) in active rejection (n=27) versus no active rejection (n=80). Box and whisker plots; horizontal line represents the median; bottom and top of each box represents 25th and 75th percentiles. Dots are individual results. Serum creatinine was not significantly different in median values between two groups (P=0.23). (C) ROC curve for dd-cfDNA to discriminate active rejection. AUC=0.74 (95% CI, 0.61 to 0.86). (D) ROC curve for serum creatinine to discriminate active rejection. AUC=0.54 (95% CI, 0.43 to 0.66). (E) The sensitivity (%) and specificity (%) for dd-cfDNA to discriminate active rejection versus no active rejection status. (F) The PPV and NPV for dd-cfDNA for discriminating active rejection from no active rejection.
Figure 4.
dd-cfDNA levels are higher in ABMR than TCMR. (A) dd-cfDNA in 27 biopsy-based rejections: 10 chronic, active ABMR; six acute/active ABMR; 16 TCMR, types IA (6, ▲), IB (7, ▪), and IIA (3, ♦). Biopsy specimens diagnosed with AMBR and TCMR (mixed) are shown in the ABMR plots, with points colored to indicate the TCMR diagnosis also made on the same biopsy specimen. ABMR without TCMR is shown as a circle (●). Median dd-cfDNA 2.9% (ABMR). Median for TCMR-only, 1.2% (types ≥IB), 0.2% (TCMR type IA). (B) All data for samples classified as TCMR, including TCMR mixed with ABMR.
The fractions of true and false positive results for dd-cfDNA to discriminate active rejection are shown in Figure 3C. The area under the curve (AUC) was 0.74 (95% confidence interval [95% CI], 0.61 to 0.86). With a cutoff of 1.0%, dd-cfDNA had an 85% specificity (95% CI, 79% to 91%) and 59% sensitivity (95% CI, 44% to 74%) to discriminate active rejection from no rejection. This is graphed as the sensitivity and specificity over the range of dd-cfDNA (Figure 3E). The range of PPV and NPV for dd-cfDNA for discriminating active rejection is shown in Figure 3F; the PPV was 61% and NPV was 84%, with the 1.0% dd-cfDNA cutoff.
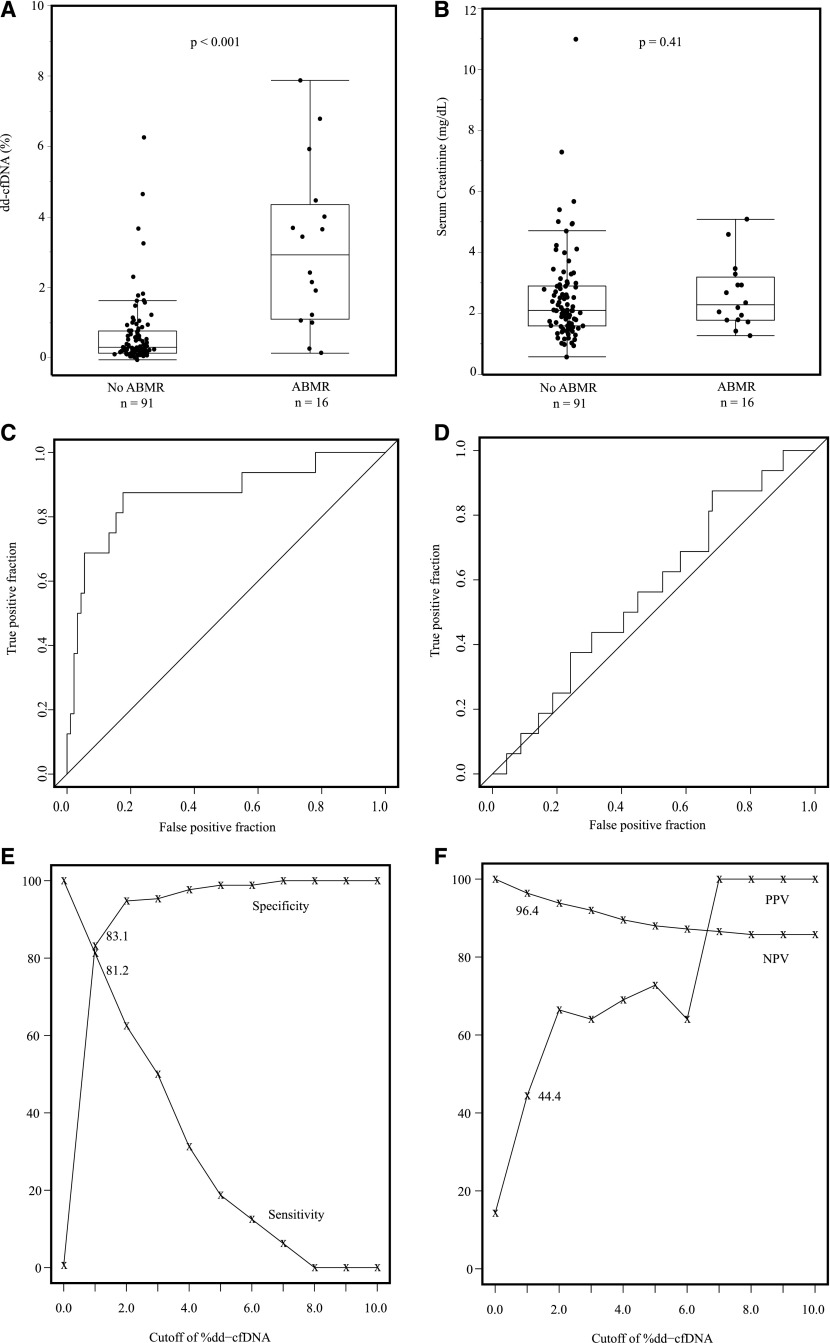
Serum creatinine at time of biopsy did not discriminate active rejection from no active rejection (Figure 3B). The ROC curve for creatinine to discriminate active rejection had an AUC of 0.54 (95% CI, 0.43 to 0.66); i.e., at any cut-off level for creatinine, there were as many false as true positive results (Figure 3D).
When the cohort of ABMR (including mixed ABMR and TCMR) was compared with the cohort of all non-ABMR (including TCMR-only), the fraction of dd-cfDNA differed significantly (P<0.001, Figure 5A), whereas there was no discrimination by serum creatinine (Figure 5B). The fraction of true positive results and the fraction of false positive results for dd-cfDNA to discriminate ABMR status are shown in Figure 5C. The AUC was 0.87 (95% CI, 0.75 to 0.97). With a cutoff of 1.0%, dd-cfDNA has an 83% specificity (95% CI, 78% to 89%) and 81% sensitivity (95% CI, 67% to 100%) to discriminate ABMR from no ABMR. The sensitivity and specificity to discriminate ABMR over the range of potential cutoffs is shown in Figure 5E. The range of PPV and NPV for discriminating ABMR is shown in Figure 5F; the PPV was 44% and NPV was 96% with the 1.0% dd-cfDNA cutoff. The ROC curve for creatinine to discriminate ABMR had an AUC of 0.57 (95% CI, 0.42 to 0.71) (Figure 5D).
Figure 5.
dd-cfDNA discriminates ABMR. (A) Fraction of dd-cfDNA in ABMR (n=16) versus no ABMR (n=91). Box and whisker plots; horizontal line represents the median; bottom and top of each box represents 25th and 75th percentiles. Dots are individual results. Median dd-cfDNA in ABMR 2.9% versus 0.29% for no ABMR (P<0.001). (B) Serum creatinine (milligrams per deciliter) in ABMR (n=16) versus no ABMR (n=91). Serum creatinine was not significantly different in median values between two groups (P=0.41). (C) ROC curve for dd-cfDNA to discriminate active ABMR. AUC=0.87 (95% CI, 0.75 to 0.97). (D) ROC curve for serum creatinine to discriminate ABMR. AUC=0.57 (95% CI, 0.42 to 0.71). (E) The sensitivity (%) and specificity (%) for dd-cfDNA to discriminate active ABMR versus no active ABMR. (F) The PPV and NPV for dd-cfDNA to discriminate active ABMR from no active ABMR.
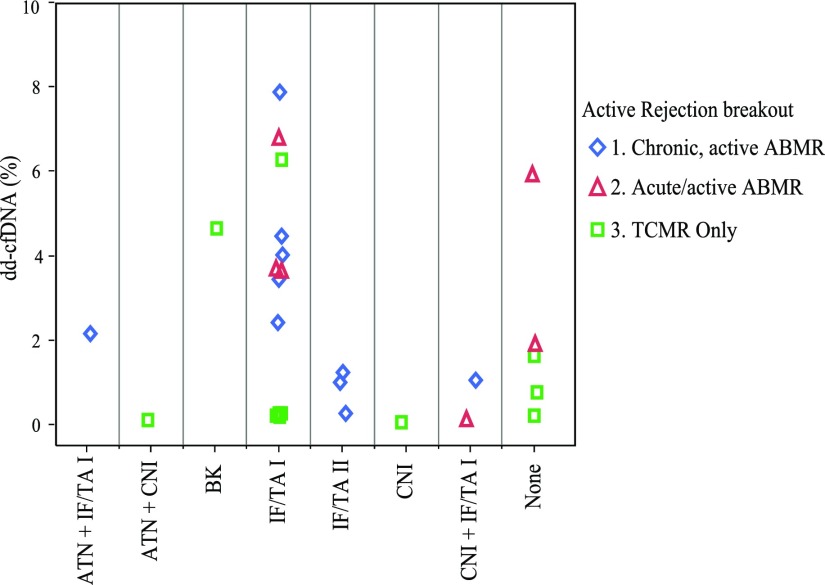
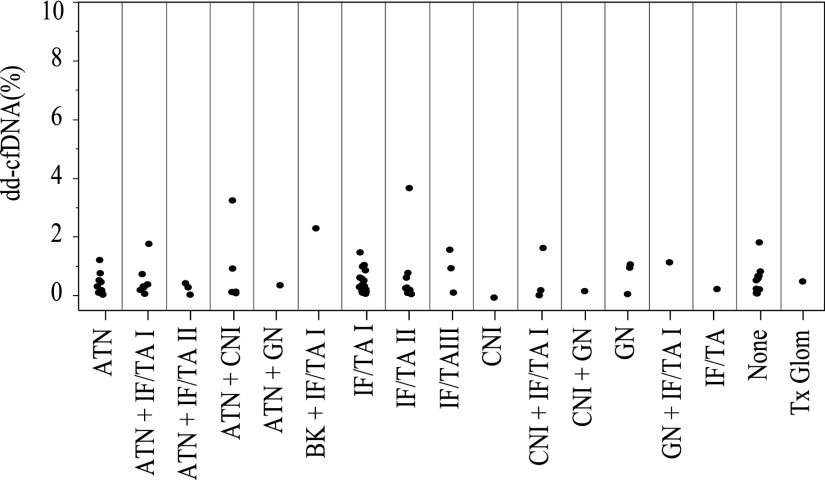
Among the 58 active rejections found in the clinically indicated biopsies, the available 27 paired dd-cfDNA results are shown in Figure 4A, broken out by rejection subclass: ten were chronic, active ABMR; six acute/active ABMR; and 11 TCMR only (types IA [5], IB [5], and IIA [1]). As shown, the lowest types of TCMR (type IA) had lower dd-cfDNA than type IB or type IIA (Figure 4B), although the number of cases was very limited. The similarity in the pattern of dd-cfDNA values in the nominal two classes of ABMR was not surprising, because the histologic criteria overlap for these forms of ABMR. Figure 6 shows the dd-cfDNA results in the same 27 cases of active rejection, categorized by other findings in addition to histologic evidence of active rejection. For comparison, Figure 7 shows the results in the 80 biopsy specimens with no rejection, categorized by other histologic findings. In both the active rejection and no active rejection groups, interstitial fibrosis/tubular atrophy (IF/TA) and acute tubular necrosis were relatively common coincidental findings, and no obvious trend in the dd-cfDNA was associated with these. Because of the small number of cases of these other diagnoses, including calcineurin inhibitor (CNI) toxicity and BK virus (BKV), statistical analyses of these patterns were not performed.
Figure 6.
dd-cfDNA levels in plasma from patients with active rejection are not correlated with other histopathological findings. ◊, chronic, active ABMR; △, acute/active ABMR; ◻, TCMR only.
Figure 7.
dd-cfDNA levels in plasma from patients without active rejection are not correlated with other histopathological findings. Each circle represents a biopsy specimen. BK, BK virus; Tx Glom, transplant glomerulopathy.
Of 80 clinically indicated biopsies with no active rejection findings, only nine biopsy specimens were reported to show essentially normal histology (i.e., no other coincidental findings, such as IF/TA, acute tubular necrosis, BKV, GN, CNI toxicity). We performed a comparison of dd-cfDNA in the group of the normal biopsy specimens to the biopsy specimens showing no active rejection but one or more coincidental findings: in the normal group (n=9) the median dd-cfDNA was 0.53% (interquartile range, 0.22%–0.67%); in the coincidental finding group (n=71), the median dd-cfDNA was 0.30% (interquartile range, 0.14%–0.77%) (Wilcoxon rank sum test P=0.9).
Among the 107 biopsy specimens in either the active rejection or no active rejection groups, there were two reports in which the pathologists noted findings of papilloma BK virus. In case one, there was a viral load of >2 million copies of BKV/ml blood, and inflammation equivalent to Banff 1B intensity (i2–3, t3). In case two, there was moderate IF/TA and 9.99 million copies of BKV/ml blood. The dd-cfDNA level was 4.6% and 2.3%, respectively, in these cases.
Discussion
In this study, most (204 of 242) kidney transplant biopsies were triggered by an elevation in serum creatinine over baseline with concerns for alloimmune injury, yet only 27% of these clinically indicated biopsies revealed active rejection. The results in the 107 biopsy specimens paired with plasma cfDNA showed that dd-cfDNA levels discriminated an active rejection status with an ROC-AUC of 0.74 and provided an estimated NPV 84% and PPV 61% at a cutoff of 1.0% dd-cfDNA. These results validated and extended prior reports of the performance characteristics of this assay.7 There was stronger performance of dd-cfDNA in discriminating ABMR from no ABMR allograft status (ROC-AUC 0.87, NPV 96%, PPV 44%, cutoff of 1.0% dd-cfDNA). dd-cfDNA in 16 cases of ABMR was significantly higher (2.9%) than in 11 cases of TCMR rejection (0.2% in type IA [five patients], 1.2% in combined type IB [five patients] and type IIA [one patient]), and 0.3% in the no active rejection cohort (n=80). Because there is a clear trend that dd-cfDNA was higher in type IB TCMR than in type IA, we speculate that dd-cfDNA is likely to be higher in the more severe types of TCMR, but this cohort did not have enough cases to test this hypothesis.
The elevation of dd-cfDNA (>1%) was significantly associated with acute/active and chronic, active ABMR (Figure 1). The dd-cfDNA levels across the threshold of 1% also associated with type IB TCMR and transplant glomerulopathy. With the limited number of rejection events and intrinsic coupling to Banff histopathology subelements, we are unable to discern any obvious subelement (e.g., microvascular inflammation) that may be more strongly associated with elevation of dd-cfDNA. This dd-cfDNA assay, which does not involve a biopsy and can be easily measured in a sequential manner, has potential to provide additional information along with de novo DSA in the diagnosis, management, and treatment of ABMR.
In contrast to dd-cfDNA, the serum creatinine level did not provide any discrimination of active rejection or ABMR from absence of active rejection or ABMR in the context of clinical indication for biopsy, because the creatinine ROC-AUC was near 0.50 (and the lower boundary of the 95th percentile confidence interval was well under 0.50 [Figure 3D and Figure 5D]).
Two cases of BKV were examples that demonstrate dd-cfDNA, by itself, may not be able to distinguish injury associated with the interstitial inflammation and tubulitis caused by BKV from similar degrees of inflammation and tubulitis caused by TCMR, but support the tenet that an elevation in dd-cfDNA may be used to reveal the degree of active allograft injury. A secondary method, most likely including a renal biopsy, will be needed to confirm the type of rejection or other injury. The observation that BKV is associated with the development of de novo DSA17 raises the possibility that an elevation in dd-cfDNA in the setting of this infection could represent alloantibody-mediated microcirculation injury. Future studies will be required to illuminate the relationship among DSA, BKV, and dd-cfDNA elevation.
Scheduled surveillance needle biopsy evaluation for renal allograft rejection or other causes of injury is limited because its risks and costs versus benefits remain controversial.18 In our study, only three of the 14 DART centers had surveillance biopsy protocols, accounting for 34 of 260 biopsies, and only one low-type TCMR was observed. This confirms other multicenter findings that protocol biopsies may not be useful because not enough reversible pathology is found.18 Because we observed that, at the time of diagnosis of active rejection, median dd-cfDNA was 2.9% and 1.2% for ABMR and TCMR type ≥IB, respectively, it is reasonable to infer that serial measurements showing increases in dd-cfDNA may be useful to detect onset of a new rejection or other injury. Because the dd-cfDNA assay may be practical to repeat monthly (or more often), the stability of the biomarker below threshold levels could also be useful to guide the short- and long-term tapering or maintenance of immunosuppression medications. The half-life of cfDNA in the blood is <1 hour,19 so changes in dd-cfDNA are expected to be a dynamic indicator of graft damage. The dd-cfDNA biomarker, in contrast to creatinine, may be a measure of cell injury in the allograft. The magnitude of increase in dd-cfDNA may be proportional to the acuity and severity of injury, akin to cardiac enzyme creatine phosphokinase or cardiac myocyte–specific protein troponin, which have been established as biomarkers of acute heart injury.20
Strengths of this dd-cfDNA study, which establishes the performance characteristics, include (1) an analytically validated assay in a College of American Pathologists-accredited, Clinical Laboratories Improvements Act (CLIA)–certified reference laboratory7; (2) the largest prospective, multicenter observational study of this test in renal transplant recipients; (3) a study population representative of United States renal transplant recipients; and (4) histopathology reports used as the reference to categorize rejection status.
There are several limitations to the study. First, we were not able to estimate the performance of dd-cfDNA to discriminate active rejection or ABMR in patients who may have had subclinical rejection because there were only 34 surveillance biopsies and only one finding of active rejection. However, this low rejection frequency is consistent with reports by others in an era of tacrolimus–mycophenolic acid–prednisone–based maintenance immunosuppression that question the utility of protocol biopsy for this purpose.18 Second, the number of active rejections (27) and subclasses of rejection observed among these biopsy specimens was limited. However, these met the target total number of rejections prospectively stated in the statistical analysis, and indeed, the results proved this number to be sufficient to demonstrate statistically significant performance characteristics. Third, biopsy-matched blood samples were not collected for all biopsy specimens, and some of the matched blood samples were excluded due to issues such as inadequate amount of total DNA or timing of the blood draw relative to the biopsy. Of all collected blood samples, 4.5% did not render results due to some aspect of sample collection or testing. Most patients completed surveillance visits in compliance (77%) with the center schedule.
By design, dd-cfDNA in the assay is measured as a fraction of total cfDNA. It is possible that perturbations unrelated to active rejection or other direct injuries to the renal allograft, such as the turnover/death rate of cells originating from the recipient’s tissues, could confound the results and interpretation of dd-cfDNA. Nevertheless, the approach used here (ratio) has been used by all published studies: increases in fraction of dd-cfDNA have been associated with rejection in independent studies of heart,5–7 liver,4,9,10 and lung8 allografts.1
The optimal time interval for serial monitoring of dd-cfDNA for surveillance remains to be defined, but monthly would be feasible, because established clinical laboratory tests such as creatinine are measured on a monthly or more frequent schedule. Additionally, this test may be ordered if there is a clinical suspicion of rejection or injury, before deciding on the need for a renal biopsy. This would be especially useful in patients who are on anticoagulation therapy or have other reasons to avoid biopsy. As with all laboratory tests, clinical assessment of the patient’s context is important when interpreting results. Although the dd-cfDNA test may not eliminate the need for biopsy, results with high PPV could increase the prebiopsy probability of detecting treatable injury, so that biopsy could be made an even more effective diagnostic tool. In association with a high NPV, dd-cfDNA results may reduce the need for biopsy in some cases of elevated creatinine.
In summary, this report sets the initial foundation for the performance characteristics of dd-cfDNA to detect active rejection and injury of the renal allograft beyond serum creatinine and without the need for a biopsy. The next steps of development include studies to validate these findings and to demonstrate the clinical utility of this new type of immune monitoring of the graft.
Concise Methods
Study Design
The DART study was a prospective observational study. Renal transplant patients were enrolled within 1–3 months of their kidney transplantation and/or at the time of a clinically indicated renal biopsy from 14 clinical sites (Supplemental Table 3, Participating Sites).
The institutional review board at each site approved the study, and all of the patients provided written informed consent. The statistical analysis, data management, and clinical operations coordination were provided by staff employed by the study sponsor.
Blood Samples and dd-cfDNA Measurement
After transplantation, blood was collected at the time of scheduled surveillance visits at months 1, 2, 3, 4, 6, 9, and 12; or at the time of each kidney allograft biopsy and up to two follow-up samples within 8 weeks of the kidney allograft biopsy. Duplicate samples of venous blood were collected at the same venipuncture in Streck Cell-Free DNA BCT tubes, stored at room temperature, and shipped to the CLIA-certified laboratory at CareDx, Inc. (Brisbane, CA). Upon arrival, and within 7 days postdraw,21 plasma was separated by centrifugation at 1600 × g for 20 minutes followed by a second centrifugation at 16,000 × g for 10 minutes and was either stored at −80°C or cfDNA was extracted immediately using the Circulating Nucleic Acid kit (Qiagen, Redwood City, CA).
We measured dd-cfDNA using a targeted next-generation sequencing assay that employs 266 single-nucleotide polymorphisms to accurately quantify dd-cfDNA in transplant recipients without need for separate genotyping of the recipient or the donor.7 The assay quantifies the fraction of dd-cfDNA in both unrelated and related donor-recipient pairs. The dd-cfDNA assay is precise across the linear quantifiable range (0.2%–16% dd-cfDNA) with a mean across-run coefficient of variation of 6.8%.7 Assay results of the clinical samples in this study were evaluated against established quality control criteria described previously,7 and only passing results used for analysis. Samples that failed quality control were repeated at the step where they failed or were repeated using plasma from the duplicate Streck Cell-Free DNA BCT tube collected at the same venipuncture as the first sample. All measurements were performed by staff unaware of the identity of the samples. The final results (percentage dd-cfDNA) were reported to the database manager, who combined them with the clinical information and transferred the combined data set to the statistical team for analysis.
Renal Allograft Biopsies
We collected information on the number of, and clinical indication for, renal transplant biopsies for each patient. The on-site pathologist’s official renal transplant biopsy diagnostic report was used by the site investigator to guide completion of the study case report form sections which captured the diagnosis of rejection in accordance with criteria designated by the Banff Working Groups.14,15 The study clinical monitor independently reviewed the pathologists’ reports to confirm that the findings met the criteria defined in the Banff Working Group classification system to support the recorded diagnostic classification, and final reconciled results were communicated with each study center and used in the final analysis dataset supplied to the study data manager.
Classification of Rejection
Renal Allograft Rejection Histologic Diagnostic Nomenclature and Rationale for Active Rejection Definition Used in the Study Analyses of dd-cfDNA
The international classification schema includes two acute rejection phenotypes: TCMR14 and acute/active ABMR.15 In the Banff 2013 report,15 there was recognition that intimal arteritis, which had been solely a criteria for TCMR (types IIA, IIB, and III) in the Banff 2007 classification,14 can also be observed and is clinically impactful in ABMR. This led these TCMR microvascular injury phenotypes to be added to the histologic evidence criteria for acute/active ABMR: “acute tissue injury, including one or more of the following: microvascular inflammation, intimal or transmural arteritis, acute thrombotic microangiopathy, or acute tubular injury.”22
In addition to “acute/active” ABMR, the international classification system designates “chronic, active” ABMR. These two ABMR subclasses have overlapping phenotypic criteria22: (1) evidence of current/recent antibody interaction with vascular endothelium (linear C4d staining in the peritubular capillaries, at least moderate microvascular inflammation, increased expression of endothelial activation, and injury transcripts or other gene expression markers of endothelial injury), and (2) serologic evidence of DSA. In practice, histologic findings observed in a single renal biopsy specimen may qualify for diagnosis of both acute/active and chronic, active ABMR and/or TCMR.16
Our primary analyses in this study combined these three subclasses of rejection defined by the Banff working groups14,15 because they share common histologic criteria and the related cell injury manifestations have potential to involve active cell injury and death16 and therefore increased levels of dd-cfDNA (Supplemental Figure 1). We use the term active rejection to describe these pooled classes of rejection. We combined these active rejection subclasses and distinguish them from all other biopsy-based diagnoses not phenotypically associated with active rejection (e.g., IF/TA).
BANFF Working Group–Based Diagnostic Subcategories Derived from Pathologists’ Reports of Renal Biopsy Findings
TCMR: Includes those biopsy reports which meet the Banff 2007 criteria14 for TCMR types IA, IIA, IB, IIB, or III.
Acute/active ABMR: Includes those biopsy reports which meet all three requisite Banff 2013 acute/active ABMR criteria15 (i.e., histologic evidence of acute tissue injury, evidence of current/recent antibody interaction with vascular endothelium, and serologic evidence of DSA).
Chronic, active ABMR: Includes those biopsy reports which meet all three requisite Banff 2013 criteria for chronic, active ABMR (i.e., histologic morphologic evidence of chronic tissue injury, evidence of current/recent antibody interaction with vascular endothelium, and “at least moderate microvasculature inflammation [(glomerulitis [g]+peritubular capillary inflammation [ptc] scores)≥2], and serologic evidence of DSA”).
The biopsy reports which diagnosed mixed ABMR and TCMR were grouped together with the ABMR subgroup for purposes of the analyses.
All other biopsy specimens not qualifying for any of the “active rejection” subclasses listed above were defined as the “no active rejection” comparator group. These “no active rejection” biopsy specimens had one or more of the following findings: no major findings, nonspecific acute tubular necrosis (or “injury”), polyoma virus, CNI toxicity, GN, IF/TA (grades I, II, or III); and TCMR “suspicious” or “borderline.”
The patients who did not undergo a renal biopsy due to clinical suspicion have been analyzed in a separate report that characterized the range of values of dd-cfDNA in the subset of DART renal allograft patients who had stable graft function.
Statistical Analyses
The objective of the primary statistical analysis was to determine whether the dd-cfDNA in a patient’s plasma can discriminate active rejection from no active rejection allograft status in patients clinically indicated for biopsy, as determined by pathologists’ renal biopsy readings, as described above. The execution of these analyses was triggered according to a prospective written plan which stated that the analysis should begin when a nominal quota of 30 biopsy-proven active rejection events had been accumulated in the database.
Secondary analyses included comparisons of dd-cfDNA performance in discriminating biopsy-based diagnosis of ABMR from all other samples that did not have biopsy evidence of ABMR.
We used the AUC, sensitivity, and specificity to evaluate the performance of dd-cfDNA in discriminating the active rejection from the comparator (no active rejection) status, using the biopsy-based, Banff Working Group classification as the standard for true allograft rejection status. The Emir method23 was used to account for multiple samples from the same patient. We estimate PPV and NPV of dd-cfDNA in predicting biopsy-based allograft active rejection in the patient. For comparative purposes, we performed similar analyses to assess the performance of serum creatinine in discriminating active rejection.
All analyses were performed with the use of R software, version 3.2.0, 64-bit, copyright 2015.
Disclosures
This study was supported by CareDx, Inc., Brisbane, CA.
Supplementary Material
Acknowledgments
We thank Paula Lea, Alan Gee, Sarah Wang, Alesha Luxon, Susan Scott, John Collins, and Migdad Machrus at CareDx, Inc., and the study coordinators at the participating centers for supporting the study conduct and sample collection, laboratory testing, and data analyses.
Footnotes
Published online ahead of print. Publication date available at www.jasn.org.
This article contains supplemental material online at http://jasn.asnjournals.org/lookup/suppl/doi:10.1681/ASN.2016091034/-/DCSupplemental.
Contributor Information
Collaborators: Roy D. Bloom, Jonathan S. Bromberg, Emilio Poggio, Suphamai Bunnapradist, Anthony Langone, Puneet Sood, Arthur Matas, Shikha Mehta, Roslyn B. Mannon, Asif Sharfuddin, Bernard Fischbach, Mohanram Narayanan, Stanley Jordan, David Cohen, Matthew Weir, David Hiller, Preethi Prasad, Robert N. Woodward, Marica Grskovic, John Sninsky, James P. Yee, and Daniel C. Brennan
References
- 1.Gielis EM, Ledeganck KJ, De Winter BY, Del Favero J, Bosmans JL, Claas FH, Abramowicz D, Eikmans M: Cell-free DNA: An upcoming biomarker in transplantation. Am J Transplant 15: 2541–2551, 2015 [DOI] [PubMed] [Google Scholar]
- 2.Lo YM, Tein MS, Pang CC, Yeung CK, Tong KL, Hjelm NM: Presence of donor-specific DNA in plasma of kidney and liver-transplant recipients. Lancet 351: 1329–1330, 1998 [DOI] [PubMed] [Google Scholar]
- 3.Snyder TM, Khush KK, Valantine HA, Quake SR: Universal noninvasive detection of solid organ transplant rejection. Proc Natl Acad Sci USA 108: 6229–6234, 2011 [DOI] [PMC free article] [PubMed] [Google Scholar]
- 4.Beck J, Bierau S, Balzer S, Andag R, Kanzow P, Schmitz J, Gaedcke J, Moerer O, Slotta JE, Walson P, Kollmar O, Oellerich M, Schütz E: Digital droplet PCR for rapid quantification of donor DNA in the circulation of transplant recipients as a potential universal biomarker of graft injury. Clin Chem 59: 1732–1741, 2013 [DOI] [PubMed] [Google Scholar]
- 5.De Vlaminck I, Valantine HA, Snyder TM, Strehl C, Cohen G, Luikart H, Neff NF, Okamoto J, Bernstein D, Weisshaar D, Quake SR, Khush KK: Circulating cell-free DNA enables noninvasive diagnosis of heart transplant rejection. Sci Transl Med 6: 241ra77, 2014 [DOI] [PMC free article] [PubMed] [Google Scholar]
- 6.Hidestrand M, Tomita-Mitchell A, Hidestrand PM, Oliphant A, Goetsch M, Stamm K, Liang HL, Castleberry C, Benson DW, Stendahl G, Simpson PM, Berger S, Tweddell JS, Zangwill S, Mitchell ME: Highly sensitive noninvasive cardiac transplant rejection monitoring using targeted quantification of donor-specific cell-free deoxyribonucleic acid. J Am Coll Cardiol 63: 1224–1226, 2014 [DOI] [PMC free article] [PubMed] [Google Scholar]
- 7.Grskovic M, Hiller DJ, Eubank LA, Sninsky JJ, Christopherson C, Collins JP, Thompson K, Song M, Wang YS, Ross D, Nelles MJ, Yee JP, Wilber JC, Crespo-Leiro MG, Scott SL, Woodward RN: Validation of a clinical-grade assay to measure donor-derived cell-free DNA in solid organ transplant recipients. J Mol Diagn 18:890–902, 2016 [DOI] [PubMed] [Google Scholar]
- 8.De Vlaminck I, Martin L, Kertesz M, Patel K, Kowarsky M, Strehl C, Cohen G, Luikart H, Neff NF, Okamoto J, Nicolls MR, Cornfield D, Weill D, Valantine H, Khush KK, Quake SR: Noninvasive monitoring of infection and rejection after lung transplantation. Proc Natl Acad Sci USA 112: 13336–13341, 2015 [DOI] [PMC free article] [PubMed] [Google Scholar]
- 9.Schutz E, Blum A, Beck J, Harden M, Koch M, Wuensch T, Stockmann M, Nashan B, Kollmar O, Matthaei J, Kanzow P, Walson PD, Brockmöller J, Oellerich M: Graft-derived cell-free DNA - a promising rejection marker in liver transplantation - results from a prospective multicenter trial [Abstract]. Clin Chem 62: S41, 2016 [Google Scholar]
- 10.Beck J, Oellerich M, Schulz U, Schauerte V, Reinhard L, Fuchs U, Knabbe C, Zittermann A, Olbricht C, Gummert JF, Shipkova M, Birschmann I, Wieland E, Schütz E: Donor-derived cell-Free DNA is a novel universal biomarker for allograft rejection in solid organ transplantation. Transplant Proc 47: 2400–2403, 2015 [DOI] [PubMed] [Google Scholar]
- 11.Grskovic M, Christie B, Hiller D, Woodward R, Yee J, Vincenti F: Donor-derived cell-free DNA in plasma increases with rejection and decreases after treatment in kidney transplant recipients [Abstract]. J Am Soc Nephrol 26: 1143, 2015 [Google Scholar]
- 12.Josephson MA: Monitoring and managing graft health in the kidney transplant recipient. Clin J Am Soc Nephrol 6: 1774–1780, 2011 [DOI] [PubMed] [Google Scholar]
- 13.Shlipak MG, Matsushita K, Ärnlöv J, Inker LA, Katz R, Polkinghorne KR, Rothenbacher D, Sarnak MJ, Astor BC, Coresh J, Levey AS, Gansevoort RT; CKD Prognosis Consortium : Cystatin C versus creatinine in determining risk based on kidney function. N Engl J Med 369: 932–943, 2013 [DOI] [PMC free article] [PubMed] [Google Scholar]
- 14.Solez K, Colvin RB, Racusen LC, Haas M, Sis B, Mengel M, Halloran PF, Baldwin W, Banfi G, Collins AB, Cosio F, David DS, Drachenberg C, Einecke G, Fogo AB, Gibson IW, Glotz D, Iskandar SS, Kraus E, Lerut E, Mannon RB, Mihatsch M, Nankivell BJ, Nickeleit V, Papadimitriou JC, Randhawa P, Regele H, Renaudin K, Roberts I, Seron D, Smith RN, Valente M: Banff 07 classification of renal allograft pathology: Updates and future directions. Am J Transplant 8: 753–760, 2008 [DOI] [PubMed] [Google Scholar]
- 15.Haas M: The revised (2013) Banff classification for antibody-mediated rejection of renal allografts: Update, difficulties, and future considerations. Am J Transplant 16: 1352–1357, 2016 [DOI] [PubMed] [Google Scholar]
- 16.Lefaucheur C, Loupy A, Vernerey D, Duong-Van-Huyen JP, Suberbielle C, Anglicheau D, Vérine J, Beuscart T, Nochy D, Bruneval P, Charron D, Delahousse M, Empana JP, Hill GS, Glotz D, Legendre C, Jouven X: Antibody-mediated vascular rejection of kidney allografts: A population-based study. Lancet 381: 313–319, 2013 [DOI] [PubMed] [Google Scholar]
- 17.Sawinski D, Forde KA, Trofe-Clark J, Patel P, Olivera B, Goral S, Bloom RD: Persistent BK viremia does not increase intermediate-term graft loss but is associated with de novo donor-specific antibodies. J Am Soc Nephrol 26: 966–975, 2015 [DOI] [PMC free article] [PubMed] [Google Scholar]
- 18.Rush D, Arlen D, Boucher A, Busque S, Cockfield SM, Girardin C, Knoll G, Lachance JG, Landsberg D, Shapiro J, Shoker A, Yilmaz S: Lack of benefit of early protocol biopsies in renal transplant patients receiving TAC and MMF: A randomized study. Am J Transplant 7: 2538–2545, 2007 [DOI] [PubMed] [Google Scholar]
- 19.Yu SC, Lee SW, Jiang P, Leung TY, Chan KC, Chiu RW, Lo YM: High-resolution profiling of fetal DNA clearance from maternal plasma by massively parallel sequencing. Clin Chem 59: 1228–1237, 2013 [DOI] [PubMed] [Google Scholar]
- 20.Wu AH, Lu QA, Todd J, Moecks J, Wians F: Short- and long-term biological variation in cardiac troponin I measured with a high-sensitivity assay: Implications for clinical practice. Clin Chem 55: 52–58, 2009 [DOI] [PubMed] [Google Scholar]
- 21.Norton SE, Luna KK, Lechner JM, Qin J, Fernando MR: A new blood collection device minimizes cellular DNA release during sample storage and shipping when compared to a standard device. J Clin Lab Anal 27: 305–311, 2013 [DOI] [PMC free article] [PubMed] [Google Scholar]
- 22.Djamali A, Kaufman DB, Ellis TM, Zhong W, Matas A, Samaniego M: Diagnosis and management of antibody-mediated rejection: Current status and novel approaches. Am J Transplant 14: 255–271, 2014 [DOI] [PMC free article] [PubMed] [Google Scholar]
- 23.Emir B, Wieand S, Su JQ, Cha S: Analysis of repeated markers used to predict progression of cancer. Stat Med 17: 2563–2578, 1998 [DOI] [PubMed] [Google Scholar]
Associated Data
This section collects any data citations, data availability statements, or supplementary materials included in this article.


