

Abstract
PURPOSE: Recently, cone-beam breast computed tomography (CBCT) is established for the breast investigation. The purpose of the present study was to investigate possible associations between CBCT findings and histopathological features in breast cancer. METHODS: Overall, 59 female patients, mean age of 64.6 years with histological proven breast cancer were included into the study. In all cases, non-contrast CBCT examination was done. The diagnosis of the identified lesions was confirmed histologically by biopsy. Immunohistochemical staining against estrogen receptor (ER), progesterone receptor (PR), human epidermal growth factor receptor 2 (HER2) and Ki-67 was performed for every lesion. Collected data were evaluated by means of descriptive statistics. Spearman's correlation coefficient was used to analyze the association between CT density and Ki-67 values. P values <0.05 were taken to indicate statistical significance in all instances. RESULTS: The size of the lesion varied from 2.7 to 90.0, mean size, 15.88 ± 13.0 mm. The mean value of CT density of the lesions was 63.95 ± 38.18 HU. The density tended to be higher in tubular carcinoma. Correlation analysis identified no significant correlations between CT density and Ki-67 level (r = −0.031, P = .784). There were no statistically significant differences of CT density between tumors with different receptor status. CONCLUSIONS: No significant associations between CT density and receptor status in breast cancer. Tubular carcinoma tended to have higher CT density in comparison to other subtypes of breast carcinomas.
Introduction
Breast cancer comprises different subtypes of tumors with different clinical behavior [1], [2]. According to the literature, also imaging features of several breast cancer subtypes are different [3], [4], [5], [6]. Furthermore, several studies investigated relationships between biomarkers and imaging features in breast cancer [3], [4], [5], [6], [7]. It has been shown that imaging patterns can predict histopathological and molecular features of breast carcinomas [3], [4], [5], [6], [7]. So, Bae et al. reported that human epidermal growth factor receptor (HER2) status was associated with the probability of malignancy of mammographic calcifications in ductal carcinoma in situ (DCIS) [3]. Furthermore, Seo et al. mentioned that HER2 subtype was associated with a higher BI-RADS category [6]. Numerous studies compared magnetic resonance imaging (MRI) features between different breast cancers [4], [5], [7]. According to Youk et al. triple negative breast carcinomas were larger in size, better defined, and had more necrotic tissue than other cancers [4]. In addition, it has been reported that androgen receptor-positive triple negative tumors were more likely to be associated with non-mass types and a higher incidence of irregular and spiculated lesions on MRI than androgen-receptor negative lesions [5]. Some reports indicated also correlations between proliferation index Ki-67 and imaging features in breast cancer [7]. For example, Szabo et al. reported that rim enhancement on dynamic MRI was associated with high expression of Ki-67 and poor prognosis of breast cancer [7].
For a short time, cone-beam breast computed tomography (CBCT) is established for the breast investigation. According to the literature, CBCT had a higher sensitivity in cancer diagnostic in comparison to breast ultrasound and mammography [8], [9].
The purpose of the present study was to investigate possible associations between CBCT findings and histopathological features in breast cancer.
Material and Methods
This retrospective study was reviewed and approved by the ethics committee of the University Medical Center Goettingen. Written informed consent was obtained from all study patients.
Patients
Between August 2015 and November 2016, 59 female patients, mean age of 64.6 years (median age, 65.6 years; range, 41–80 years) with histological proven breast cancer were included into the study. In most of them an ultrasound-guided biopsy was done (53 cases). In three cases a CT-guided biopsy with the CBCT, in two cases a MRI-guided biopsy and in one case a stereotactic biopsy was done. Histological diagnoses and tumor stage of the patients are shown in Table 1.
Table 1.
Tumor Types and Stages
| Tumor type | n | % |
|---|---|---|
| DCIS | 4 | 6.78 |
| IDC | 40 | 67.80 |
| ILC | 10 | 16.95 |
| MC | 3 | 5.08 |
| TC | 2 | 3.39 |
| Tumor stage | n | % |
| T stage | ||
| pTis | 4 | 6.78 |
| pT1a | 3 | 5.08 |
| pT1b | 5 | 8.48 |
| pT1c | 23 | 38.98 |
| pT2 | 13 | 22.03 |
| pT3 | 2 | 3.39 |
| ypTx | 9 | 15.26 |
| N stage | n | |
| N0 | 34 | 57.63 |
| N1 | 10 | 16.95 |
| N2 | 2 | 3.39 |
| Nx | 13 | 22.03 |
Abbreviations: n, number; DCIS, ductal carcinoma in situ; IDC, invasive ductal carcinoma; ILC, invasive lobular carcinoma; MC, mucinous carcinoma; TC, tubular carcinoma.
Quantitative Lesion Analysis
In all cases, non-contrast CBCT examination (Koning Breast CT, CBCT 1000, Koning Corporation, West Henrietta, NY, USA) was done in a standard manner [9], [10]. Tube voltage was 49 kV, and tube current ranged from 50 to 200 mA. Axial images were reconstructed by using a standard mode with a soft tissue filter and a voxel size of 0.273 mm3. A dedicated 3D visualization software and computer workstation (Visage CS Thin Client / Server, Visage Imaging, Richmond, Australia) was utilized to evaluate CBCT data sets. Two radiologists, with 7 and 30 years' experience in breast imaging and both two years of experience in CBCT imaging, identified diagnoses of breast cancer on CBCT images by consensus. Descriptive statistics, including mean voxel density in Hounsfield units (HU), numbers of pixel and ± standard deviations (SD) were measured for each outlined lesion. The density of each lesion was measured using 3 rectangular regions of interest (ROI) in coronal view with a slice thickness of 2 mm and a mean value of the estimated CT density was calculated. The measurements were done in the edge region of the lesion (Figure 1).
Figure 1.
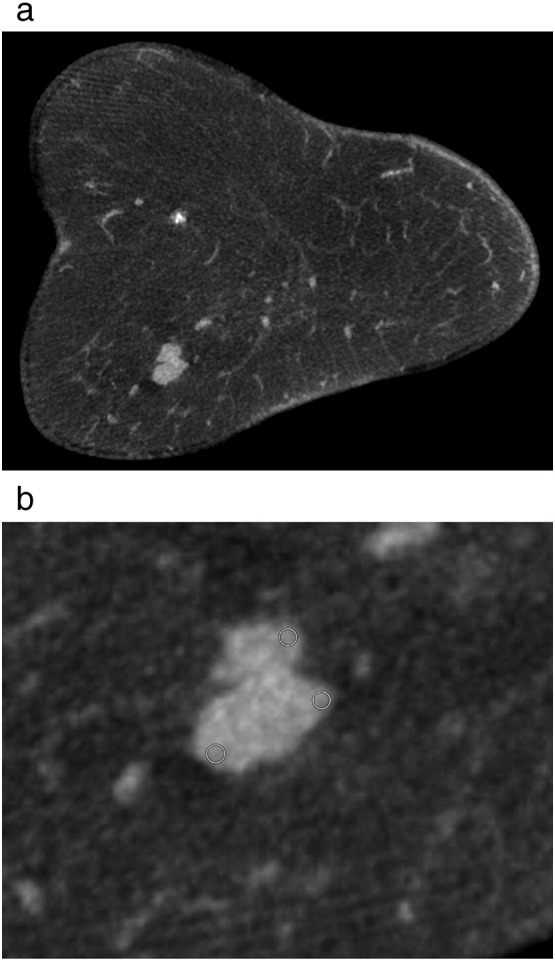
Imaging findings in a 82-year old woman with mucinous carcinoma. (a) Non-contrast cone-beam breast CT in coronal view with 2.0 mm slice thickness documenting a lobulated mass of the left breast. (b) The quantitative lesion analysis shows a mean value of 36.8 HU from the three ROI's in the edge region of the lesion. Histopathological findings are as follows: ER positive, PR positive, HER2 negative and Ki-67 index = 12%.
Overall, quantitative analysis was performed in 85 lesions. 255 ROI's were segmented manually with constant window and level settings. The ROI's measured a mean area of 38.9 ± 15.6 pixels (range 13.4–108.7 pixels).
Histopathological Analysis
All breast tumors were routinely fixed in 5% formalin, and processes into paraffin blocks for pathological examination. Immunohistochemical (IHC) staining of ER, PR, HER2 and Ki-67 was routinely carried out by using Dako Omnis system (Dako, Denmark). Tissue sections were cut at 4-μm thickness, including the largest cut surface of the tumor, and stained with primary antibodies against estrogen receptor (ER) (EP1, Ready-to-Use, Dako, Denmark), progesterone receptor (PR) (PgR 1294, Ready-to-Use, Dako, Denmark), human epidermal growth factor receptor 2 (HER2) (A0485, 1:400, Polyclonal Rabbit-Anti-Human c-erbB-2, Dako, Denmark), Ki-67 (MIB-1, Ready-to-Use, Dako, Denmark). IHC expression of HER2 was scored as follows: 0 (no staining or faint membrane staining), 1+ (faint membrane staining in >10% of tumor cells, incomplete membrane staining), 2+ (weak to moderate membrane staining in >10% of tumor cells), and 3+ (uniform, intense membrane staining of >30% of invasive tumor cells). HER2-positive cases were those with IHC score 3+ or IHC 2+ and FISH-amplified [11].
All histologic and IHC tumor slides were evaluated by an experienced breast pathologists. Histological grades and all biological features were evaluated based on the invasive components. The cutoff for ER positivity and PR positivity was 1% positive tumor cells with nuclear staining [12]. The Ki-67 index was expressed as the percentage of positively nuclear staining cells among at least 1000 invasive cells in the area scored. Staining intensity was not relevant [13].
Statistical Analysis
For statistical analysis the SPSS statistical software package was used (SPSS 17.0, SPSS Inc., Chicago IL, USA). Collected data were evaluated by means of descriptive statistics (absolute and relative frequencies). Categorical variables were expressed as percentages. Spearman's correlation coefficient was used to analyze the association between CT density and Ki-67 values. CT density in different subgroups was compared using Mann–Whitney-test. P values <0.05 were taken to indicate statistical significance in all instances.
Results
Overall, in the 59 patients, 85 lesions were identified and biopsied. The size of the lesion varied from 2.7 to 90.0, mean size, 15.88 ± 13.0 mm. The mean value of CT density of the analyzed lesions was 63.95 ± 38.18HU, range, 2.86–160.75 HU, median value, 57.85 HU. The density tended to be higher in tubular carcinoma (TC) in comparison to other tumor subtypes (Table 2, Figure 2).
Table 2.
Comparison of CT Density between Histological Tumor Subtypes
| DCIS | IDC | ILC | MC | TC | |
|---|---|---|---|---|---|
| HU, mean ± SD | 74.28 ± 14.40 | 66.79 ± 38.28 | 62.28 ± 32.16 | 33.82 ± 32.99 | 95.38 ± 56.75 |
| vs. IDC | vs. ILC | vs. TC | vs. TC | vs. DCIS | |
| P = .99 | P = .99 | P = .99 | P = .06 | P = .99 | |
| vs. ILC | vs. MC | vs. ILC | |||
| P = .99 | P = .11 | P = .66 | |||
| vs. TC | vs. DCIS | ||||
| P = .99 | P = .48 |
Abbreviations: HU, Hounsfield unit; SD, standard deviation; DCIS, ductal carcinoma in situ; IDC, invasive ductal carcinoma; ILC, invasive lobular carcinoma; MC, mucinous carcinoma; TC, tubular carcinoma.
Figure 2.

CT density in different tumor subtypes.
There were no significant differences of CT density between the tumor subtypes. The density tended to be higher in tubular carcinoma and lowest in mucinous tumors in comparison to other tumor subtypes. Abbreviations: HU, Hounsfield unit; DCIS, ductal carcinoma in situ; IDC, invasive ductal carcinoma; ILC, invasive lobular carcinoma; Ca, Carcinoma.
Correlation analysis identified no significant correlations between CT density and Ki-67 level (r = −0.031, P = .784).
Furthermore, we analyzed CT density in dependence on different receptor status. There were no statistically significant differences of CT density between tumors with different receptor status (Table 3).
Table 3.
Comparison of CT Density between Tumors with Different Biomarker Expression
| ER negative | ER positive | P value | |
|---|---|---|---|
| HU, mean ± SD | 68.33 ± 39.39 | 63.43 ± 38.27 | 0.72 |
| PR negative | PR positive | P value | |
| HU, mean ± SD | 61.51 ± 38.41 | 64.32 ± 38.40 | 0.82 |
| HER2 negative | HER2 positive | P value | |
| HU, mean ± SD | 61.46 ± 38.89 | 79.30 ± 34.81 | 0.19 |
Discussion
The present study documented associations between CT density and different histopathological parameters in breast cancer. To the best of our knowledge, this is the first work regarding breast CT findings and histopathology.
Previously, numerous studies analyzed relationships between histological and imaging parameters in breast cancer. Most of them focused on MRI [4], [5], [7], [14]. Girardi et al. found a significant correlation between stellate–dendritic shape of breast carcinoma and the presence of associated extensive intraductal component [14]. Furthermore, the authors identified associations between Ki-67 expression and signal intensity curve [14]. It has been shown that 81% tumors with washout curve had an overexpression of Ki-67 and tumors with plateau curve had an overexpression of Ki-67 in 21% only [14]. Also Lee et al. mentioned in their research that the wash out phenomenon of kinetic curve was strong associated with a high proliferation potential in breast cancer [15]. Additionally, a multivariate analysis showed that a spiculated margin was a significant, independent predictor of a lower histological grade (P < .001), and lower expression of Ki-67 (P = .007) [15]. However, rim enhancement was significant, independent predictor of a higher histological grade (P < .001), negative expression of estrogen receptor (ER) (P = .001), and negative expression of progesterone receptor (PR) (P < .001) [15].
Diffusion weighted imaging (DWI) is another MRI tool to analyze tumor composition [16]. Previous reports documented different relationships between DWI and histopathology in breast cancer [16], [17], [18]. For example, Matsubayashi et al. showed that apparent diffusion coefficient (ADC) correlated significantly with cellular density and features of tumor stromain breast cancer [17]. Furthermore, Choi et al. suggested that ADC can discriminate invasive ductal carcinoma (IDC) and ductal carcinoma in situ (DCIS) [18]. It has been shown that IDC had statistically significant lower ADC values than DCIS [18]. Moreover, ADC can also distinguish tumors with different receptor expression [18]. So, ADC values of ER-positive or PR-positive cancer were significantly lower than that of ER-negative or PR-negative cancer [18]. In addition, an ADC value of Ki-67 index-positive cancer was significantly lower than that of Ki-67 index-negative cancer [18].
CBCT is a novel approach of breast investigation [8], [10], [18], [19]. To date, there are only few reports regarding this modality [8], [10], [19]. As mentioned by O′Connel et al., breast CT displays 3D images of the internal structures of the breast, and, therefore, evaluation of suspicious features like microcalcifications, masses, and asymmetries can be made in multiple anatomical planes from a single scan [10], [20]. Furthermore, Zhao et al. showed that CBCT might be considerably more effective to identify breast masses, especially some small, uncertain or multifocal masses than conventional two-view mammography [19].
To date, there are no studies investigated associations between breast CT features, especially CT density and histopathological findings in breast cancer.
Presumably, CT density can reflect several histopathological features in breast cancer. For example, according to the literature, in lung cancer, tumor CT density on non-contrast images showed strong correlation with the pathologic heterogeneity. [21]. However, our results cannot confirm this hypothesis. As seen, neither Ki-67 nor ER, PR, and HER2 did not correlate with CT density of breast cancer. However, although statistically nonsignificant, CT density was different in several subtypes of breast cancer. Especially mucinous cancer had low CT density. This finding is plausible because the fact that mucinous tumors contain mucin and low proportion of cells. On the contrary, tubular carcinomas showed higher CT densities. We think that other histopathological parameters, such as cell count, tumor stroma and/or extracellular matrix may correlate with CT density. Clearly, further investigations are needed to consider this assumption. In addition, other analysis of CT density with more parameters than only mean value, for example histogram analysis, may be helpful.
In conclusion, our analysis showed no significant associations between CT density and receptor status in breast cancer. Tubular carcinoma tended to have higher CT density in comparison to other subtypes of breast carcinomas.
Acknowledgement
none.
Footnotes
Conflict of Interest: There is no conflict of interest.
Funding statement: This research did not receive any specific grant from funding agencies in the public, commercial, or not-for-profit sectors.
References
- 1.de Ronde JJ, Hannemann J, Halfwerk H, Mulder L, Straver ME, Vrancken Peeters MJ, Wesseling J, van de Vijver M, Wessels LF, Rodenhuis S. Concordance of clinical and molecular breast cancer subtyping in the context of preoperative chemotherapy response. Breast Cancer Res Treat. 2010;119(1):119–126. doi: 10.1007/s10549-009-0499-6. [DOI] [PubMed] [Google Scholar]
- 2.Goldhirsch A, Wood WC, Coates AS, Gelber RD, Thürlimann B, Senn HJ. Strategies for subtypes--dealing with the diversity of breast cancer: highlights of the St. Gallen International Expert Consensus on the Primary Therapy of Early Breast Cancer 2011. Ann Oncol. 2011;22(8):1736–1747. doi: 10.1093/annonc/mdr304. [DOI] [PMC free article] [PubMed] [Google Scholar]
- 3.Bae MS, Moon WK, Chang JM, Cho N, Park SY, Won JK, Jeon YK, Moon HG, Han W, Park IA. Mammographic features of calcifications in DCIS: correlation with oestrogen receptor and human epidermal growth factor receptor 2 status. Eur Radiol. 2013;23(8):2072–2078. doi: 10.1007/s00330-013-2827-9. [DOI] [PubMed] [Google Scholar]
- 4.Youk JH, Son EJ, Chung J, Kim JA, Kim EK. Triple-negative invasive breast cancer on dynamic contrast-enhanced and diffusion-weighted MR imaging: comparison with other breast cancer subtypes. Eur Radiol. 2012;22(8):1724–1734. doi: 10.1007/s00330-012-2425-2. [DOI] [PubMed] [Google Scholar]
- 5.Bae MS, Park SY, Song SE, Kim WH, Lee SH, Han W, Park IA, Noh DY, Moon WK. Heterogeneity of triple-negative breast cancer: mammographic, US, and MR imaging features according to androgen receptor expression. Eur Radiol. 2015;25(2):419–427. doi: 10.1007/s00330-014-3419-z. [DOI] [PubMed] [Google Scholar]
- 6.Seo BK, Pisano ED, Kuzimak CM, Koomen M, Pavic D, Lee Y, Cole EB, Lee J. Correlation of HER-2/neu overexpression with mammography and age distribution in primary breast carcinomas. Acad Radiol. 2006;13(10):1211–1218. doi: 10.1016/j.acra.2006.06.015. [DOI] [PubMed] [Google Scholar]
- 7.Szabo BK, Aspelin P, Kristoffersen Wiberg M, Tot T, Bone B. Invasive breast cancer: correlation of dynamic MR features with prognostic factors. Eur Radiol. 2003;13(11):2425–2435. doi: 10.1007/s00330-003-2000-y. [DOI] [PubMed] [Google Scholar]
- 8.He N, Wu YP, Kong Y, Lv N, Huang ZM, Li S, Wang Y, Geng ZJ, Wu PH, Wei WD. The utility of breast cone-beam computed tomography, ultrasound, and digital mammography for detecting malignant breast tumors: A prospective study with 212 patients. Eur J Radiol. 2016;85(2):392–403. doi: 10.1016/j.ejrad.2015.11.029. [DOI] [PubMed] [Google Scholar]
- 9.Wienbeck S, Lotz J, Fischer U. Review of clinical studies and first clinical experiences with a commercially available cone-beam breast CT in Europe. Clin Imaging. 2017;42:50–59. doi: 10.1016/j.clinimag.2016.11.011. [DOI] [PubMed] [Google Scholar]
- 10.O'Connell A, Conover DL, Zhang Y, Seifert P, Logan-Young W, Lin CF, Sahler L, Ning R. Cone-beam CT for breast imaging: Radiation dose, breast coverage, and image quality. AJR Am J Roentgenol. 2010;195(2):496–509. doi: 10.2214/AJR.08.1017. [DOI] [PubMed] [Google Scholar]
- 11.Wolff AC, Hammond ME, Hicks DG, Dowsett M, McShane LM, Allison KH, Allred DC, Bartlett JM, Bilous M, Fitzgibbons P. Recommendations for human epidermal growth factor receptor 2 testing in breast cancer: American Society of Clinical Oncology/College of American Pathologists clinical practice guideline update. Arch Pathol Lab Med. 2014;138(2):241–256. doi: 10.5858/arpa.2013-0953-SA. [DOI] [PMC free article] [PubMed] [Google Scholar]
- 12.Hammond ME, Hayes DF, Dowsett M, Allred DC, Hagerty KL, Badve S, Fitzgibbons PL, Francis G, Goldstein NS, Hayes M. American Society of Clinical Oncology/College Of American Pathologists guideline recommendations for immunohistochemical testing of estrogen and progesterone receptors in breast cancer. J Clin Oncol. 2010;28(16):2784–2795. doi: 10.1200/JCO.2009.25.6529. [DOI] [PMC free article] [PubMed] [Google Scholar]
- 13.Dowsett M, Nielsen TO, A'Hern R, Bartlett J, Coombes RC, Cuzick J, Ellis M, Henry NL, Hugh JC, Lively T. Assessment of Ki67 in breast cancer: recommendations from the International Ki67 in Breast Cancer working group. J Natl Cancer Inst. 2011;103(22):1656–1664. doi: 10.1093/jnci/djr393. [DOI] [PMC free article] [PubMed] [Google Scholar]
- 14.Girardi V, Carbognin G, Camera L, Tonegutti M, Bonetti F, Manfrin E, Pozzi Mucelli R. Fischer's score criteria correlating with histopathological prognostic factors in invasive breast cancer. Radiol Med. 2010;115(3):421–433. doi: 10.1007/s11547-009-0453-z. [DOI] [PubMed] [Google Scholar]
- 15.Lee SH, Cho N, Kim SJ, Cha JH, Cho KS, Ko ES, Moon WK. Correlation between high resolution dynamic MR features and prognostic factors in breast cancer. Korean J Radiol. 2008;9(1):10–18. doi: 10.3348/kjr.2008.9.1.10. [DOI] [PMC free article] [PubMed] [Google Scholar]
- 16.Mori N, Ota H, Mugikura S, Takasawa C, Ishida T, Watanabe G, Tada H, Watanabe M, Takase K, Takahashi S. Luminal-type breast cancer: correlation of apparent diffusion coefficients with the Ki-67 labeling index. Radiology. 2015;274(1):66–73. doi: 10.1148/radiol.14140283. [DOI] [PubMed] [Google Scholar]
- 17.Matsubayashi RN, Fujii T, Yasumori K, Muranaka T, Momosaki S. Apparent Diffusion Coefficient in Invasive Ductal Breast Carcinoma: Correlation with Detailed Histologic Features and the Enhancement Ratio on Dynamic Contrast-Enhanced MR Images. J Oncol. 2010:2010. doi: 10.1155/2010/821048. [DOI] [PMC free article] [PubMed] [Google Scholar]
- 18.Choi SY, Chang YW, Park HJ, Kim HJ, Hong SS, Seo DY. Correlation of the apparent diffusion coefficiency values on diffusion-weighted imaging with prognostic factors for breast cancer. Br J Radiol. 2012;85(1016):e474–e479. doi: 10.1259/bjr/79381464. [DOI] [PMC free article] [PubMed] [Google Scholar]
- 19.Zhao B, Zhang X, Cai W, Conover D, Ning R. Cone beam breast CT with multiplanar and three dimensional visualization in differentiating breast masses compared with mammography. Eur J Radiol. 2015;84(1):48–53. doi: 10.1016/j.ejrad.2014.05.032. [DOI] [PubMed] [Google Scholar]
- 20.O'Connell AM, Karellas A, Vedantham S. The potential role of dedicated 3D breast CT as a diagnostic tool: review and early clinical examples. Breast J. 2014;20(6):592–605. doi: 10.1111/tbj.12327. [DOI] [PMC free article] [PubMed] [Google Scholar]
- 21.Choi ER, Lee HY, Jeong JY, Choi YL, Kim J, Bae J, Lee KS, Shim YM. Quantitative image variables reflect the intratumoral pathologic heterogeneity of lung adenocarcinoma. Oncotarget. 2016;7(41):67302–67313. doi: 10.18632/oncotarget.11693. [DOI] [PMC free article] [PubMed] [Google Scholar]