

Abstract
To investigate the associations of leptin, adiponectin and high-sensitive (hs) C-reactive protein (CRP) with risk and prognosis of amyotrophic lateral sclerosis (ALS). Data from a population-based case-control study in Southern Germany (10/2010–6/2014) of 289 ALS patients (mean age of 65.7 (SD 10.5) years, 59.5% men) and 506 controls were included. During median follow-up of 14.5 months of 279 ALS patients 104 (53.9% men, 68.9 (10.3) years) died. Serum samples were measured for leptin, adiponectin and hs-CRP. Conditional logistic regression was used to estimate ALS risk. Survival models were used to appraise the prognostic value. ALS patients were characterized by lower levels of school education, BMI and smoking prevalence. Adjusted for covariates, leptin was inversely associated with ALS risk (top vs. bottom quartile: OR 0.49; 95% CI 0.29–0.80), while for adiponectin a positive association was found (OR 2.89; 95% CI 1.78–4.68). Among ALS patients increasing leptin concentrations were associated with longer survival (p for trend 0.002), while for adiponectin no association was found (p for trend 0.55). For hs-CRP no association was found. Leptin and adiponectin, two key hormones regulating energy metabolism, were strongly and independently related with ALS risk. Leptin levels were further negatively related with overall survival of ALS patients.
Introduction
Amyotrophic lateral sclerosis (ALS), the major adult-onset motor neuron disease, is characterized by the progressive loss of motor neurons and leads to death within 3–4 years after diagnosis, usually from respiratory insufficiency1, 2. Incidence of ALS is between 2 and 4 per 100.000 person years1 and we recently reported an incidence of 2.5 per 100.000 person years in the South-West of Germany within a study with a capture-recapture rate of 82%3. Multiple genetic risk factors and environmental and lifestyle factors are postulated to contribute to disease pathogenesis1.
A large number of clinical evidence implicates dysfunctional energy homeostasis in ALS4. First, decreased weight appeared as a strong negative prognostic factor in retrospective studies5–7. Second, various biomarkers of metabolism8, including circulating lipids9, 10, adipose tissue distribution11 or cardiovascular health12, 13 were associated with survival of ALS patients or disease prognosis. A study on metabolomics revealed different metabolic profiles in ALS patients and controls14. Third, one retrospective study found a negative association between type 2 diabetes and survival in ALS patients15 but this finding was not consistent with other studies16. Existing clinical evidence is further reinforced by recent epidemiological studies showing that ALS onset and mortality are associated with low body mass index (BMI)17, 18 and lower co-occurrence of type 2 diabetes in European countries19, 20. Weight loss and energy imbalance appears as a direct contributor to neurodegeneration in ALS animal models, since high fat feeding was able to improve survival and delay neurodegeneration of ALS in mice21. Furthermore, a recent clinical trial suggested that a hypercaloric diet prolonged lifespan of ALS patients under gastrostomy10, 22. Altogether, these studies suggest that an alteration of energy metabolism might be an important driving force in ALS.
Relevant biomarkers of an individual’s energy status are circulating levels of several adipokines as hormones secreted by the adipose tissue in direct correlation with their energy stores. For instance, leptin secretion is generally positively correlated with size of the lipid droplet of the adipocyte23, while adiponectin levels are decreased with adiposity23. Both of these adipokines signal in the hypothalamus to trigger antagonistic effects, ie satiety and increased energy expenditure for leptin, and weight loss and increased energy intake for adiponectin23. Besides adipokines, systemic low grade inflammation, indirectly measured by high-sensitive (hs) C-reactive protein (CRP) levels, may also be associated with dysfunctional metabolic homeostasis, and could modulate adipokine secretion and action.
The objective of the present study was to analyze the associations of leptin, adiponectin and hs-CRP as biomarkers of energy metabolism and systemic low-level inflammation with the risk of ALS in a population-based case-control study conducted in southern Germany after controlling for potential confounders. In addition, in patients with ALS the prognostic value of the respective blood markers for overall survival was investigated in a cohort approach.
Material and Methods
Study design and study population
The ALS registry Swabia has been described previously in detail3, 24, 25. In brief, it is a clinical-epidemiological registry in a defined geographic region in the South-West of Germany, to estimate incidence and to describe the natural history of ALS. The catchment area consists of the region of Swabia with approximately 8.4 million inhabitants.
From October, 2010 until June 2014 all newly diagnosed ALS cases were registered prospectively25. Patients were also asked to provide informed consent to participate in a population-based case-control study in order to investigate risk factors of ALS. ALS cases were defined by the diagnosis of possible, probable or definite ALS according to the revised El Escorial criteria26. The following sites of onset were distinguished: bulbar, cervical, thoracic, and lumbosacral. Signs of upper or lower motor neurons damage were also recorded. All cases were reviewed by an experienced neurologist according to pre-defined standardized criteria26. Notifications of patients with suspected ALS were tracked and evaluated by the registry personnel during the clinical course of disease.
For each case (total N = 289), we intended to match two sex and age matched control subjects randomly sampled from the general population as registered in the regional registry office (“Einwohnermeldeamt”) of the catchment area of the case as specified by the postal code. The control subjects were contacted by mail. After informed consent study nurses visited cases and controls for an identical, standardized interview, neuropsychological testing, and blood sampling. Response rates were 65% in cases (20% refused and 15% could not be contacted) and 19% in controls (39% refused and 42% did not respond after several attempts to get in contact per mail and telephone). Most frequent reasons for refusal were ‘lack of interest’, followed by’limitations due to ill health or age’ and ‘lack of time’.
Non-fasting blood samples were collected and processed according to a standardized protocol and transported in cooled containers to the study center. Serum was obtained by centrifugation for 10 min at 2000 RPM × g and 4 °C (Heraeus Multifuge 3 S-R, Fa. Thermofischer). Blood specimens were transferred into 0.5–1.0 ml sample containers with screw tops on the same day and were stored at in −80° Celsius freezers until further analysis. For the current study all consecutively registered cases until June 2014 (N = 289) and matched controls (N = 506) with blood sample were selected.
In addition, ALS patients were actively followed-up and annually interviewed. Furthermore, record linkage with the central registration office in Baden-Württemberg and the local registration offices in Bavaria were performed. In case of death the date was obtained from the local registration offices. Survival times were censored at the date of the last systematic mortality update (April 30, 2014). Since 10 ALS cases were recruited after the last mortality update, their data was excluded for the analyses of the prognostic value of the biomarkers.
Ethics Statement
International, national and state rules were followed implementing the ALS registry Swabia. We obtained full ethical approval of the ethical committees of Ulm University and the regional medical associations (“Landesärztekammer Baden-Württemberg” and “Landesärztekammer Bayern”).
Biomarker measurement
Serum leptin (ng/ml) was measured by enzyme linked immunosorbent assay (ELISA) (Qantikine®, Human Leptin Immunoassay, R&D Systems, Wiesbaden, Germany). The lower detection limit (LOD) of leptin was 0.078 ng/ml. The interassay coefficient of variation (CV) was 5.94%. Serum levels of adiponectin (µg/ml) were also determined by a commercial ELISA (Qantikine® Elisa, Human Total Adiponectin/Acrp 30 Immunoassay, R&D Systems, Wiesbaden, Germany). The LOD was 0.246 ng/ml and the interassay CV was 2.55%. Hs-CRP in serum was measured by a latex-enhanced high-sensitivity immunonephelometry assay on a Behring Nephelometer II (CardioPhase®, Siemens). The LOD was 0.17 mg/L and the CV was 3.31%. All laboratory analyses were performed in blinded fashion at the research laboratory of the Department of Internal Medicine II-Cardiology, Ulm University Medical Center.
Statistical methods
Socio-demographic, lifestyle-characteristics, medical and laboratory results, and clinical characteristics (for ALS patients) were displayed in a descriptive way. Association of selected socio-demographic and clinical variables with serum levels of leptin, adiponectin and hs-CRP were compared using generalized linear models adjusted for case-control status, sex and age in order to appraise their distribution within the covariates. We modeled the geometric mean as the distributions were skewed to the right, and were approximately normal after log-transformation. The correlations with covariates were assessed with log-transformed biomarkers for the same reason.
Conditional logistic regression models were used to investigate the association between quartiles of leptin, adiponectin and hs-CRP and ALS. In analyses, data of 269 ALS cases and 492 control subjects with full set of covariates were included. Odds ratios (OR) and 95% confidence intervals (CI) were calculated stratified by sex and age groups. Quartile cut-points were calculated based on the sex-specific distribution in controls (Supplemental Table 1). The models were adjusted for relevant covariates such as smoking, educational level, occupational work intensity, family history of ALS and BMI.
In ALS-cases, time-to-death analyses were performed using Kaplan–Meier method and Cox proportional hazard models. Hazard ratios (HRs) were calculated to assess the prognostic value of leptin, adiponectin and hs-CRP serum concentrations for overall survival. Overall survival was defined as the time between baseline visit and death. As leptin, adiponectin and hs-CRP concentrations were skewed to the right we log-transformed these variables prior to analyses. For the graphical presentation the results were back transformed. Potential confounders included sex, age, diagnostic delay, site of onset and ALS-functional rating scale (FRS) at baseline. In addition, we modeled the median survival time using a Weibull survival model applying restricted cubic splines with knots at the 5, 50 and 90% percentiles. All provided p-values are two-sided. The statistical software package SAS release 9.4 (SAS Institute, Cary, NC, USA) was used.
Results
The study sample comprised data of 289 ALS patients (59.5% men) with a mean age of 65.7 (SD 10.5) years and of 506 controls (59.5% men) with the mean age 66.3 (SD 9.8) years (Table 1). Compared to the control group, we observed in ALS patients a lower level of school education, lower smoking prevalence but higher levels of a positive family history of ALS. In relation to energy metabolism, it is noteworthy that ALS patients displayed lower BMI, and higher frequency of physical intense occupational working history. Compared to the controls median concentrations of leptin were lower in ALS patients (7.3 vs. 9.7 ng/L), while median concentrations of adiponectin and hs-CRP were higher (9.6 vs. 7.5 µg/L and 1.31 vs. 1.14 mg/L, respectively). Compared to ALS cases, higher concentrations of leptin and lower concentrations of adiponectin were found in both men and women among the control group, while for hs-CRP no difference was seen (Table 1). Most ALS-cases had a lumbar onset and the mean ALS-FRS was 39.0.
Table 1.
Main characteristics of ALS patients and control subjects.
| NCases | ALS-cases | NControls | Control subjects | |
|---|---|---|---|---|
| Age (years), mean (SD) | 289 | 65.7 (10.5) | 506 | 66.3 (9.8) |
| Sex | 289 | 506 | ||
| Male, N (%) | 172 (59.5) | 301 (59.5) | ||
| School education, N (%) | 289 | 503 | 226 (44.9) | |
| <10th grade | 161 (55.7) | 277 (55.1) | ||
| ≥10th grade | 128 (44.3) | |||
| Smoking | 286 | 505 | 244 (48.3) | |
| Ever, N (%) | 132 (46.2) | |||
| BMI (kg m−2), mean (SD) | 289 | 24.6 (4.1) | 404 | 26.5 (4.0) |
| Overweight (≥25 kg m−2), N (%) | 115 (39.8) | 303 (60.2) | ||
| Family history of ALS, N (%) | 284 | 506 | ||
| Positive | 11 (3.9) | 2 (0.4) | ||
| Occupational work intensity, N (%) | 278 | 500 | ||
| Light (mainly sitting) | 100 (36.0) | 233 (46.6) | ||
| Moderate (standing and walking) | 115 (41.1) | 203 (40.6) | ||
| Heavy (physically demanding) | 63 (22.7) | 64 (12.8) | ||
| Leptin (ng mL−1), median (Q1, Q3) | 287 | 7.3 (3.7, 13.1) | 504 | 9.7 (5.3, 19.9) |
| Adiponectin (µg mL−1), median (Q1, Q3) | 289 | 9.6 (6.2, 15.0) | 506 | 7.5 (5.2, 12.7) |
| hs-CRP (mg L−1), median (Q1, Q3) | 289 | 1.29 (0.64, 3.22) | 505 | 1.14 (0.65, 2.80) |
| Clinical characteristics In ALS cases | ||||
| Site of onset, N (%) | 289 | |||
| Bulbar | 91 (31.5) | |||
| Cervical | 73 (25.3) | |||
| Thoracic | 13 (4.5) | |||
| Lumbar | 97 (33.6) | |||
| Uncertain | 15 (5.2) | |||
| Revised El Escorial criteria, N (%) | 289 | |||
| Clinically suspected | 48 (16.6) | |||
| Clinically possible | 36 (12.5) | |||
| Clinically probable | 92 (31.8) | |||
| Clinically probable – lab. supported | 83 (28.7) | |||
| Clinically definite | 30 (10.4) | |||
| ALS-FRS, median (Q1, Q3) | 288 | 39.0 (34.0, 42.5) | ||
| Diagnostic delay (month), median (Q1, Q3) | 288 | 5.0 (2.8, 9.0) | ||
| Diagnosis to baseline visit (month), median (Q1, Q3) | 289 | 3.6 (2.1, 5.9) | ||
The comparison of various sociodemographic data with clinical characteristics and the biomarkers revealed higher values of leptin and adiponectin in women and for adiponectin and hs-CRP in participants aged 65 years and above (Supplemental Table 2). Body mass Index (BMI) ≥25 kg/m2 was associated with higher leptin, higher hs-CRP and lower adiponectin values than BMI < 25 kg/m2.
If analyses were controlled for age and sex (Fig. 1), inverse associations were observed between serum leptin concentrations and ALS. These associations were still present after further adjustment for family history of ALS, school education, occupational work intensity, smoking status, adiponectin and hs-CRP levels. Compared to the bottom quartile of leptin, the OR for risk of ALS was 0.49; (95% CI 0.29–0.80, p for trend 0.004) in the top quartile (Table 2 and Fig. 1). Additional adjustment for BMI for the association between leptin and ALS risk shifted the ORs over one, and test for trend was no longer statistically significant, indicating that leptin should be considered an intermediate factor on the causal pathway (and therefore BMI should not be included in the main model). The partial Spearman’s correlation coefficient between serum leptin concentration and BMI was 0.66 (p-value < 0.001).
Figure 1.
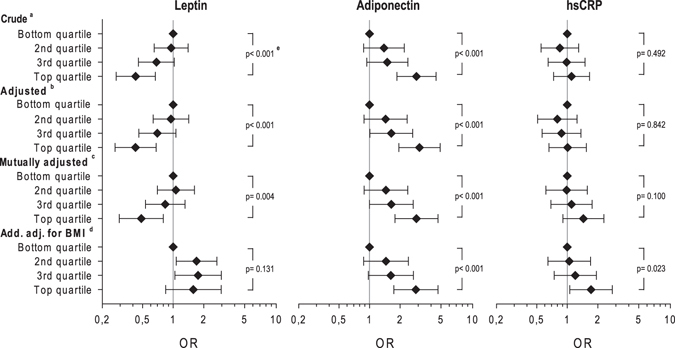
Adjusted Odds Ratios (ORs) for ALS with sex specific quartiles of leptin, adiponectin and CRP serum concentrations among 269 patients compared to respective controls. aStratified for age and sex. bAdditionally adjusted for school education, occupational work intensity, smoking (ever), family history of ALS. cas bbut mutually adjusted for leptin, adiponectin and hs-CRP. das cbut additionally adjusted for Body mass index (BMI). eP-values indicate trend over quartiles.
Table 2.
Odds ratios for ALS stratified for age, sex and adjusted for school education, occupational work intensity, smoking (ever), family history of ALS and mutually adjusted for serum concentrations of leptin, adiponectin and hs-CRP.
| Odds ratio (95%-CI) | |
|---|---|
| Leptin* (NCases = 269, NControls = 492) | |
| Bottom quartile | (ref.) 1.00 |
| 2nd quartile | 1.07 (0.70, 1.62) |
| 3rd quartile | 0.84 (0.53, 1.31) |
| Top quartile | 0.49 (0.29, 0.80) |
| p-value for trend | 0.004 |
| Adiponectin (NCases = 269, NControls = 492) | |
| Bottom quartile | (ref.) 1.00 |
| 2nd quartile | 1.45 (0.89, 2.38) |
| 3rd quartile | 1.64 (1.00, 2.69) |
| Top quartile | 2.89 (1.78, 4.68) |
| p-value for trend | <0.001 |
| hs-CRP (NCases = 269, NControls = 492) | |
| Bottom quartile | (ref.) 1.00 |
| 2nd quartile | 0.99 (0.62, 1.58) |
| 3rd quartile | 1.10 (0.69, 1.76) |
| Top quartile | 1.44 (0.91, 2.29) |
| p-value for trend | 0.100 |
*Sex-specific cut-points.
Regarding serum adiponectin, in the mutually adjusted model increased levels were associated with ALS diagnosis (vs. bottom quartile OR 2.89; 95% CI 1.78–4.68, p for trend <0.001). Further adjustment for BMI did not substantially change the estimates. For hs-CRP the mutually adjusted model revealed no statistically significant association with ALS. However, analyses further adjusted for BMI showed increased risk of ALS for the top quartile of hs-CRP.
As displayed in Table 3, 104 deaths among 279 ALS patients were identified during a median follow-up of 14.5 months. A shorter diagnostic delay and lower ALS-FRS status was evident in subjects who deceased (Table 3). The Kaplan-Meier curves by quartile showed better survival for patients with increased leptin levels, but the univariate analysis revealed no statistically significant differences in survival for all markers according to quartiles of exposure (Supplemental Figure 1). However, after adjustment for age and sex Cox proportional hazards models showed a clear inverse association between leptin levels and mortality (top versus bottom quartile HR 0.20; 95%CI 0.09–0.43; p for trend <0.001) (Fig. 2). Further adjustment for the other biomarkers and BMI revealed similar estimates. For adiponectin and hs-CRP no association with mortality was found in age and sex adjusted analyses (p for trend 0.302 and 0.965, respectively).
Table 3.
Characteristics of ALS Patients (N = 279) with mortality follow-up by survival status.
| NDeceased | Deceased (N = 104) | NSurvived | Survived (N = 175) | |
|---|---|---|---|---|
| Age (years), mean (SD) | 104 | 68.9 (10.3) | 175 | 63.9 (10.2) |
| Sex | ||||
| Male, N (%) | 104 | 56 (53.9) | 175 | 114 (65.1) |
| BMI (kg m−2), mean (SD) | 104 | 24.0 (4.2) | 175 | 24.8 (4.0) |
| Leptin (ng mL−1), median (Q1, Q3) | 104 | 7.2 (3.5, 13.3) | 173 | 7.3 (3.8, 12.3) |
| Adiponectin (µg mL−1), median (Q1, Q3) | 104 | 10.2 (7.5, 15.2) | 175 | 9.2 (5.8, 14.5) |
| Hs-CRP (mg L−1), median (Q1, Q3) | 104 | 1.64 (0.70, 3.18) | 175 | 1.17 (0.61, 3.29) |
| Diagnostic delay (month), median (Q1, Q3) | 104 | 3.0 (2.0, 6.0) | 175 | 6.0 (3.0, 9.0) |
| ALS-FRS, median (Q1, Q3) | 103 | 36 (32, 41) | 175 | 41 (37, 43) |
Figure 2.
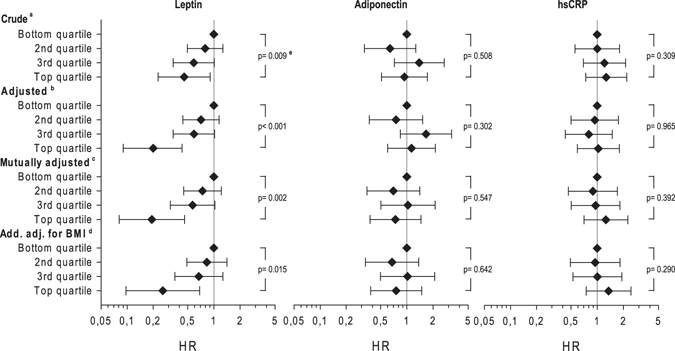
Hazard ratio for mortality by sex specific quartiles of leptin, adiponectin and hs-CRP serum concentrations among 279 ALS patients. aStratified for age and sex. badditionally adjusted for age, diagnostic delay, site of onset and ALS-FRS. cas bbut mutually adjusted for leptin, adiponectin and hsCRP. das cbut additionally adjusted for Body mass index (BMI). eP-values indicate trend over quartiles.
The prognostic value of leptin concentrations was additionally evaluated by using restricted cubic splines (Supplemental Figure 2) in order to appraise the influence on survival time by sex. Increasing leptin concentrations at baseline were positively associated with survival with a steeper slope in men than in women.
Discussion
In this population-based case-control study, leptin serum concentrations were inversely associated with the risk of ALS as well as with survival during follow-up. Adiponectin serum concentrations were positively associated with ALS risk only. These associations showed a clear dose-response relationship and persisted after adjustment for potential confounders. For hs-CRP as a marker of systemic inflammation, neither an association with ALS risk nor with survival was evident, indicating that inflammation does not play a major role.
Our observations are in line with results from clinical observations and epidemiological studies showing that BMI is associated with ALS onset and progression4. O’Reilly et al.17 in a longitudinal study found that lower pre-diagnostic BMI was associated with increased risk of ALS17. Results from the EPIC cohort suggest that increased body weight was associated with decreased ALS mortality18. Increased lifetime physical activity was found to increase ALS risk in some studies27. Though the hypothesis that high energy expenditure increases ALS risk is biologically plausible, the overall evidence for an association of the risk of ALS with physical activity is weak and it cannot be excluded that other factors such smoking or alcohol consumption have biased previous associations28. In our study more ALS patients reported history of higher occupational work intensity than controls. However, adjustment for smoking status and occupational work intensity as indicator for physical activity did not substantially influence the estimates.
High levels of adiponectin were associated with higher risk of ALS. Adiponectin has strong anti-inflammatory properties and influences insulin sensitivity and fatty acid oxidation29. Our observation of no association between adiponectin and mortality is in line with findings from a clinical trial with pioglitazone, which modulates the transcription of insulin- sensitive genes and reduces insulin resistance in peripheral tissues. In this trial the application of pioglitazone deceased glycaemia and increased circulating adiponectin in ALS patients, but did neither influence BMI nor survival30. Thus, increasing adiponectin did not appear sufficient to improve survival in patients. Hs-CRP was neither associated with onset nor with prognosis of ALS. In a case-control study including 303 ALS patients recruited in a single medical center and 2,100 population-based controls no association was found between hs-CRP and ALS12. Our observation is consistent with a large-scale Mendelian randomization study including more than 4,000 ALS cases and 8,000 controls, showing no association between CRP-related single nucleotide polymorphisms (SNPs) and ALS onset31. Hs-CRP is an established biomarker for inflammation and we observed a moderate inverse correlation with ALS-FRS (Supplemental Table 3). However, other inflammatory biomarkers such as interleukin (IL)-6, IL-2, ferritin and tumor necrosis factor (TNF) maybe more important in this context32.
Our observations are consistent with the hypothesis that impaired energy metabolism is linked to the pathogenesis of ALS4. Leptin controls energy balance and acts as a pro-inflammatory adipokine modulating also the immune system33. Physiologically blood leptin regulates appetite and thermogenesis in the central nervous system33, in coordination with multiple other factors, in particular glucose and insulin. In our study, high leptin levels were associated with lower risk of ALS onset and longer survival of ALS patients. In the univariate Cox regression models, age (inversely), sex (male favorable) and ALSFRS-R (positively) were associated with survival (Supplemental Table 4). However, further adjustment for age, gender, site of onset and change of ALSFRS-R these factors did not substantially change the risk estimates for leptin. Interestingly, additional adjustment for BMI changes the direction of the leptin and ALS onset relationship, suggesting that the relationship of leptin is indeed caused by its strong correlation with fat mass, and thus indirectly reflects the protection offered by increased energy stores. This interpretation is consistent with leptin haploinsufficiency, that triggers increased body weight, being protective in mutant SOD1 mice34. This would be also coherent with other case-control studies showing an inverse association between polyunsaturated fatty acids and risk of ALS and increased energy intake in ALS patients22, and with the results from a small randomized clinical trial suggesting that diet high in lipids may have beneficial effect on the prognosis10, 22. However, further studies are necessary to disentangle the interrelation between these factors, and determine whether leptin could have an effect per se. Indeed, besides being correlated with fat mass, leptin increases fatty acid oxidation33. Thus, it cannot be excluded that high leptin levels result in increased lipolysis contributing to better prognosis of ALS patients with high leptin levels. Last, leptin has been shown to display neuroprotective potential, and this could contribute to the observed relationship between leptin and survival in our study35. To the best of our knowledge this is the first study investigating the association of adipokines with the onset and prognosis of ALS. However, measurements of additional metabolites and (neuro-) transmitters are necessary to further elucidate ALS pathogenesis.
Strengths of our study are its large sample size with virtually complete follow-up of the ALS patients. It should be critically evaluated that the response among our control population was relatively low, however, we selected a clear population-based approach instead of selecting controls in a hospital setting and in the final analysis we carefully matched for gender, age as well as geographic region and used multivariable analysis to further adjust for potential confounders. Finally, the case-control design of the analysis on ALS onset limits the causal interpretation of the results as the biomarkers were measured after clinical diagnosis of ALS and not at or respectively before disease initiation. Nevertheless, this argument is less important for assessing the prognostic value within the prospective cohort approach of our study. Moreover all biomarkers were measured in one laboratory according to a standard protocol under blinded conditions. It could be considered as a limitation that no dietary data was available for the current analyses. However, energy dense diets are likely taken into account through adjustment with BMI. Though the recruitment of study participants in Southern Germany is well described and the epidemiological characteristics of the study population are in the range of other studies, this should be considered when generalizing the results. Although our control group had higher BMI and duration of school education, these factors were adjusted in the final analyses. In addition, since higher social status is associated with lower BMI, the associations in the case-control study could be even underestimated. When interpreting the results it should be considered that biomarker measurements were only done at a single time point and part of the association in the case-control part may represent reverse causality. Therefore, corroboration is urgently needed within a prospective study.
In summary, our case-control study showed that serum concentrations of leptin and adiponectin are associated with the risk of ALS. The additional survival analysis in ALS-cases revealed only for leptin a clear positive association with prognosis. These results suggest that ALS onset as well as prognosis appear to be related to energy homeostasis.
Electronic supplementary material
Acknowledgements
We thank the Ilona Kraft-Overbeck, Ines Dobias and Nicola Lämmle for their excellent field work, Gerlinde Trischler for her excellent technical assistance and Gertrud Feike, Sarah Enderle, Birgit Och and Torben Brehme for their excellent data management and technical support. We also thank the members of the ALS registry study group: •PD Dr. Arnold G., Klinikum Sindelfingen-Boeblingen, Department of Neurology. •Dr. Baier H., ZFP Suedwuerttemberg, Department of Epileptology. •Prof. Dr. Baezner H., Katharinenhospital Stuttgart, Department of Neurology. •Dr. Beattie J., Ostalb-Klinikum Aalen, Department of Neurology. •Dr. Behne F., ZFP Suedwuerttemberg, Department of Epileptology. •PD Dr. Bengel D., Oberschwabenklinik Ravensburg, Department of Neurology. •Dr. med. Boertlein A.,Katharinenhospital Stuttgart, Department of Neurology. •Dr. med. Bracknies, V., Department of Neurology, Dietenbronn. •Dr. Burkhard, A., Klinikum Günzburg, Department of Neurology. •Dr. med. Dempewolf, S., Department of Neurology, Ludwigsburg. •Prof. Dr. Dettmers C., Schmieder Kliniken Konstanz. •PD Dr. med. Freund, W., Praxis Biberach. •Dr. Gold H.-J., Klinikum am Gesundbrunnen Heilbronn, Department of Neurology. •Prof. Dr. med. Dr. h.c. Dipl. Psych. Hacke, W., University of Heidelberg, Department of Neurology. •PD Dr. Hecht M., Bezirkskrankenhaus Kaufbeuren, Department of Neurology. •Dr. med. Heimbach B., University of Freiburg, Department of Neurology. •Dr. med. Hendrich C., Klinikum Friedrichshafen, Department of Neurology. •PD Dr. Herting B., Diakonie-Klinikum Schwaebisch Hall, Department of Neurology. •PD Dr. med. Huber R., Klinikum Friedrichshafen, Department of Neurology. •Prof. Dr. med. Huelser P.-J., Fachklinik Wangen, Department of Neurology. •Dr. Huber-Hartmann K., Kliniken Landkreis Heidenheim, Department of Neurology. •Dr. med. Kaspar A., Oberschwabenklinik Ravensburg, Department of Neurology. •Prof. Dr. med. Kimmig H., Kliniken Schwenningen, Department of Neurology. •Priv.-Doz. Dr. Zeller D., University of Würzburg, Department of Neurology. •Prof. Dr. med. Kloetzsch C., Schmieder Kliniken Allensbach, Bodensee. •Prof. Dr. Klopstock, T., LMU München, Department of Neurology. •Dr. Kohler, A., Klinikum am Gesundbrunnen Heilbronn, Department of Neurology. •Dr. med. Schütz K., Kliniken Schwenningen, Department of Neulology. •PD Dr. med. Lichy C., Klinikum Memmingen, Department of Neurology. •Prof. Dr. Lindner A., Marienhospital Stuttgart, Department of Neurology. •Prof. Dr. Tumani H., Department of Neurology, Dietenbronn. •PD Dr. med. Maeurer M., Caritas Krankenhaus, Bad Mergentheim, Department of Neurology. •Prof. emeritus Dr. med. Meinck H. M., University of Heidelberg, Department of Neurology. •Dr. Meudt O., Klinikum Memmingen, Department of Neurology. •Dr. Meyer A., Weissenau, Department of Neurology. •Dr. Mueller vom Hagen J., Universitaetsklinikum Tuebingen, Department of Neurology. •Dr. med. Naegele A., Christophsbad Goeppingen, Department of Neurology. •Prof. Dr. Naumann M., Klinikum Augsburg, Department of Neurology and Neurophysiology. •Dr. med. Neher K.-D., Vinzenz von Paul Hospital, Rottweil, Department of Neurology. •PD Dr. Neuhaus O., Kliniken Landkreis Sigmaringen, Department of Neurology. •PD Dr. med. Neusch C., Praxis EMSA Singen. •PD Dr. Niehaus L., Department of Neurology, Winnenden. •Dr. Jüttler E., Ostalb-Klinikum Aalen, Department of Neurology. •Dr. med. Raape J., ZFP Suedwuerttemberg, Neurologie Weissenau. •Dr. med. Ratzka P., Klinikum Augsburg, Department of Neurology and Neurophysiology. •Dr. med. Rettenmayr C., Klinikum Esslingen, Department of Neurology. •Dr. Rothmeier J., ZFP Suedwuerttemberg, Neurologie Weissenau. •Dr. med. Sabolek M., Department of Neurology, Biberach. •Prof. Schabet M., Department of Neurology, Ludwigsburg. •Dr. med. Schaeff-Vogelsang M., Diakonie-Klinikum Schwaebisch Hall, Department of Neurology. •Prof. Dr. Schoels L., Universitaetsklinikum Tuebingen, Department of Neurology. •Dr. med. Schweigert B., Caritas Krankenhaus, Bad Mergentheim, Department of Neurology. •Prof. Dr. Sommer N., Christophsbad Goeppingen, Department of Neurology. •Dr. med. Reinhard M., Kliniken Esslingen, Department of Neurology. •Dr. med. Stroick M., Klinikum Memmingen, Department of Neurology. •Dr. med. Trottenberg T., Department of Neurology, Winnenden. •PD Dr. Metrikat J., Bundeswehrkrankenhaus Ulm, Department of Neurology. •Dr. med. Weiler M., University of Heidelberg, Department of Neuology. •Priv.-Doz. Dr. Wessig C., University of Wuerzburg, Department of Neurology. •Prof. Dr. Hamann G., Klinikum Guenzburg, Department of Neurology. •Dr. med. Bublitz S., TU Muenchen, Department of Neurology. •PD Dr. med. Kern, Klinikum Kempten, Department of Neurology. •Dr. med. Andres, Kreiskliniken Reutlingen, Department of Neurology. •PD Dr. med. Dorothee Lulé, Ulm university, Department of Neurology. Funding: The ALS registry Swabia and this study have been supported by the German Research Council (DFG, main number 577 631).
Author Contributions
A.C.L., D.R., G.N. conventionalized the study, A.C.L., A.R., G.N., R.S.P., were involved in the data collection, W.K. was responsible for biomarker measurements, D.R., G.N., R.S.P. analyzed the data, all authors were involved in the interpretation of the data, G.N. drafted and revised the manuscript, all authors were involved in the draft and revision of the manuscript. All authors had full access to the data and take the responsibility for the integrity of the data and the accuracy of the data analysis.
Competing Interests
Dr. Rothenbacher reports personal fees from MEDA Pharma, personal fees from Novartis Pharma, personal fees from Roche Pharma, outside the submitted work. Dr. Koenig reports personal fees from AstraZeneca, personal fees from Novartis, personal fees from MSD, personal fees from Amgen, personal fees from Sanofi, personal fees from Berlin-Chemie, personal fees from The Medicines Company, personal fees from GSK, personal fees from Pfizer, grants and non-financial support from Abbott, Roche DIagnostics, Beckmann, Singulex, personal fees from Actavis, outside the submitted work. Dr. Dupuis, Dr. Nagel and Mr. Peter have nothing to disclose.
Footnotes
Electronic supplementary material
Supplementary information accompanies this paper at doi:10.1038/s41598-017-04706-5
Publisher's note: Springer Nature remains neutral with regard to jurisdictional claims in published maps and institutional affiliations.
References
- 1.Kiernan MC, et al. Amyotrophic lateral sclerosis. Lancet. 2011;377:942–955. doi: 10.1016/S0140-6736(10)61156-7. [DOI] [PubMed] [Google Scholar]
- 2.Ludolph AC, Brettschneider J, Weishaupt JH. Amyotrophic lateral sclerosis. Curr. Opin. Neurol. 2012;25:530–535. doi: 10.1097/WCO.0b013e328356d328. [DOI] [PubMed] [Google Scholar]
- 3.Uenal H, et al. Incidence and Geographical Variation of Amyotrophic Lateral Sclerosis (ALS) in Southern Germany – Completeness of the ALS Registry Swabia. PLoS ONE. 2014;9:e93932. doi: 10.1371/journal.pone.0093932. [DOI] [PMC free article] [PubMed] [Google Scholar]
- 4.Dupuis L, Pradat P-F, Ludolph AC, Loeffler J-P. Energy metabolism in amyotrophic lateral sclerosis. The Lancet Neurology. 2011;10:75–82. doi: 10.1016/S1474-4422(10)70224-6. [DOI] [PubMed] [Google Scholar]
- 5.Desport JC, et al. Nutritional status is a prognostic factor for survival in ALS patients. Neurology. 1999;53:1059–1063. doi: 10.1212/WNL.53.5.1059. [DOI] [PubMed] [Google Scholar]
- 6.Jawaid A, et al. A decrease in body mass index is associated with faster progression of motor symptoms and shorter survival in ALS. Amyotroph Lateral Scler. 2010;11:542–548. doi: 10.3109/17482968.2010.482592. [DOI] [PubMed] [Google Scholar]
- 7.Paganoni S, Deng J, Jaffa M, Cudkowicz ME, Wills A-M. Body mass index, not dyslipidemia, is an independent predictor of survival in amyotrophic lateral sclerosis. Muscle Nerve. 2011;44:20–24. doi: 10.1002/mus.22114. [DOI] [PMC free article] [PubMed] [Google Scholar]
- 8.Vu LT, Bowser R. Fluid-Based Biomarkers for Amyotrophic Lateral Sclerosis. Neurotherapeutics. 2017;14:119–134. doi: 10.1007/s13311-016-0503-x. [DOI] [PMC free article] [PubMed] [Google Scholar]
- 9.Dupuis L, et al. Dyslipidemia is a protective factor in amyotrophic lateral sclerosis. Neurology. 2008;70:1004–1009. doi: 10.1212/01.wnl.0000285080.70324.27. [DOI] [PubMed] [Google Scholar]
- 10.Dorst J, et al. Patients with elevated triglyceride and cholesterol serum levels have a prolonged survival in amyotrophic lateral sclerosis. J. Neurol. 2011;258:613–617. doi: 10.1007/s00415-010-5805-z. [DOI] [PubMed] [Google Scholar]
- 11.Lindauer E, et al. Adipose Tissue Distribution Predicts Survival in Amyotrophic Lateral Sclerosis. PLoS ONE. 2013;8:e67783. doi: 10.1371/journal.pone.0067783. [DOI] [PMC free article] [PubMed] [Google Scholar]
- 12.Sutedja NA, et al. Beneficial vascular risk profile is associated with amyotrophic lateral sclerosis. J. Neurol. Neurosurg. Psychiatr. 2011;82:638–642. doi: 10.1136/jnnp.2010.236752. [DOI] [PubMed] [Google Scholar]
- 13.Turner MR, Wotton C, Talbot K, Goldacre MJ. Cardiovascular fitness as a risk factor for amyotrophic lateral sclerosis: indirect evidence from record linkage study. J. Neurol. Neurosurg. Psychiatr. 2012;83:395–398. doi: 10.1136/jnnp-2011-301161. [DOI] [PubMed] [Google Scholar]
- 14.Lawton KA, et al. Plasma metabolomic biomarker panel to distinguish patients with amyotrophic lateral sclerosis from disease mimics. Amyotroph Lateral Scler Frontotemporal Degener. 2014;15:362–370. doi: 10.3109/21678421.2014.908311. [DOI] [PubMed] [Google Scholar]
- 15.Jawaid A, et al. ALS disease onset may occur later in patients with pre-morbid diabetes mellitus. European Journal of Neurology. 2010;17:733–739. doi: 10.1111/j.1468-1331.2009.02923.x. [DOI] [PubMed] [Google Scholar]
- 16.Paganoni S, et al. Pre-morbid type 2 diabetes mellitus is not a prognostic factor in amyotrophic lateral sclerosis. Muscle Nerve. 2015;52:339–343. doi: 10.1002/mus.24688. [DOI] [PMC free article] [PubMed] [Google Scholar]
- 17.O’Reilly ÉJ, et al. Premorbid body mass index and risk of amyotrophic lateral sclerosis. Amyotroph Lateral Scler Frontotemporal Degener. 2013;14:205–211. doi: 10.3109/21678421.2012.735240. [DOI] [PMC free article] [PubMed] [Google Scholar]
- 18.Gallo V, et al. Prediagnostic body fat and risk of death from amyotrophic lateral sclerosis: the EPIC cohort. Neurology. 2013;80:829–838. doi: 10.1212/WNL.0b013e3182840689. [DOI] [PMC free article] [PubMed] [Google Scholar]
- 19.Kioumourtzoglou M-A, et al. Diabetes Mellitus, Obesity, and Diagnosis of Amyotrophic Lateral Sclerosis: A Population-Based Study. JAMA Neurol. 2015;72:905–911. doi: 10.1001/jamaneurol.2015.0910. [DOI] [PMC free article] [PubMed] [Google Scholar]
- 20.Mariosa D, Kamel F, Bellocco R, Ye W, Fang F. Association between diabetes and amyotrophic lateral sclerosis in Sweden. Eur. J. Neurol. 2015;22:1436–1442. doi: 10.1111/ene.12632. [DOI] [PMC free article] [PubMed] [Google Scholar]
- 21.Dupuis L, Oudart H, René F, Gonzalez de Aguilar J-L, Loeffler J-P. Evidence for defective energy homeostasis in amyotrophic lateral sclerosis: benefit of a high-energy diet in a transgenic mouse model. Proc. Natl. Acad. Sci. USA. 2004;101:11159–11164. doi: 10.1073/pnas.0402026101. [DOI] [PMC free article] [PubMed] [Google Scholar]
- 22.Wills A-M, et al. Hypercaloric enteral nutrition in patients with amyotrophic lateral sclerosis: a randomised, double-blind, placebo-controlled phase 2 trial. Lancet. 2014;383:2065–2072. doi: 10.1016/S0140-6736(14)60222-1. [DOI] [PMC free article] [PubMed] [Google Scholar]
- 23.Fasshauer M, Blüher M. Adipokines in health and disease. Trends Pharmacol. Sci. 2015;36:461–470. doi: 10.1016/j.tips.2015.04.014. [DOI] [PubMed] [Google Scholar]
- 24.Nagel G, Ünal H, Rosenbohm A, Ludolph AC, Rothenbacher D. Implementation of a population-based epidemiological rare disease registry: study protocol of the amyotrophic lateral sclerosis (ALS) - registry Swabia. BMC Neurol. 2013;13:22. doi: 10.1186/1471-2377-13-22. [DOI] [PMC free article] [PubMed] [Google Scholar]
- 25.Rosenbohm, A. & Peter, R. et al. Amyotrophic Lateral Sclerosis in an Aging Society: Current and Future Clinical Characteristics. J Neuro (2017).
- 26.Brooks BR. Versailles minimal dataset for diagnosis of ALS: a distillate of the 2nd Consensus Conference on accelerating the diagnosis of ALS. Versailles 2nd Consensus Conference participants. Amyotroph. Lateral Scler. Other Motor Neuron Disord. 2000;1(Suppl 1):S79–81. doi: 10.1080/14660820050515629. [DOI] [PubMed] [Google Scholar]
- 27.Huisman MHB, et al. Lifetime physical activity and the risk of amyotrophic lateral sclerosis. J Neurol Neurosurg Psychiatry. 2013;84:976–981. doi: 10.1136/jnnp-2012-304724. [DOI] [PubMed] [Google Scholar]
- 28.Hamidou B, et al. Epidemiological evidence that physical activity is not a risk factor for ALS. Eur. J. Epidemiol. 2014;29:459–475. doi: 10.1007/s10654-014-9923-2. [DOI] [PubMed] [Google Scholar]
- 29.Aguilar-Valles A, Inoue W, Rummel C, Luheshi GN. Obesity, adipokines and neuroinflammation. Neuropharmacology. 2015;96:124–134. doi: 10.1016/j.neuropharm.2014.12.023. [DOI] [PubMed] [Google Scholar]
- 30.Vercruysse P, et al. Alterations in the hypothalamic melanocortin pathway in amyotrophic lateral sclerosis. Brain. 2016;139:1106–1122. doi: 10.1093/brain/aww004. [DOI] [PubMed] [Google Scholar]
- 31.Prins BP, et al. Investigating the Causal Relationship of C-Reactive Protein with 32 Complex Somatic and Psychiatric Outcomes: A Large-Scale Cross-Consortium Mendelian Randomization Study. PLoS Med. 2016;13:e1001976. doi: 10.1371/journal.pmed.1001976. [DOI] [PMC free article] [PubMed] [Google Scholar]
- 32.Lu C-H, et al. Systemic inflammatory response and neuromuscular involvement in amyotrophic lateral sclerosis. Neurol Neuroimmunol Neuroinflamm. 2016;3:e244. doi: 10.1212/NXI.0000000000000244. [DOI] [PMC free article] [PubMed] [Google Scholar]
- 33.Morton GJ, Meek TH, Schwartz MW. Neurobiology of food intake in health and disease. Nat. Rev. Neurosci. 2014;15:367–378. doi: 10.1038/nrn3745. [DOI] [PMC free article] [PubMed] [Google Scholar]
- 34.Lim MA, et al. Genetically altering organismal metabolism by leptin-deficiency benefits a mouse model of amyotrophic lateral sclerosis. Hum. Mol. Genet. 2014;23:4995–5008. doi: 10.1093/hmg/ddu214. [DOI] [PMC free article] [PubMed] [Google Scholar]
- 35.Davis C, Mudd J, Hawkins M. Neuroprotective effects of leptin in the context of obesity and metabolic disorders. Neurobiol. Dis. 2014;72(Pt A):61–71. doi: 10.1016/j.nbd.2014.04.012. [DOI] [PubMed] [Google Scholar]
Associated Data
This section collects any data citations, data availability statements, or supplementary materials included in this article.