

Abstract
Obesity is a genetically heterogeneous disorder. Using targeted and whole-exome sequencing, we studied 32 human and 87 rodent obesity genes in 2,548 severely obese children and 1,117 controls. We identified 52 variants contributing to obesity in 2% of cases including multiple novel variants in GNAS, which were sometimes found with accelerated growth rather than short stature as described previously. Nominally significant associations were found for rare functional variants in BBS1, BBS9, GNAS, MKKS, CLOCK and ANGPTL6. The p.S284X variant in ANGPTL6 drives the association signal (rs201622589, MAF~0.1%, odds ratio = 10.13, p-value = 0.042) and results in complete loss of secretion in cells. Further analysis including additional case-control studies and population controls (N = 260,642) did not support association of this variant with obesity (odds ratio = 2.34, p-value = 2.59 × 10⁻³), highlighting the challenges of testing rare variant associations and the need for very large sample sizes. Further validation in cohorts with severe obesity and engineering the variants in model organisms will be needed to explore whether human variants in ANGPTL6 and other genes that lead to obesity when deleted in mice, do contribute to obesity. Such studies may yield druggable targets for weight loss therapies.
Introduction
Studies focused on severe early onset obesity alone, or obesity with developmental delay and/or dysmorphic features have identified a number of genes harbouring highly penetrant causal mutations1, 2. The further characterisation of rare, highly penetrant variants identified in such individuals can provide insights into the cellular and physiological mechanisms involved in energy homeostasis and human obesity, and can identify and/or validate targets for therapeutic intervention. The aim of our study was to examine the prevalence of rare/novel variants in human and mouse obesity genes using high-throughput next-generation sequencing in a large cohort of individuals with severe early onset obesity. Here we describe results from an analysis of 119 candidate genes sequenced in 2,548 individuals with severe, early-onset obesity from the Severe Childhood Onset Obesity Project (SCOOP)3 (UK individuals of European ancestry recruited to the Genetics of Obesity Study, GOOS; BMI standard deviation score (SDS) > 3; onset of obesity before the age of 10 years; Methods) from the UK10K project4. Our analysis includes 737 SCOOP individuals with whole-exome sequence, and 1,811 additional SCOOP individuals, not consented for whole-exome analysis, in whom we performed targeted sequencing. As this work was performed as part of a consortium (UK10K project), this data was compared to 1,117 individuals with other disorders (e.g. neurodevelopmental and rare disease) in whom exome sequencing and analysis were performed using the same methods. For the purposes of this analysis, these individuals are designated as “controls” (Methods), although we recognise that there are limitations with this design.
Study Design
SCOOP individuals likely to have congenital leptin deficiency, a treatable cause of severe obesity, were excluded by measurement of serum leptin, and individuals with mutations in the melanocortin 4 receptor gene (MC4R) (the most common genetic form of penetrant obesity) were excluded by prior Sanger sequencing.
We focused on six tiers of genes (Methods and Supplementary Table 1): (1) genes known to harbour variants causing human obesity alone (Obesity Alone; n = 6); (2) genes in which known variants cause human obesity combined with developmental delay and/or dysmorphology (Obesity and Delay; n = 26); (3) genes in which loss-of-function leads to obesity in mice (LoF Mice; n = 51); (4) genes in which gain-of-function leads to obesity in mice (GoF Mice, n = 5); (5) genes encoding anorectic peptides and their receptors (Anorectic Molecules, n = 7), and (6) genes in which loss-of-function is associated with other metabolic phenotypes in mice (Complex Metabolic Effects, n = 24). Our aim was to include genes where there was sufficient evidence to indicate disorders with Mendelian inheritance (obesity syndromes) or where complete deletion or overexpression (as opposed to conditional knockouts) causes an obesity phenotype in mice (Methods) (i.e. genes in which inherited loss/gain of function variants might exist). To identify variants more likely to be causally linked to obesity, we focused on rare (MAF < 1%) and novel (not seen in the data we used for filtering) variants predicted to be functional (i.e. nonsense variants, missense amino acid substitutions, alterations of conserved splice sites or small insertions/deletions (indels) that introduced a frameshift) (Methods). We filtered our data against approximately 8,000 publicly available sequenced samples, as well as 2,097 exomes (sequenced in parallel on the same platform as our samples) and 3,781 whole-genome sequenced samples also from the UK10K project (Methods).
Human Obesity Syndrome Genes
Firstly, we sought to identify rare and novel functional variants in the 32 genes known to cause human obesity, with or without, additional developmental delay and/or dysmorphology features (Obesity Alone, or Obesity and Delay) (Methods). We identified 11 rare potentially functional variants in ClinVar with pathogenic/likely pathogenic status and 321 novel functional variants, which we confirmed by Sanger sequencing (Fig. 1, Methods). Based on inheritance patterns (where available) and the functional properties of variants that have previously been characterised, variants in these genes may contribute to obesity, sometimes in a non-fully penetrant manner, in 52 (2%) individuals (Supplementary Figure 1 & Supplementary Table 2; Fig. 2, Methods). As variants in MC4R account for approximately 5% of severe obesity in this cohort5, these findings indicate that > 90% of patients within this cohort do not have their phenotype explained by variants in known human obesity genes. Further analysis exploring the whole-exome in an agnostic manner, with appropriately matched non-disease controls not available in the UK10K project, will be an aim of future investigations.
Figure 1.
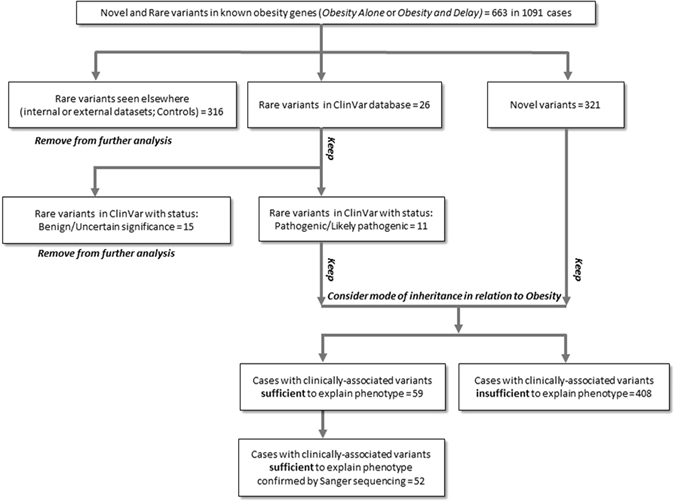
Identification of clinically-associated variants in known human obesity genes. Schematic outlining the analysis strategy.
Figure 2.
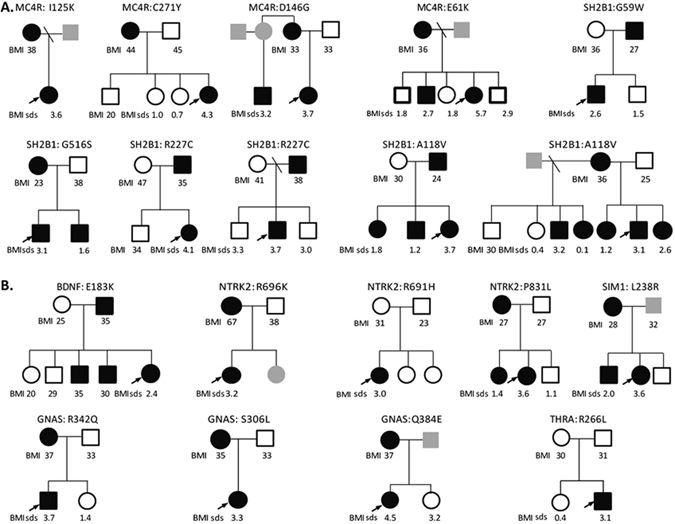
Pedigrees of patients with clinically associated variants contributing to obesity Co-segregation of variants is shown where male (squares) and female (circles) family members consented to genotyping. Heterozygous (filled) and wild-type (empty) mutation carriers are indicated; in some cases, individuals were not available for genotyping (grey). Body mass index (BMI) (>27 kg/m2 = overweight;>30 kg/m2 = obesity) for adults and BMI standard deviation scores (BMI sds) for children are shown where data was available. (A) Obesity alone; (B) Obesity and Delay. MC4R mutations were excluded by prior Sanger sequencing of all individuals undergoing whole exome sequencing and the majority (1744/1811) of individuals undergoing targeted resequencing. The finding of four MC4R mutations in the remaining 82 individuals is in keeping with the prevalence of heterozygous MC4R mutations in this cohort as reported previously5.
Notably, we identified thirteen clinically associated GNAS variants in fourteen SCOOP individuals (12 of these confirmed on Sanger sequencing; 0.5%) (Supplementary Table 3). GNAS is an imprinted gene in which heterozygous loss-of-function variants are associated with obesity, short stature and skeletal abnormalities, and, when maternally inherited, hormone resistance syndromes6. As GNAS sequencing has traditionally only been performed in individuals with classical clinical features, our findings suggest that the true prevalence in childhood obesity may be underappreciated. Three of the variants found in our study have been described previously in patients with classical features (p.Y163X7; p.R258W8, and p.R265H9). We identified a novel nonsense variant (p.Y169X) predicted to remove the entire Ras-like GTPase domain and several missense variants predicted to affect downstream signalling by affecting the interaction with G-protein coupled receptors (GPCRs), G-protein β- and γ-subunits, or downstream adenylyl cyclase when mapped onto the protein structure of GNAS (Fig. 3). We confirmed maternal transmission of variants in three out of the five families where parental samples were available for genotyping. Although four GNAS variant carriers exhibited endocrinopathies and nine had developmental delay as anticipated, unexpectedly four individuals had accelerated linear growth in childhood (height SDS > 2) rather than short stature (defined as height sds < 2.0) (Supplementary Table 3). Further molecular and physiological studies will be needed to investigate potential genotype-phenotype correlations. As studies in rodents have shown that Gnas is imprinted in the paraventricular nucleus of the hypothalamus10, the location of the majority of neurons expressing the G-protein coupled receptor MC4R, it is plausible to hypothesize that some GNAS variants may contribute to obesity and accelerated linear growth by reducing melanocortin signalling.
Figure 3.
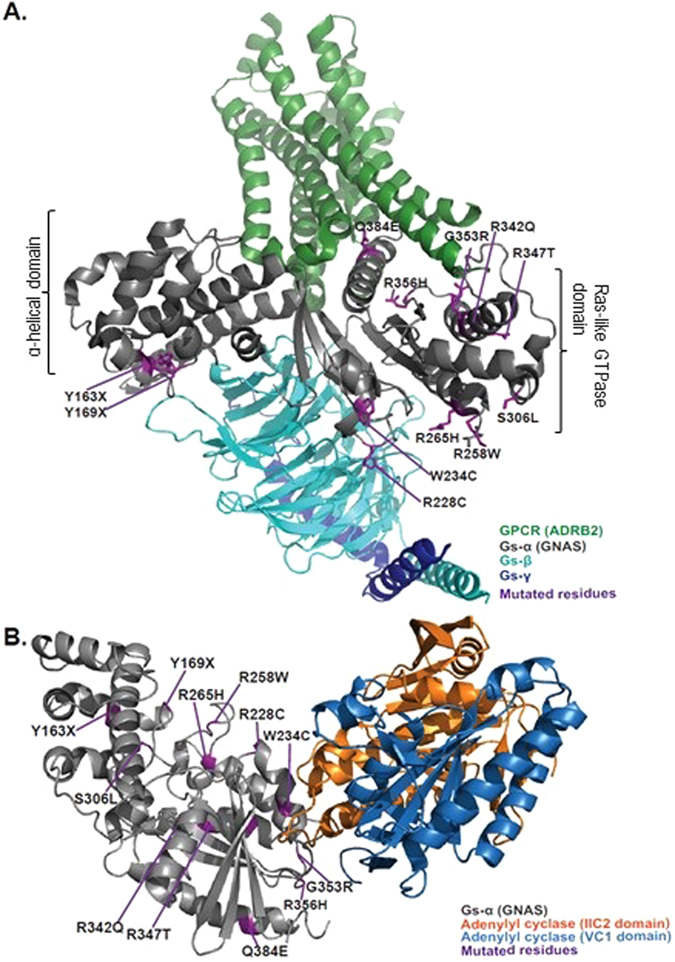
Structural model of variants identified in GNAS. (A) Structure of the active state ternary protein complex of G-protein coupled receptor (GPCR) beta 2-adrenergic receptor (ADRB2), and the nucleotide-free Gs heterotrimer, composed of Gs-α(GNAS), Gs-β, and Gs-γ subunits (based on Rasmussen et al.20, pdb file: 3sn6). The two major domains of GNAS are noted, α-helical domain and Ras-like GTPase domain. The principal interactions between GNAS and GPCRs involve the amino- and carboxy-terminal α-helices. The Ras-like GTPase domain contains most of the catalytic residues necessary for GTP hydrolysis, as well as the Gβγ and effector binding regions (switch regions I, II and III), which change confirmation upon binding to GTP or GDP). (B) Structure of the complex of Gs-alpha with the catalytic domains of mammalian adenylyl cyclase (based on Tesmer et al.21, pdb file: 1azs). Variant residues (purple), and the different components of the complex are highlighted.
Next we formally tested for enrichment of rare, or novel, functional variants in case-control analysis11 (Methods). Although no gene attained experiment-wide threshold of p-value < 2 × 10⁻⁴ (Methods and Supplementary Tables 4–9), four genes (BBS1, BBS9, GNAS, and MKKS) known to cause obesity and developmental delay and/or dysmorphology (Obesity and Delay) had nominally significant burden test p-values (p-value < 0.05) and a higher burden of variants in cases than controls (Table 1).
Table 1.
Summary of case-control results.
| Gene | Tier | # Variants | Rare alleles in SCOOP TS (N = 1,811) | Rare alleles in SCOOP WES (N = 737) | Rare alleles in Control WES (N = 1,117) | OR | Adjusted OR | p-value SKATO | p-value BURDEN | |
|---|---|---|---|---|---|---|---|---|---|---|
| Rare Functional | ||||||||||
| BBS1 | Obesity and Delay | 18 | 36 | 18 | 10 | 2.368 | 0.022 | 0.018 | ||
| BBS9 | Obesity and Delay | 20 | 24 | 5 | 5 | 2.543 | 0.081 | 0.045 | ||
| GNAS | Obesity and Delay | 14 | 12 | 4 | 0 | Inf | 14.505 | 0.015 | 0.008 | |
| MKKS | Obesity and Delay | 19 | 90 | 25 | 28 | 1.801 | 0.006 | 0.007 | ||
| ANGPTL6 | Mouse LOF | 12 | 18 | 10 | 4 | 3.073 | 0.043 | 0.027 | ||
| Novel Functional | ||||||||||
| GNAS | Obesity and Delay | 13 | 11 | 4 | 0 | Inf | 13.629 | 0.019 | 0.010 | |
| CLOCK | Mouse LOF | 9 | 8 | 2 | 0 | Inf | 9.208 | 0.066 | 0.036 | |
Summary of case-control results in genes with nominally significant (p-value < 0.05, bold) burden of Rare (top) or Novel (bottom) functional variants in SCOOP cases (N = 1,811 with targeted sequence and N = 737 with whole-exome sequence), compared to 1,117 controls with whole-exome sequence data from the UK10K project. The number of variants (# variants) per gene are shown, as well as the number of alleles in cases and controls, odds ratios (OR) and p-values from SKAT-O (p-value SKATO) and from burden tests (p-value BURDEN). For variants not detected in controls an adjusted odds ratio (Adjusted OR) was calculated by adding 0.5 to the number of alleles in each cell of the two-by-two table.
Mouse Obesity Genes
We found a higher burden of rare variants in cases than controls for two genes known to cause obesity when disrupted in mice - ANGPTL6 and CLOCK (Table 1). Testing the functional consequences of CLOCK variants in cells is not straightforward as the molecular mechanisms that lead to obesity are not fully understood. As such, we focused on verifying the accuracy of the computationally predicted function of all twelve rare ANGPTL6 variants (Methods, Fig. 4, Supplementary Table 10). All variants found in cases (but not the one variant found exclusively in controls, V143L) were predicted to affect the fibrinogen-like domain of the protein (Fig. 4a). ANGPTL6 is predominantly expressed in the liver but is also expressed in white adipose tissue and kidney. To evaluate the effect of these variants, HEK293 cells were transiently transfected with constructs encoding wild type and variant forms of ANGPTL6. Whereas wild-type ANGPTL6 was readily detected in the medium, several mutants reduced, and the S286X mutant abolished, secretion of ANGPTL6 (Fig. 4b). Incorporation of this functional information did not qualitatively change the results of the ANGPTL6 gene-based test (Supplementary Table 10). However, limiting the analysis to the single variant that completely abolished protein secretion (p.S286X, rs201622589) led to an adjusted OR = 10.13 and p-value = 0.028 (Fisher’s p-value = 0.041) suggesting that the association signal at this gene is primarily driven by this variant (Supplementary Table 10). To increase power, and given that there were no additional cases of European descent from our obesity cohort, we analysed existing exome-chip data from an additional 253,587 unrelated European, non-Finnish population controls (Methods, Supplementary Table 11). In an updated analysis with the 2,548 cases and 253,587 controls, we observed an odds ratio (OR) = 2.90 and a Fisher’s p-value = 0.0022, which did not reach experiment or exome-wide significance. Further analysis of 1,436 non-overlapping obesity cases and 1,954 non-overlapping controls from two studies did not lend additional support, and when combined with the original data, yielded an overall OR = 2.34 and chi-squared p-value = 0.0060 (total 3,984 cases vs 256,658 controls, Supplementary Table 11). The results are similar when limiting to non-obese controls (Supplementary Table 12). These findings highlight the difficulty in studying very rare variants in complex diseases, and potentially the effect of winner’s curse, reinforcing the need for extremely large sample sizes12. Of interest, mice with targeted deletion of Angptl6 that survive to birth (20%) develop marked obesity, have increased food intake, reduced energy expenditure, exhibit lipid accumulation in liver and muscle, and develop insulin resistance13. Conversely, mice with targeted overexpression of Angptl6 are lean, insulin sensitive and are protected from diet-induced obesity13. As ANGPTL6 is a liver-derived circulating peptide, and thus could potentially be manipulated for therapeutic purposes14, further genetic studies in larger cohorts and experimental studies in mice and humans are necessary to explore its role in obesity and potential utility as an anti-obesity drug target.
Figure 4.
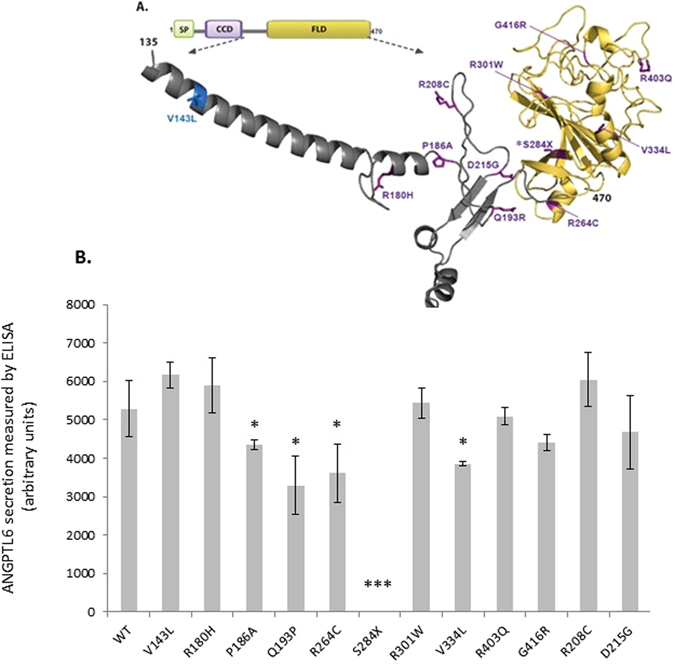
Functional characterisation of ANGPTL6 variants location and functional effect (A) Human ANGPTL6 protein and location of the genetic variants. Schematic of the human ANGPTL6 protein with the three recognisable domains: signal peptide (SP) in green, coiled-coil domain (CCD) in purple, and fibrinogen-like domain (FLD) in yellow. As all genetic variants identified are located predominantly in the FLD, the partial tertiary structure of the C-terminal protein portion (amino acids 135–470), based on previously solved fibrinogen structure (1lwu) is presented. The single variant seen in controls only is shown in blue, variants identified in cases are in purple, the S284X variant is starred. (B) Functional characterisation of ANGPTL6 variants. Cells were transiently transfected with constructs encoding wild-type (WT) or mutant ANGPTL6; levels of protein secretion into the media were measured by ELISA; means+/− standard deviation (SD) for experiments performed in triplicate are shown (results were confirmed by Western blotting; data not shown). Statistical significance was measured using unpaired T-test with Welch’s correction using the GraphPad Prism software. *p < 0.05; ***p < 0.001.
Power and Gene Set Analysis
Assuming an experiment-wide significance level of 2 × 10⁻⁴ and that 30% of rare (MAF < 1%) variants within a given gene are causal we have very limited power (~20%) to detect an association to a gene region using our sample of 2,548 cases and 1,117 controls (Supplementary Figure 2, Online Methods, Supplementary Note 4)12. As there is evidence that looking across group of genes with stronger priors may increase power15–17, we tested for association of rare or novel functional variants within each of the six candidate gene sets. We further filtered variants with respect to their likelihood of being deleterious and performed six nested tests for each gene set (Methods). Although none of the analyses of tiered gene sets reached experiment-wide significance (Supplementary Table 13, Fig. 5), we see an increase in OR as we focus on rarer variants with more evidence of predicted deleterious effect within the Obesity Alone gene set. This suggests that focusing on extremely rare variants with strong evidence of being deleterious may be a good strategy for diseases with a complex genetic architecture, which likely includes rare, highly penetrant alleles. Our power analyses also suggests that restricting the MAF threshold to be near the very rare allele frequency of that expected for the causal variants, rather than a more lenient MAF threshold of 1%, increases power (Supplementary Figure 3). Finally, there are nominally significant signals (p-value < 0.05) within the LoF Mice candidate gene set for the novel, functional variant tests suggesting that within this rather large gene set (n = 51) there may be additional genes associated with human early onset obesity (Fig. 5).
Figure 5.
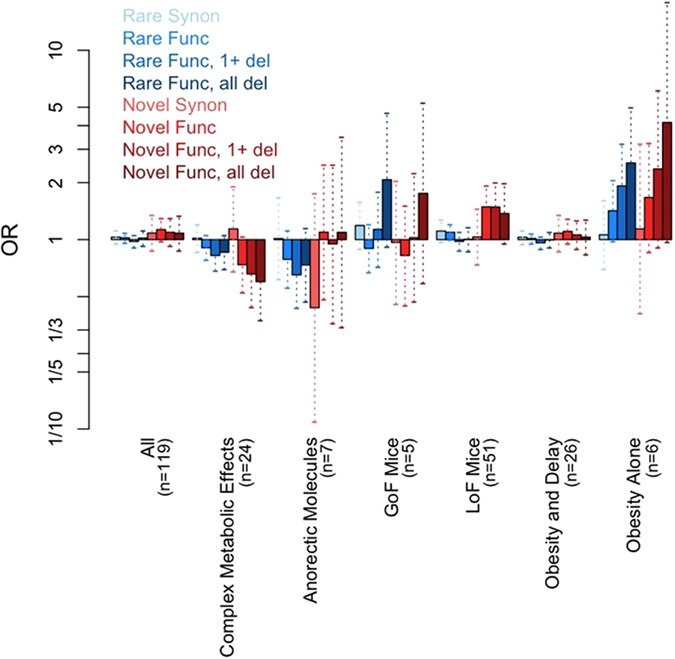
Tiered analysis of obesity candidate genes sets. ORs (bars) and 95% (dotted vertical lines) confidence intervals for each of the six gene tiers and across all 119 genes combined each for eight different filtering scenarios by MAF (Rare or Novel) and functional prediction (synonymous - Synon, functional - Func, functional with at least 1 deleterious consequence prediction – Func, 1 + del, and functional with all deleterious consequence predictions - Func, all del).
Discussion
In summary, analysis of sequence data in 119 genes across 2,548 severely obese children and 1,117 other disease controls from the UK10K project identified variants in known obesity genes, contributing to obesity in 2% of children within this cohort, in whom mutations in MC4R and leptin had been excluded. It also highlighted that GNAS mutations may be more prevalent in human obesity than previously thought, and that the spectrum of phenotypic consequences may be broader and more heterogeneous than previously described (6). Additional detailed genotype-phenotype studies will be required to further elucidate the molecular underpinnings of the physiological consequences of these variants.
Taking the information generated in this study together with the published literature, we suggest that molecular genetic investigations, including testing known obesity genes, or agnostic exome-wide or genome-wide approaches (as these become more established at the point of care), should become part of the assessment for a child presenting with severe obesity (BMI SDS > 3) in the absence of other syndromic features. Genetic studies can allow the identification of congenital leptin deficiency which is entirely treatable with recombinant leptin therapy18. Also, early reports suggest that patients with mutations that disrupt POMC signalling may be effectively treated with Setmelanotide (a MC4R agonist)19. Finally, our data suggest that focusing on very rare, deleterious variants may increase power to find genetic association. Further detailed investigation of genes that lead to obesity when deleted in mice may identify new pathophysiological mechanisms involved in human obesity that can be targeted for drug discovery.
Methods
Sample Sets
All studies were approved by the Cambridge Local Research Ethics Committee and all participants and their parents gave written informed consent. All methods were performed in accordance with the relevant laboratory/clinical guidelines and regulations.
The SCOOP cohort3 was studied as part of the UK10K consortium4. Data was compared to subsets within the neurodevelopmental and rare disease groups that were consented for use as controls. Details and further information about the UK10K project can be found at http://www.uk10k.org/ and in the UK10K consortium paper from 20154.
We gathered the genotypes for the variant S284X (rs201622589) in 202,981 unrelated population controls with European non-Finnish ancestry from existing cohorts (UKHLS22, Fenland, EPIC Norfolk23, CCHS24–26, CGPS24–26, CIHDS24–26, EPIC-CVD27, UK Biobank28 and ExAC29) and in two additional studies of obese children and healthy or thin controls30, 31 including one from the Leipzig Childhood Obesity Cohort32. (Supplementary Note 1)
Sequencing, Variant Calling, and Quality Control
Targeted Sequencing (TS) and Whole Exome Sequencing (WES) was performed as described elsewhere (refs 33 and 4 respectively). All UK10K WES samples from all arms of the exome study available at the time of the variant calling and SCOOP TS samples (N = 5,233 and 2,819 respectively) were called together on the non-redundant targets + /− 100 bp using multi-sample calling. Using SAMtools34, a BCF file was created and the site genotype likelihoods were calculated. Variants (SNPs and Indels) were called using BCFtools. Indels were left-aligned using ‘vcf norm’ from the htslib package. Variants were filtered for sequencing and genotype quality at the site and genotype level using vcf-annotate 35. Additional details in Supplementary Note 2.
Variant Annotation
All variant annotation was applied using the GRCh37 human reference. Variants were annotated with rsIDs from dbSNP 137, and allele frequencies from the final 1000Genomes Phase 1 integrated (v3) callset36, the NHLBI Exome Sequencing Project (ESP) v237, and the UK10K WGS sample set4. The Ensembl Variant Effect Predictor (http://www.ensembl.org/info/docs/variation/vep/index.html)38 v2.8 with Ensembl 66 was used to add variant consequence annotations including the predicted deleteriousness of each missense variant as predicted by SIFT39, 40, PolyPhen41, 42, and Condel43. For the 32 known human obesity genes, only the variant consequences on the most clinically relevant transcript were considered for further analysis. For the other 87 candidate obesity genes, the most severe consequence on any transcript was retained for each variant (Supplementary Table 1). Using Sequence Ontology terms44, 45, variant consequences were defined as functional (i.e. essential splice site, stop gained, stop lost, complex indel, frameshift coding, non synonymous coding, within mature miRNA, partial codon).
To identify rare variants, we used the thirteen UK10K WES sample sets that were not obese sample sets and were not included as controls in this study (Supplementary Note 1). These sample sets were processed in parallel with our cases and controls and thus provide a similar sequencing coverage and depth across the called regions. We removed variants that had a MAF > 1% across all or a MAF > 10% in any of the thirteen sample sets. We then removed variants with a MAF > 1% in any of seven additional sample sets: 1. UK10K WGS sample set4, 2–3. European and African American NHLBI ESP v2 sample sets 37, and 4–7, the four continent sample sets (AFR, AMR, ASN, EUR) from 1000 Genomes Phase 1 integrated v3 call set36. Novel variants were identified as sites not seen in any of the internal or external datasets used for MAF annotation, i.e. novel at the time of this study.
Sample quality control
Samples were identified as contaminated using a combination of two methods: VerifyBamID v1.046 and “fraction skewed hets”4. For the TS samples, the FREEMIX value was estimated using 11,250 high quality, autosomal, biallelic SNPs with an alternate AF ≥ 0.01, and a call rate ≥ 0.5 in both the TS sample set and the 1000Genomes Project Phase 1 v336. Of the 2,819 TS SCOOP samples, the 784 WES SCOOP samples, and the 1427 WES samples used as controls 37, one, and nine were excluded due to contamination respectively. Sixteen non-contaminated TS samples were excluded based on a mean sample read-depth 3 SD below the average for all samples (i.e. mean sample read-depth < 12.09). Genotype concordance for 436 WES SCOOP samples and 1,035 TS SCOOP samples for which we had both sequence and GWAS data3 was also calculated. Four WES samples and six TS samples with a concordance rate below 90% were identified and excluded. A set of highly polymorphic markers (MAF > 0.3) was genotyped and compared to the sequencing calls from each sample. Non-concordant WES samples were removed prior to variant calling and are not included in the original sequencing numbers. Eighty-one TS samples with low concordance were removed after variant calling. Three TS samples were removed due to having an extremely high genotype missing rate of > 50%.
To identify non-European samples, we calculated principal components (PCs) from the 1000Genomes Phase I integrated call set36 using either EIGENSTRAT v4.247 or LASER 2.048 for the WES and TS samples respectively (Supplementary Note 3). Of the 2,676 TS samples, 837 were classified as non-European due to genetic ancestry and three were excluded due to a reported non-European ancestry resulting in 1,836 good quality TS samples of European ancestry. Of the 779 WES SCOOP samples, 37 samples were classified as non-European due to genetic ancestry resulting in 742 good quality WES SCOOP samples of European ancestry. Of the 1,418 control samples, 146 were identified as being non-European leaving 1272 high quality WES controls.
Known and cryptic relatedness was identified by estimating pairwise identity by descent using PLINK v1.0749. Genetic relationships within the WES sample set is described in detail elsewhere4. We removed individuals sequentially by: (1) largest number of relationships, (2) diseased controls, non-diseased controls, cases, (3) lower mean depth of sequencing. Five SCOOP cases and 155 controls were removed resulting in 737 SCOOP WES cases and 1,117 WES controls all of high quality, unrelated, and European ancestry. A similar process was used to identify genetic relationships within the TS sample set and between the TS and WES sample sets (Supplementary Note 3). This resulted in 25 additional exclusions (18 TS cases related to WES cases and seven related within the TS sample set) for a total of 1,811 high quality, unrelated, TS samples of European ancestry.
Candidate Gene Sets
We performed database searches using keywords ‘obesity’, ‘growth’, ‘size’, ‘adipose tissue’, (details below) and manually curated the results to arrive at a set of six tiers of candidate gene with definite or likely links to obesity. The Online Mendelian Inheritance of Man (OMIM database, http://www.omim.org/) accessed in February, 201350 was used to identify 32 genes (Supplementary Table 1) which directly lead to human obesity. These were further categorised into two groups based on consistent clinical features: genes characterised by “Obesity alone” (Obesity Alone; n = 6), and “Obesity and developmental delay and/or dysmorphology” (Obesity and Delay; n = 26). Any putative list of candidate genes has limitations and other genes that contribute to energy homeostasis/obesity in animal models deserve interrogation in the future.
Genes that cause obesity when disrupted in rodents were identified using the Mouse Genome Informatics Database (MGI, http://www.informatics.jax.org/)51 and the Rat Genome Database (RGD, http://rgd.mcw.edu)52 both accessed in February 2013, as well as published research (www.ncbi.nlm.gov/Pubmed). Eighty-seven genes were associated with a growth/size phenotype when perturbed in rodent animal models. We evaluated the strength of evidence for a role of each gene in obesity phenotype and divided them into four further categories, specifically: Loss of function associated with obesity in mice (LoF Mice; n = 51); gain of function associated with obesity in mice (GoF Mice, n = 5); anorectic peptides and receptors (Anorectic Molecules, n = 7); loss of function associated with other metabolic phenotypes in mice (Complex Metabolic Effects, n = 24) (Supplementary Table 1).
Sequence validation of rare functional variants
Novel, functional variants in all 119 candidate genes were taken forward for validation by conventional Sanger sequencing (90% validation rate). Briefly, customized PCR primers were designed+/−250 bp surrounding the variant; and sequencing was performed using BigDye Terminator v3 kit (Applied BioSystems) and analysed by capillary electrophoresis on an ABI3730 DNA Analyzer platform (Applied Biosystems), according to the manufacturers’ instructions. Familial segregation analysis of variants was performed where family samples were available.
Identification of clinically-associated variants in known human obesity genes
The strategy for identification of clinically-associated variants in known human obesity genes is outlined in Fig. 1. Briefly, novel and rare variants in the known human obesity genes were filtered using the ClinVar database (http://www.ncbi.nlm.nih.gov/clinvar/). We retained novel variants and those with a ClinVar status of Pathogenic/Likely pathogenic (N = 332).
Structural Analysis of GNAS Variants
For structural analysis of the genetic variants and prediction of their impact on protein function, we modelled their location in relation to previously solved protein crystal structures of GNAS in complex with either G-protein coupled receptor (ADRB2) or downstream effector (adenylyl cyclase). Specifically, the first model represented in Fig. 3a is based on crystal structure of the active state ternary protein complex of GPCR beta-2-adrenergic receptor (ADRB2), and the nucleotide-free Gs heterotrimer, composed of Gs-α(GNAS), Gs-β, and Gs-γ subunits (ref. 20, PDB number: 3SN6, www.rcsb.org). The second model, represented in Fig. 3b, is based on complex of GNAS with the catalytic domains of mammalian adenylyl cyclase (ref. 21, PDB number: 1AZS, www.rcsb.org). The structural representations using ribbon-depicted models were generated using the Open-Source PyMOL Molecular Graphics System, Version 1.7.x Schrödinger, LLC (http://pymol.org).
Association Analyses
We implemented the optimal Sequence Kernel Association Test SKAT-O11, 53 with the SKAT R package v1.1.254 using options method = ”optimal.adj” for SKAT-O and r.corr = 1 for burden. For each gene and candidate gene set, we performed two primary tests using the burden test: 1. rare functional (Rare Func) or (2) novel functional (Novel Func). We performed secondary tests restricting either to variants that were predicted to be deleterious by at least one of the three algorithms (i.e. SIFT, PolyPhen, and Condel) (1 + del) or to variants that were predicted to be deleterious by all three algorithms (all del). For SIFT and Condel, variants were classified as deleterious if they were labelled as “deleterious”. For PolyPhen, variants were classified as deleterious if they were labelled as “probably damaging” or “damaging”. Our conservative Bonferroni adjusted significance level of the primary analyses for 119 genes and 6 gene sets was 0.05/(2 × 125) = 2.0E-4. Once considering our additional ten secondary tests, our Bonferroni adjusted significance level was 0.05/(12 × 125) = 3.3E-5. We repeated all primary and secondary tests using SKAT-O (Table 1 ; Supplementary Table 4–9, 13).
Functional studies of variants in ANGPTL6
To predict the impact of variants on the ANGPTL6 protein, we modelled their location using the crystal structure of a related protein fibrinogen in a complex with a peptide Gly-His-Pro-amide (described in Yang et al.55, PDB number: 1LWU, www.rcsb.org). The structural representations using ribbon-depicted models were generated using the Open-Source PyMOL Molecular Graphics System, Version 1.7.x Schrödinger, LLC (http://pymol.org). N-terminal triple Flag tag was added to human ANGPTL6 cDNA cloned into a pEZ-M14 mammalian expression vector (Capital Bioscience). Mutations were introduced into this construct using QuikChange (Agilent technologies), and confirmed by Sanger sequencing. ANGPTL6 protein expression was studied by transient transfection in HEK293 cells. Media was collected 48 h – post transfection, the cell medium was centrifuged for 5 min (5,000 g at 4 °C) and the supernatants were collected. Cells were harvested prior to centrifugation for 15 min (15,000 g at 4 °C). Aliquots from the medium and cells were subjected to SDS-PAGE and immunoblot analysis. Primary antibodies (monoclonal Flag M2 antibody (Sigma) and a polyclonal antibody to Calnexin (Cell signalling)) were used at 1:1000, and secondary Horseradish peroxidase–conjugated anti-mouse or anti-rabbit IgG (Dako) antibody at 1:2000 dilution. After staining with ECL West Dura Substrate kit (Thermo Scientific), visualisation was performed on Chemidoc Digital Imager (Bio-Rad) (Supplementary Information). The relative protein secretion of ANGPTL6 for each variant was standardized to wild-type protein secretion. Experiments were performed in triplicate and analysed using an unpaired T-test with Welch’s correction.
ANGPTL6 statistical follow-up analyses
We ran gene-based analyses using SKAT-O as described above on two subsets of ANGPTL6 variants (Supplementary Table 10): (1) the one variant that resulted in a complete loss of protein secretion (S284X; rs201622589), and (2) excluding S284X. For (1), we also used a Fisher’s Exact Test. We repeated the Fisher’s Exact Test of the S284X variant including additional population controls with pre-existing genotype data and replication samples (Online Methods, Sample Sets; Supplementary Tables 11 and 12).
Power Analysis
We calculated the power to detect association to a gene region using the burden test with the Power_Logistic_R function and the haplotype dataset within the SKAT R-package54. We performed power calculations using 500 simulations on a random 2Kb sub region. The effect sizes of the causal variants are equal to log10(MAF) with a maximum effect size of 1.6 (MAF = 0.0001) and all have the same direction of effect. We limited the MAF threshold for causal variants to ≤ 0.01, 0.001, 0.0005 and varied the percentage of causal variants in the region to be between 10–90%. (More details in Supplementary Note 4).
Electronic supplementary material
Acknowledgements
We are indebted to the patients and their families for their participation and to the physicians involved in the Genetics of Obesity Study (GOOS). This work was supported by the Wellcome Trust (ISF, IB) (098497/Z/12/Z; WT098051), Medical Research Council (ISF, SOR) (MRC_MC_UU_12012/5), NIHR Cambridge Biomedical Research Centre (ISF, IB, SOR), Bernard Wolfe Health Neuroscience Endowment (ISF), European Research Council (ISF) and NIH grant DK064265 (GLM), the European Community’s Seventh Framework Programme (FP7/2007–2013) project Beta-JUDO n°279153 (ISF, AK). This study comprises one arm of the UK10K Consortium (WT091310). The UK Household Longitudinal Study is led by the Institute for Social and Economic Research at the University of Essex and funded by the Economic and Social Research Council. The survey was conducted by NatCen and the genome-wide scan data were analysed and deposited by the Wellcome Trust Sanger Institute. Information on how to access the data can be found on the Understanding Society website https://www.understandingsociety.ac.uk/. AH and JH were funded by the German Ministry for Education and Research (National Genome Research Net-Plus 01GS0820), the German Research Foundation (DFG; HI865/2-1), the European Community’s Seventh Framework Programme (FP7/2007-2013) under grant agreements n°245009 and n°262055. We thank participants and staff of the Copenhagen City Heart Study, Copenhagen Ischemic Heart Disease Study, and the Copenhagen General Population Study for their important contributions (CCHS, CGPS, CIHDS). CHD case ascertainment and validation, genotyping, and clinical chemistry assays in EPIC-CVD were supported by grants awarded to the University of Cambridge from the EU Framework Programme 7 (HEALTH-F2-2012-279233), the UK Medical Research Council (G0800270) and British Heart Foundation (SP/09/002), the European Research Council (268834), the UK National Institute for Health Research Cambridge Biomedical Research Centre, Merck and Pfizer. We thank all EPIC participants and staff for their contribution to the study, the laboratory teams at the Medical Research Council Epidemiology Unit for sample management and Cambridge Genomic Services for genotyping, Sarah Spackman for data management, and the team at the EPIC-CVD Coordinating Centre for study coordination and administration (EPIC-CVD). JD is supported by a British Heart Foundation Professorship, NIHR Senior Investigator, European Research Council Senior Investigator. Leipzig LIFE Child as part of the Leipzig Childhood Obesity cohort was funded by the European Union, by the European Regional Development Fund (ERFD) by means of the Free State of Saxony within the framework of the excellence initiative. This research has been conducted using the UK Biobank Resource.
Author Contributions
I.B., I.S.F., A.E. and E.G.B. designed the study, analysed the data and wrote the paper. J.M.K., R.B., S.A., E.H. contributed to recruitment and consenting of the cohort; N.A., V.M., A.K., S.P., S.G. to validation of genetic findings in family studies and functional studies; G.M., E.W., I.T., E.Z. contributed to data analysis and G.L.M., R.I.P., S.O.R., to data collection and/or analysis. A.K., J.K. contributed data in Leipzig children. A.H., J.H., R.A.S., C.L., N.J.W., P.S., J.M.M.H., A.S.B., J.D., B.G.N., S.F.N., S.A., Understanding Society Scientific Group, EPIC-CVD Consortium contributed data for the ANGPTL6 (p.S284X) variant. Targeted and whole-exome sequencing was performed as part of the UK10K consortium. All authors reviewed and contributed to the final version of the paper.
Competing Interests
The authors declare that they have no competing interests.
Footnotes
Audrey E. Hendricks and Elena G. Bochukova contributed equally to this work.
A comprehensive list of consortium members appears at the end of the paper.
Electronic supplementary material
Supplementary information accompanies this paper at doi:10.1038/s41598-017-03054-8
Publisher's note: Springer Nature remains neutral with regard to jurisdictional claims in published maps and institutional affiliations.
Contributor Information
Inês Barroso, Email: ib1@sanger.ac.uk.
I. Sadaf Farooqi, Email: isf20@cam.ac.uk.
Understanding Society Scientific Group:
Michaela Benzeval, Jonathan Burton, Nicholas Buck, Annette Jäckle, Meena Kumari, Heather Laurie, Peter Lynn, Stephen Pudney, Birgitta Rabe, and Dieter Wolke
EPIC-CVD Consortium:
Kim Overvad, Anne Tjønneland, Francoise Clavel-Chapelon, Rudolf Kaaks, Heiner Boeing, Antonia Trichopoulou, Pietro Ferrari, Domenico Palli, Vittorio Krogha, Salvatore Panico, Rosario Tuminoa, Giuseppe Matullo, Jolanda Boer, Yvonne van. der. Schouw, Elisabete Weiderpass, J. Ramon Quiros, María-José Sánchez, Carmen Navarro, Conchi Moreno-Iribas, Larraitz Arriola, Olle Melander, Patrik Wennberg, Timothy J. Key, and Elio Riboli
UK10K Consortium:
Saeed Al Turki, Carl A. Anderson, Richard Anney, Dinu Antony, María Soler Artigas, Muhammad Ayub, Senduran Bala, Jeffrey C. Barrett, Phil Beales, Jamie Bentham, Shoumo Bhattacharyaa, Ewan Birney, Douglas Blackwooda, Martin Bobrow, Patrick F. Bolton, Chris Boustred, Gerome Breen, Mattia Calissanoa, Keren Carss, Ruth Charlton, Krishna Chatterjee, Lu Chen, Antonio Ciampia, Sebahattin Cirak, Peter Clapham, Gail Clement, Guy Coates, Massimiliano Coccaa, David A. Collier, Catherine Cosgrove, Tony Coxa, Nick Craddock, Lucy Crooks, Sarah Curran, David Curtis, Allan Daly, Petr Danecek, Ian N. M. Day, Aaron Day-Williams, Anna Dominiczak, Thomas Down, Yuanping Du, Ian Dunham, Richard Durbin, Sarah Edkins, Rosemary Ekong, Peter Ellis, David M. Evansa, David R. Fitzpatrick, Paul Flicek, James Floyd, A. Reghan Foley, Christopher S. Franklin, Marta Futema, Louise Gallagher, Tom R. Gaunt, Matthias Geihs, Daniel Geschwind, Celia M. T. Greenwood, Heather Griffin, Detelina Grozeva, Xiaosen Guo, Xueqin Guo, Hugh Gurling, Deborah Hart, Peter Holmans, Bryan Howie, Jie Huang, Liren Huang, Tim Hubbard, Steve E. Humphries, Matthew E. Hurles, Pirro Hysi, Valentina Iotchkova, David K. Jackson, Yalda Jamshidi, Chris Joyce, Konrad J. Karczewski, Jane Kaye, Thomas Keane, John P. Kemp, Karen Kennedy, Alastair Kent, Farrah Khawaja, Margriet van Kogelenberg, Anja Kolb-Kokocinski, Genevieve Lachance, Cordelia Langford, Daniel Lawson, Irene Lee, Monkol Lek, Rui Li, Yingrui Li, Jieqin Liang, Hong Lin, Ryan Liu, Jouko Lönnqvist, Luis R. Lopes, Margarida Lopes, Daniel G. MacArthur, Massimo Mangino, Jonathan Marchini, John Maslen, Iain Mathieson, Peter McGuffin, Andrew M. McIntosh, Andrew G. McKechanie, Andrew McQuillin, Yasin Memari, Sarah Metrustry, Nicola Migone, Josine L. Min, Hannah M. Mitchison, Alireza Moayyeri, Andrew Morris, James Morris, Francesco Muntoni, Kate Northstone, Michael C. O’Donovan, Alexandros Onoufriadis, Karim Oualkacha, Michael J. Owen, Aarno Palotie, Kalliope Panoutsopoulou, Victoria Parker, Jeremy R. Parr, Lavinia Paternoster, Tiina Paunio, Felicity Payne, Stewart J. Payne, John R. B. Perry, Olli Pietilainen, Vincent Plagnol, Rebecca C. Pollitt, David J. Porteous, Sue Povey, Michael A. Quail, Lydia Quaye, F. Lucy Raymond, Karola Rehnström, J. Brent Richards, Cheryl K. Ridout, Susan Ring, Graham R. S. Ritchie, Nicola Roberts, Rachel L. Robinson, David B. Savage, Peter Scambler, Stephan Schiffels, Miriam Schmidts, Nadia Schoenmakers, Richard H. Scott, Robert K. Semple, Eva Serra, Sally I. Sharp, Adam Shaw, Hashem A. Shihab, So-Youn Shin, David Skuse, Kerrin S. Small, Carol Smee, Blair H. Smith, George Davey Smith, Nicole Soranzo, Lorraine Southam, Olivera Spasic-Boskovic, Timothy D. Spector, David St Clair, Beate St Pourcain, Jim Stalker, Elizabeth Stevens, Jianping Sun, Gabriela Surdulescu, Jaana Suvisaari, Petros Syrris, Rohan Taylor, Jing Tian, Nicholas J. Timpson, Martin D. Tobin, Ana M. Valdes, Anthony M. Vandersteen, Parthiban Vijayarangakannan, Peter M. Visscher, Louise V. Wain, Klaudia Walter, James T. R. Walters, Guangbiao Wang, Jun Wang, Yu Wang, Kirsten Ward, Tamieka Whyte, Hywel J. Williams, Kathleen A. Williamson, Crispian Wilson, Scott G. Wilson, Kim Wong, ChangJiang Xu, Jian Yang, Feng Zhang, Pingbo Zhang, and Hou-Feng Zheng
References
- 1.El-Sayed Moustafa JS, Froguel P. From obesity genetics to the future of personalized obesity therapy. Nat Rev Endocrinol. 2013;9:402–13. doi: 10.1038/nrendo.2013.57. [DOI] [PubMed] [Google Scholar]
- 2.van der Klaauw AA, Farooqi IS. The hunger genes: pathways to obesity. Cell. 2015;161:119–32. doi: 10.1016/j.cell.2015.03.008. [DOI] [PubMed] [Google Scholar]
- 3.Wheeler E, et al. Genome-wide SNP and CNV analysis identifies common and low-frequency variants associated with severe early-onset obesity. Nat Genet. 2013;45:513–7. doi: 10.1038/ng.2607. [DOI] [PMC free article] [PubMed] [Google Scholar]
- 4.Consortium UK, et al. The UK10K project identifies rare variants in health and disease. Nature. 2015;526:82–90. doi: 10.1038/nature14962. [DOI] [PMC free article] [PubMed] [Google Scholar]
- 5.Farooqi IS, et al. Clinical spectrum of obesity and mutations in the melanocortin 4 receptor gene. N Engl J Med. 2003;348:1085–95. doi: 10.1056/NEJMoa022050. [DOI] [PubMed] [Google Scholar]
- 6.Lemos MC, Thakker RV. GNAS mutations in Pseudohypoparathyroidism type 1a and related disorders. Hum Mutat. 2015;36:11–9. doi: 10.1002/humu.22696. [DOI] [PMC free article] [PubMed] [Google Scholar]
- 7.Aldred MA, Trembath RC. Activating and inactivating mutations in the human GNAS1 gene. Hum Mutat. 2000;16:183–9. doi: 10.1002/1098-1004(200009)16:3<183::AID-HUMU1>3.0.CO;2-L. [DOI] [PubMed] [Google Scholar]
- 8.Warner DR, Weng G, Yu S, Matalon R, Weinstein LS. A novel mutation in the switch 3 region of Gsalpha in a patient with Albright hereditary osteodystrophy impairs GDP binding and receptor activation. J Biol Chem. 1998;273:23976–83. doi: 10.1074/jbc.273.37.23976. [DOI] [PubMed] [Google Scholar]
- 9.Bastida Eizaguirre M, et al. [Albright hereditary osteodystrophy: identification of a novel mutation in a family] An Esp Pediatr. 2001;54:598–600. doi: 10.1016/S1695-4033(01)77602-3. [DOI] [PubMed] [Google Scholar]
- 10.Chen M, et al. Central nervous system imprinting of the G protein G(s)alpha and its role in metabolic regulation. Cell Metab. 2009;9:548–55. doi: 10.1016/j.cmet.2009.05.004. [DOI] [PMC free article] [PubMed] [Google Scholar]
- 11.Lee S, Wu MC, Lin X. Optimal tests for rare variant effects in sequencing association studies. Biostatistics. 2012;13:762–75. doi: 10.1093/biostatistics/kxs014. [DOI] [PMC free article] [PubMed] [Google Scholar]
- 12.Moutsianas L, et al. The power of gene-based rare variant methods to detect disease-associated variation and test hypotheses about complex disease. PLoS Genet. 2015;11:e1005165. doi: 10.1371/journal.pgen.1005165. [DOI] [PMC free article] [PubMed] [Google Scholar]
- 13.Oike Y, et al. Angiopoietin-related growth factor antagonizes obesity and insulin resistance. Nat Med. 2005;11:400–8. doi: 10.1038/nm1214. [DOI] [PubMed] [Google Scholar]
- 14.Kadomatsu T, Tabata M, Oike Y. Angiopoietin-like proteins: emerging targets for treatment of obesity and related metabolic diseases. FEBS J. 2011;278:559–64. doi: 10.1111/j.1742-4658.2010.07979.x. [DOI] [PubMed] [Google Scholar]
- 15.Purcell SM, et al. A polygenic burden of rare disruptive mutations in schizophrenia. Nature. 2014;506:185–90. doi: 10.1038/nature12975. [DOI] [PMC free article] [PubMed] [Google Scholar]
- 16.Pinto D, et al. Convergence of genes and cellular pathways dysregulated in autism spectrum disorders. Am J Hum Genet. 2014;94:677–94. doi: 10.1016/j.ajhg.2014.03.018. [DOI] [PMC free article] [PubMed] [Google Scholar]
- 17.Krumm N, et al. Excess of rare, inherited truncating mutations in autism. Nat Genet. 2015;47:582–8. doi: 10.1038/ng.3303. [DOI] [PMC free article] [PubMed] [Google Scholar]
- 18.Farooqi IS, et al. Effects of recombinant leptin therapy in a child with congenital leptin deficiency. N Engl J Med. 1999;341:879–84. doi: 10.1056/NEJM199909163411204. [DOI] [PubMed] [Google Scholar]
- 19.Kuhnen P, et al. Proopiomelanocortin Deficiency Treated with a Melanocortin-4 Receptor Agonist. N Engl J Med. 2016;375:240–6. doi: 10.1056/NEJMoa1512693. [DOI] [PubMed] [Google Scholar]
- 20.Rasmussen SG, et al. Crystal structure of the beta2 adrenergic receptor-Gs protein complex. Nature. 2011;477:549–55. doi: 10.1038/nature10361. [DOI] [PMC free article] [PubMed] [Google Scholar]
- 21.Tesmer JJ, Sunahara RK, Gilman AG, Sprang SR. Crystal structure of the catalytic domains of adenylyl cyclase in a complex with Gsalpha.GTPgammaS. Science. 1997;278:1907–16. doi: 10.1126/science.278.5345.1907. [DOI] [PubMed] [Google Scholar]
- 22.Lynn, P. Sample design for Understanding Society. Understanding Society Working Paper Series2009–01(2009).
- 23.Day N, et al. EPIC-Norfolk: study design and characteristics of the cohort. European Prospective Investigation of Cancer. Br J Cancer. 1999;80(Suppl 1):95–103. [PubMed] [Google Scholar]
- 24.Kamstrup PR, Tybjaerg-Hansen A, Steffensen R, Nordestgaard BG. Genetically elevated lipoprotein(a) and increased risk of myocardial infarction. JAMA. 2009;301:2331–9. doi: 10.1001/jama.2009.801. [DOI] [PubMed] [Google Scholar]
- 25.Nordestgaard BG, Benn M, Schnohr P, Tybjaerg-Hansen A. Nonfasting triglycerides and risk of myocardial infarction, ischemic heart disease, and death in men and women. JAMA. 2007;298:299–308. doi: 10.1001/jama.298.3.299. [DOI] [PubMed] [Google Scholar]
- 26.Varbo A, et al. Remnant cholesterol as a causal risk factor for ischemic heart disease. J Am Coll Cardiol. 2013;61:427–36. doi: 10.1016/j.jacc.2012.08.1026. [DOI] [PubMed] [Google Scholar]
- 27.Danesh J, et al. EPIC-Heart: the cardiovascular component of a prospective study of nutritional, lifestyle and biological factors in 520,000 middle-aged participants from 10 European countries. Eur J Epidemiol. 2007;22:129–41. doi: 10.1007/s10654-006-9096-8. [DOI] [PubMed] [Google Scholar]
- 28.Sudlow C, et al. UK biobank: an open access resource for identifying the causes of a wide range of complex diseases of middle and old age. PLoS Med. 2015;12:e1001779. doi: 10.1371/journal.pmed.1001779. [DOI] [PMC free article] [PubMed] [Google Scholar]
- 29.Exome Aggregation Consortium (ExAC), Cambridge, MA (URL: http://exac.broadinstitute.org) ([September, 2015]).
- 30.Hinney A, et al. Genome Wide Association (GWA) Study for Early Onset Extreme Obesity Supports the Role of Fat Mass and Obesity Associated Gene (FTO) Variants. PLoS ONE. 2007;2:e1361. doi: 10.1371/journal.pone.0001361. [DOI] [PMC free article] [PubMed] [Google Scholar]
- 31.Quante M, et al. The LIFE child study: a life course approach to disease and health. BMC Public Health. 2012;12:1021. doi: 10.1186/1471-2458-12-1021. [DOI] [PMC free article] [PubMed] [Google Scholar]
- 32.Korner A, Berndt J, Stumvoll M, Kiess W, Kovacs P. TCF7L2 gene polymorphisms confer an increased risk for early impairment of glucose metabolism and increased height in obese children. J Clin Endocrinol Metab. 2007;92:1956–60. doi: 10.1210/jc.2006-2514. [DOI] [PubMed] [Google Scholar]
- 33.Grozeva D, et al. De novo loss-of-function mutations in SETD5, encoding a methyltransferase in a 3p25 microdeletion syndrome critical region, cause intellectual disability. Am J Hum Genet. 2014;94:618–24. doi: 10.1016/j.ajhg.2014.03.006. [DOI] [PMC free article] [PubMed] [Google Scholar]
- 34.Li H, et al. The Sequence Alignment/Map format and SAMtools. Bioinformatics. 2009;25:2078–9. doi: 10.1093/bioinformatics/btp352. [DOI] [PMC free article] [PubMed] [Google Scholar]
- 35.Danecek P, et al. The variant call format and VCFtools. Bioinformatics. 2011;27:2156–8. doi: 10.1093/bioinformatics/btr330. [DOI] [PMC free article] [PubMed] [Google Scholar]
- 36.Genomes Project C, et al. A map of human genome variation from population-scale sequencing. Nature. 2010;467:1061–73. doi: 10.1038/nature09534. [DOI] [PMC free article] [PubMed] [Google Scholar]
- 37.Tennessen JA, et al. Evolution and functional impact of rare coding variation from deep sequencing of human exomes. Science. 2012;337:64–9. doi: 10.1126/science.1219240. [DOI] [PMC free article] [PubMed] [Google Scholar]
- 38.McLaren W, et al. Deriving the consequences of genomic variants with the Ensembl API and SNP Effect Predictor. Bioinformatics. 2010;26:2069–70. doi: 10.1093/bioinformatics/btq330. [DOI] [PMC free article] [PubMed] [Google Scholar]
- 39.Ng PC, Henikoff S. SIFT: Predicting amino acid changes that affect protein function. Nucleic Acids Res. 2003;31:3812–4. doi: 10.1093/nar/gkg509. [DOI] [PMC free article] [PubMed] [Google Scholar]
- 40.Ng PC, Henikoff S. Predicting the effects of amino acid substitutions on protein function. Annu Rev Genomics Hum Genet. 2006;7:61–80. doi: 10.1146/annurev.genom.7.080505.115630. [DOI] [PubMed] [Google Scholar]
- 41.Sunyaev S, Ramensky V, Bork P. Towards a structural basis of human non-synonymous single nucleotide polymorphisms. Trends Genet. 2000;16:198–200. doi: 10.1016/S0168-9525(00)01988-0. [DOI] [PubMed] [Google Scholar]
- 42.Sunyaev S, et al. Prediction of deleterious human alleles. Hum Mol Genet. 2001;10:591–7. doi: 10.1093/hmg/10.6.591. [DOI] [PubMed] [Google Scholar]
- 43.Gonzalez-Perez A, Lopez-Bigas N. Improving the assessment of the outcome of nonsynonymous SNVs with a consensus deleteriousness score, Condel. Am J Hum Genet. 2011;88:440–9. doi: 10.1016/j.ajhg.2011.03.004. [DOI] [PMC free article] [PubMed] [Google Scholar]
- 44.Eilbeck K, et al. The Sequence Ontology: a tool for the unification of genome annotations. Genome Biol. 2005;6:R44. doi: 10.1186/gb-2005-6-5-r44. [DOI] [PMC free article] [PubMed] [Google Scholar]
- 45.Mungall CJ, Batchelor C, Eilbeck K. Evolution of the Sequence Ontology terms and relationships. J Biomed Inform. 2011;44:87–93. doi: 10.1016/j.jbi.2010.03.002. [DOI] [PMC free article] [PubMed] [Google Scholar]
- 46.Jun G, et al. Detecting and estimating contamination of human DNA samples in sequencing and array-based genotype data. Am J Hum Genet. 2012;91:839–48. doi: 10.1016/j.ajhg.2012.09.004. [DOI] [PMC free article] [PubMed] [Google Scholar]
- 47.Price AL, et al. Principal components analysis corrects for stratification in genome-wide association studies. Nat Genet. 2006;38:904–9. doi: 10.1038/ng1847. [DOI] [PubMed] [Google Scholar]
- 48.Wang C, Zhan X, Liang L, Abecasis GR, Lin X. Improved ancestry estimation for both genotyping and sequencing data using projection procrustes analysis and genotype imputation. Am J Hum Genet. 2015;96:926–37. doi: 10.1016/j.ajhg.2015.04.018. [DOI] [PMC free article] [PubMed] [Google Scholar]
- 49.Purcell S, et al. PLINK: a tool set for whole-genome association and population-based linkage analyses. Am J Hum Genet. 2007;81:559–75. doi: 10.1086/519795. [DOI] [PMC free article] [PubMed] [Google Scholar]
- 50.Online Mendelian Inheritance in Man, OMIM®. McKusick-Nathans Institute of Genetic Medicine, Johns Hopkins University (Baltimore, MD), (http://omim.org/) (February, 2013).
- 51.The Mouse Genome Database (MGD), Mouse Genome Informatics. The Jackson Laboratory, Bar Harbor, Maine. http://www.informatics.jax.org (February, 2013).
- 52.The Rat Genome Browser (RGD), Rat Genome Database Web Site. Medical College of Wisconsin, Milwaukee, Wisconsin http://rgd.mcw.edu/ (February, 2013).
- 53.Wu MC, et al. Rare-variant association testing for sequencing data with the sequence kernel association test. Am J Hum Genet. 2011;89:82–93. doi: 10.1016/j.ajhg.2011.05.029. [DOI] [PMC free article] [PubMed] [Google Scholar]
- 54.Seunggeun Lee, with contributions from Larisa Miropolsky and Michael Wu. SKAT: SNP-Set(Sequence) Kernel Association Test.. R package version 1.1.2. http://CRAN.R-project.org/package=SKAT (2015).
- 55.Yang Z, et al. Crystal structure of fragment D from lamprey fibrinogen complexed with the peptide Gly-His-Arg-Pro-amide. Biochemistry. 2002;41:10218–24. doi: 10.1021/bi020299t. [DOI] [PubMed] [Google Scholar]
Associated Data
This section collects any data citations, data availability statements, or supplementary materials included in this article.