

Abstract
Introduction
Genomic and transcriptomic alterations affecting key cellular processes such us cell proliferation, differentiation and genomic stability are considered crucial for the development and progression of cancer. Most invasive breast carcinomas are known to derive from precursor in situ lesions. It is proposed that major global expression abnormalities occur in the transition from normal to premalignant stages and further progression to invasive stages. Serial analysis of gene expression (SAGE) was employed to generate a comprehensive global gene expression profile of the major changes occurring during breast cancer malignant evolution.
Methods
In the present study we combined various normal and tumor SAGE libraries available in the public domain with sets of breast cancer SAGE libraries recently generated and sequenced in our laboratory. A recently developed modified t test was used to detect the genes differentially expressed.
Results
We accumulated a total of approximately 1.7 million breast tissue-specific SAGE tags and monitored the behavior of more than 25,157 genes during early breast carcinogenesis. We detected 52 transcripts commonly deregulated across the board when comparing normal tissue with ductal carcinoma in situ, and 149 transcripts when comparing ductal carcinoma in situ with invasive ductal carcinoma (P < 0.01).
Conclusion
A major novelty of our study was the use of a statistical method that correctly accounts for the intra-SAGE and inter-SAGE library sources of variation. The most useful result of applying this modified t statistics beta binomial test is the identification of genes and gene families commonly deregulated across samples within each specific stage in the transition from normal to preinvasive and invasive stages of breast cancer development. Most of the gene expression abnormalities detected at the in situ stage were related to specific genes in charge of regulating the proper homeostasis between cell death and cell proliferation. The comparison of in situ lesions with fully invasive lesions, a much more heterogeneous group, clearly identified as the most importantly deregulated group of transcripts those encoding for various families of proteins in charge of extracellular matrix remodeling, invasion and cell motility functions.
Keywords: breast cancer, gene expression profiling, serial analysis of gene expression
Introduction
Invasive ductal breast carcinoma (IDC) is the most common malignancy of the breast, accounting for ~80% of all invasive breast tumors [1]. Although an issue of much controversy over the years, there is now general agreement and overwhelming histopathological and genetic evidence indicating that most invasive breast carcinomas appear to develop gradually from defined precursor lesions [2]. However, it also became clear that progression toward more aggressive phenotypes is not obligatory [3]. It is further evident that many genetic abnormalities underlying tumor progression are probably phenotypically silent.
Numerous molecular genetic changes have been reported as relevant in human breast carcinogenesis, such as anomalies affecting cell proliferation, apoptosis and invasion [4]. Preinvasive breast lesions such as high-grade ductal carcinoma in situ (DCIS) are known to have acquired a myriad of genomic and transcriptomic changes, but as their name implies they are not yet invasive. The development of the ability to invade surrounding tissues is perhaps the most critical event in cancer progression. Among proposed invasion-related genes with reported altered expression in tumor cells are cell adhesion molecules, proteases and cytoskeletal molecules that may influence motility [5]. Identifying the key and most common gene expression abnormalities involved in the transition steps from preinvasion to a fully invasive phenotype is an extremely important topic of research and the main objective of the present report. Studies on this area may provide clues to better diagnose premalignant lesions at high risk of progression and may aid in achieving a better understanding of critical early molecular mechanisms involved in breast cancer evolution.
Serial analysis of gene expression (SAGE) is a comprehensive profiling method that allows for global, unbiased and quantitative characterization of transcriptomes [6,7]. SAGE provides a statistical description of the mRNA population present in a cell without prior selection of the genes to be studied, and this constitutes a major advantage. In this sense, only open systems can identify expressed genes that have not yet been cloned or partially sequenced. A second major advantage is that the information generated is digital in format, and can be directly compared with data generated from any other laboratory or with data available in public databases such as the Cancer Genome Anatomy Project http://cgap.nci.nih.gov/SAGE.
To perform a comparative SAGE analysis of normal, preinvasive and invasive lesions, we used a modified t test that we have recently developed [8]. This method has the advantage of taking into account both the intra-sample and inter-sample variability, identifying 'common patterns' of gene changes systematically occurring across samples. Most of the tests developed for measuring differential expression in SAGE data focus on capturing the first type of variation correctly, but tend to neglect the second type [9,10]. The aim of the present study was to provide a statistically robust global gene expression analysis on the progression of breast cancer using the described statistical approach comparing breast normal and tumor SAGE libraries obtained from public databases combined with additional SAGE libraries recently generated in our laboratory.
Materials and methods
SAGE libraries
To perform the comparative analysis of different stages of breast cancer progression, we combined SAGE libraries available in public databases with breast cancer libraries generated and sequenced at our own laboratory. To this end, 12 SAGE libraries of breast tissues (four normal breast tissues, six DCIS tissues and two IDC tissues) were downloaded from the Cancer Genome Anatomy Project – SAGE Genie database (libraries generated at the Polyak Laboratory, Dana-Farber Cancer Institute, Boston, MA, USA). We used 11 additional breast cancer SAGE libraries generated by ourselves, at an approximate resolution of 100,000 SAGE tags per library. All IDC SAGE libraries used in this study were from lymph node-negative, estrogen receptor-positive and progesterone receptor-positive tumor samples, with a tumor size classification of T1 or T2 (i.e. T1–T2 N0 M0). Table 1 summarizes all the SAGE libraries used in this comparative analysis.
Table 1.
Breast-specific serial analysis of gene expression (SAGE) libraries
| Histology | Library name | Tag count | Unique tags |
| Normal breast tissue | |||
| Normal 1 | SAGE breast normal AP Br Na | 37,419 | 15,886 |
| Normal 2 | SAGE breast normal epithelium AP 1a | 49,021 | 18,276 |
| Normal 3 | SAGE breast normal organoid Ba | 58,326 | 19,602 |
| Normal 4 | SAGE breast normal organoid B2a | 59,481 | 20,391 |
| Ductal carcinoma in situ | |||
| DCIS 1 | SAGE breast carcinoma MD DCISa | 42,174 | 14,237 |
| DCIS 2 | SAGE breast carcinoma AP DCIS 3a | 57,924 | 31,142 |
| DCIS 3 | SAGE breast carcinoma B DCIS 4a | 60,699 | 20,224 |
| DCIS 4 | SAGE breast carcinoma B DCIS 5a | 43,118 | 15,935 |
| DCIS 5 | SAGE breast carcinoma epithelium AP DCIS 6a | 73,409 | 30,256 |
| DCIS 6 | SAGE breast carcinoma B BWHT18a | 50,879 | 19,182 |
| DCIS 7 | MDACC 22Tb | 102,533 | 33,305 |
| Invasive ductal carcinoma | |||
| IDC 1 | MDACC 09Tb | 91,647 | 37,863 |
| IDC 2 | MDACC 14Tb | 100,255 | 26,422 |
| IDC 3 | MDACC 15Tb | 90,198 | 27,653 |
| IDC 4 | MDACC 17Tb | 100,386 | 29,300 |
| IDC 5 | MDACC 18Tb | 101,543 | 29,936 |
| IDC 6 | MDACC 19Tb | 100,334 | 28,498 |
| IDC 7 | MDACC 20Tb | 100,047 | 28,903 |
| IDC 8 | MDACC 21Tb | 103,825 | 31,412 |
| IDC 9 | MDACC 24Tb | 99,546 | 30,363 |
| IDC 10 | MDACC 25Tb | 100,501 | 30,778 |
| IDC 11 | SAGE breast carcinoma B IDC 3a | 68,937 | 22,732 |
| IDC 12 | SAGE breast carcinoma B IDC 5a | 60,476 | 20,457 |
| Total | 23 breast libraries | 1,752,678 | |
a Libraries available in public databases. b Libraries generated in our laboratory.
SAGE methodology
For the SAGE libraries generated in our laboratory we followed standard methods. Briefly, total RNA was extracted from snap-frozen tissues using TRIzol (Invitrogen, San Francisco, CA, USA). SAGE library construction was performed with the I-SAGE kit (Invitrogen) according to the manufacturer's protocol and introducing only minor modifications. The anchoring enzyme was NlaIII and the tagging enzyme used was BsmFI. Concatemerized ditags were cloned into pZERO-1 and sequenced with an ABI 3700 DNA Analyzer (Applied Biosystems, Foster City, CA, USA).
SAGE data processing
SAGE tags were extracted from sequencing files using the SAGE2000 software version 4.0 (a kind gift from Dr K. Kinzler, John Hopkins School of Medicine, Baltimore, MD, USA). Tag abundances for all libraries were normalized to a total of 100,000 tags (at which level a tag present 10 times has an abundance of 0.01%). Tag to gene assignments as well as additional annotations using public databases (e.g. Gene Ontology, Locus Link, Unigene cluster) were performed, using web-based SAGE library tools developed by ourselves http://spi.mdacc.tmc.edu/bitools/about/sage_lib_tool.html. In our comparison we used only tags with only one reliable assigned gene.
Statistical analysis of SAGE libraries
To compare the 23 SAGE libraries, we utilized a modified t test recently developed by us [8]. This analysis allowed us to identify SAGE tags with significantly different expression levels (P < 0.01) between normal tissue and DCIS and between DCIS and IDC. Tags with total counts of less than three in all libraries were filtered out before the analysis. In order to enable visualization and illustration of our analyses, we utilized the TIGR MultiExperiment Viewer (MeV 2.2) software (The Institute for Genomic Research, Rockville, MD, USA). This tool was employed for normalization and average clustering of the SAGE data.
The aim of the heat maps presented is simply to organize and illustrate the data by graphical means. Briefly, the normalization included logarithmic transformation followed by median centering by samples and genes. We used standard average hierarchical clustering techniques to classify and illustrate further the differences found by the modified t test, showing the clusters of differentially coexpressed genes between the normal tissue, DCIS and IDC groups.
Results and discussion
Generation and analysis of SAGE libraries
The primary goal of our study was to identify the most commonly occurring transcriptome changes in the transition from normal breast epithelium to DCIS and invasive carcinoma. To this end, SAGE data obtained from 11 breast cancer libraries generated in our laboratory (1,090,815 tags) were combined and compared with data available in the public domain (661,863 tags), thus generating a dataset of almost 1.7 million breast cancer and normal specific tags, representing approximately 25,157 transcripts from a total of 23 libraries (Table 1).
Our statistically stringent analysis revealed 52 transcripts commonly deregulated across the board when comparing normal tissue with DCIS (Fig. 1), and 149 transcripts when comparing DCIS with IDC (P < 0.01) (Fig. 2) (see additional data files 1 and 2 for additional information with statistical cutoff at P < 0.05). Selected genes based on relative abundance, highly statistical differences and high fold changes between compared groups are sorted and represented in Tables 2 and 3.
Figure 1.
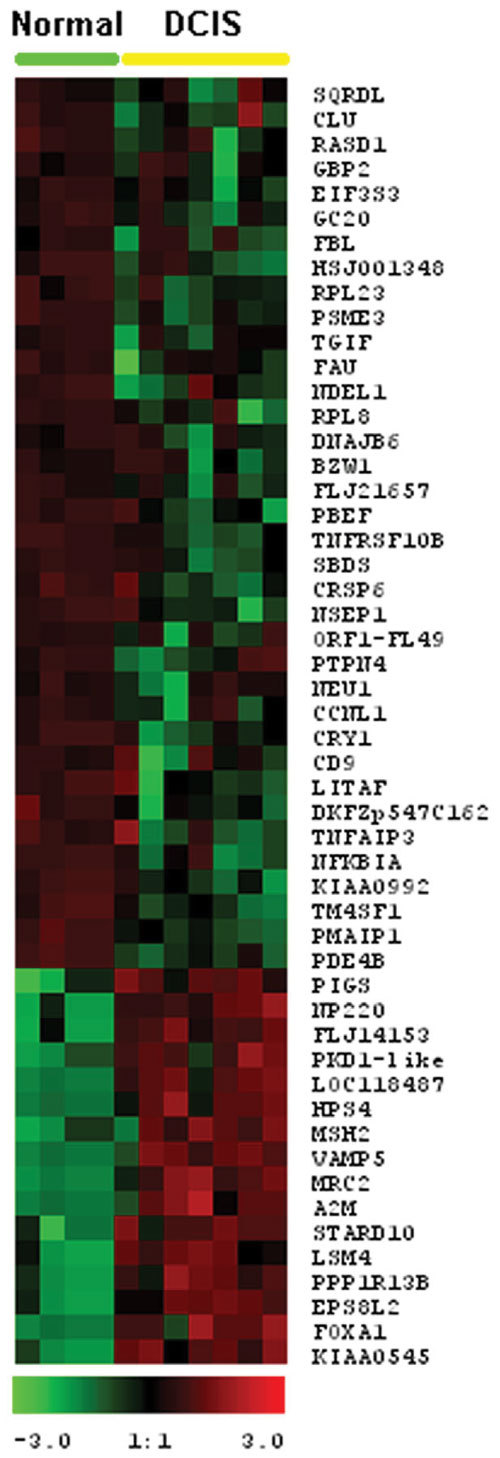
Hierarchical clustering of the most commonly different expressed genes between normal breast tissue and ductal carcinoma in situ (DCIS) groups (P < 0.01). Color scale at bottom of picture is used to represent expression level: low expression is represented by green, and high expression is represented by red.
Figure 2.
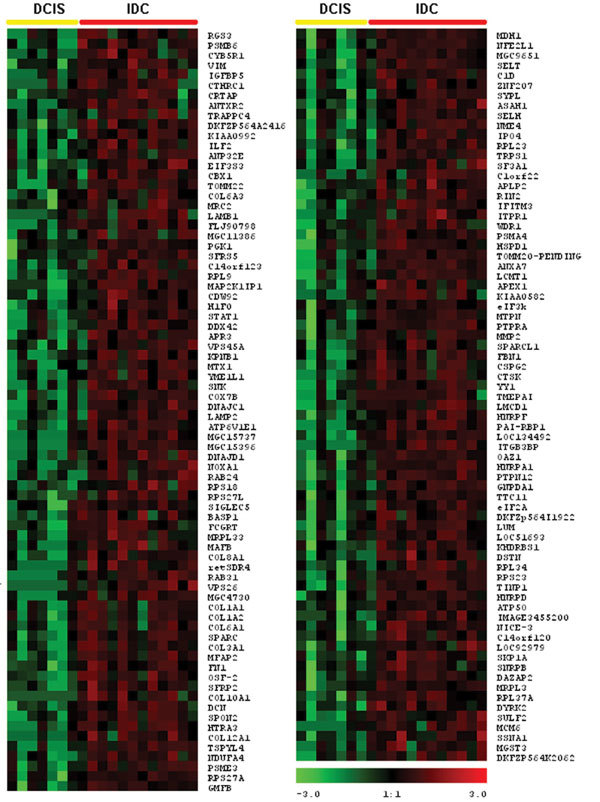
Hierarchical clustering of the most commonly differentially expressed genes between ductal carcinoma in situ (DCIS) and invasive ductal carcinoma (IDC) groups (P < 0.01). Color scale at bottom of picture is used to represent expression level: low expression is represented by green, and high expression is represented by red.
Table 2.
Most frequent differentially expressed genes between normal breast epithelium and ductal carcinoma in situ (DCIS)
| Tag | Gene | Description | Locus link | Fold change | P value |
| DCIS overexpressed genes | |||||
| GTATTTAACT | PKD1-like | Polycystic kidney disease 1-like | 79932 | 13.7 | 0.0100 |
| CGGACTCACT | STARD10 | START domain containing 10 | 10809 | 11.2 | 0.0086 |
| GTGTTGGGGG | EPS8L2 | EPS8-like 2 | 64787 | 9.6 | 0.0099 |
| TTTCTGGAGG | KIAA0545 | KIAA0545 protein | 23094 | 8.6 | 0.0100 |
| GATAAATTAA | FLJ14153 | Hypothetical protein | 64747 | 8.5 | 0.0055 |
| GAGAAATATC | NP220 | Nuclear protein | 27332 | 8.0 | 0.0088 |
| CCCTCTTTGG | LOC118487 | mRNA similar to RIKEN cDNA 1110001019 | 118487 | 7.4 | 0.0037 |
| CTGGGACTGA | LSM4 | U6 small nuclear RNA associated (S. cerevisiae) | 25804 | 6.4 | 0.0055 |
| CTGGGCCAGC | VAMP5 | Vesicle-associated membrane protein 5 | 10791 | 6.4 | 0.0068 |
| GCCCTTTCTC | MRC2 | Mannose receptor, C type 2 | 9902 | 5.8 | 0.0015 |
| TCTTGATTTA | A2M | Alpha-2-macroglobulin | 2 | 5.8 | 0.0083 |
| TAGTTTGTGG | MSH2 | MutS homolog 2, colon cancer | 4436 | 5.6 | 0.0091 |
| TCAGTGAACT | HPS4 | Hermansky–Pudlak syndrome 4 | 89781 | 5.6 | 0.0100 |
| GTTTATTCTT | FOXA1 | Forkhead box A1 | 3169 | 5.3 | 0.0044 |
| GCCGCTGCCA | PPP1R13B | Protein phosphatase 1 | 23368 | 4.3 | 0.0054 |
| TAAAGTGTCT | PIGS | Phosphatidylinositol glycan, class S | 94005 | 3.9 | 0.0100 |
| DCIS underexpressed genes | |||||
| GGGACGAGTG | TM4SF1 | Transmembrane 4 superfamily member 1 | 4071 | -442.6 | 0.0083 |
| TAACAGCCAG | NFKBIA | Nuclear factor kappa light polypeptide gene | 4792 | -158.6 | 2.4 × 10⁻⁶ |
| CAACTAATTC | CLU | Clusterin | 1191 | -63.9 | 0.0036 |
| GCCTTAACAA | PBEF | Pre-B-cell colony-enhancing factor | 10135 | -44.3 | 0.0020 |
| GGGTTTTTAT | NSEP1 | Nuclease sensitive element binding protein 1 | 4904 | -36.2 | 0.0001 |
| GACACGAACA | RASD1 | RAS, dexamethasone-induce 1 | 51655 | -31.4 | 0.0095 |
| AAGATTGGTG | CD9 | CD9 antigen (p24) | 928 | -29.6 | 0.0003 |
| ACCAAATTAA | TNFRSF10B | Tumor necrosis factor receptor superfamily | 8795 | -29.4 | 0.0003 |
| CTGGGCCTGA | LITAF | Lipopolysaccharide-induced tumor necrosis factor | 9516 | -28.9 | 0.0076 |
| CTGCCATAAC | SBDS | Shwachman–Bodian–Diamond syndrome | 51119 | -24.2 | 0.0005 |
| CACAGGCAAA | BZW1 | Basic leucine zipper and W2 domains 1 | 9689 | -22.1 | 0.0056 |
| GTTCCCTGGC | FAU | Finkel–Biskis–Reilly murine sarcoma virus | 2197 | -22.1 | 0.0028 |
| GTCTGCACCT | DKFZp547C1 | Hypothetical protein | 254851 | -21.9 | 0.0087 |
| TACGTTGCAG | GC20 | Translocation factor sui1 homolog | 10289 | -21.8 | 0.0079 |
| TGTAAAGATT | CCNL1 | Cyclin L1 | 57018 | -21.2 | 0.0008 |
| TGTTAAGTTC | CRY1 | Cryptochrome 1 (photolyase-like) | 1407 | -18.7 | 0.0091 |
| GAAATAAAGT | FLJ21657 | Hypothetical protein | 64417 | -18.5 | 0.0032 |
| ATGGGCTTGA | SQRDL | Sulfide quinone reductase-like (yeast) | 58472 | -17.3 | 0.0061 |
| TCAAGAAATT | PSME3 | Proteasome activator subunit 3 | 10197 | -15.7 | 0.0028 |
| CCGTGGTCGT | FBL | Fibrillarin | 2091 | -15.3 | 0.0100 |
| TGGAACAGGA | TGIF | Transforming growth factor beta-induced factor (TALE family homeobox) | 7050 | -12.2 | 0.0030 |
| AATGCTGGCA | DNAJB6 | DnaJ homolog, subfamily B, member 6 | 10049 | -11.7 | 0.0065 |
| AATGAGCAAC | GBP2 | Guanylate binding protein 2, interferon-inducible | 2634 | -11.1 | 0.0082 |
| GACCTATCTC | KIAA0992 | Paladin | 23022 | -10.9 | 0.0092 |
| AACTCTTGAA | EIF3S3 | Eukaryotic translation initiation factor 3 | 8667 | -10.6 | 0.0082 |
| GGGATTTTGT | PMAIP1 | Phorbol-12-myristate-13-acetate-induced protein 1 | 5366 | -10.6 | 0.0091 |
| AAAGCAAAAA | PTPN4 | Protein tyrosine phosphatase, non-receptor type 4 | 5775 | -10.4 | 0.0040 |
| ACTGACTATC | NEU1 | Sialidase 1 (lysosomal sialidase) | 4758 | -10.3 | 0.0095 |
| TTCCAGTTCA | PDE4B | Phosphodiesterase 4B, camp-specific | 5142 | -9.9 | 0.0087 |
| GAATGATTTC | ORF1-FL49 | Putative nuclear protein | 84418 | -9.5 | 0.0070 |
| GACTCGCTCC | HSJ001348 | cDNA for differentially expressed CO16 gene | 54742 | -9.5 | 0.0072 |
| TGGTTACAAA | NDEL1 | Nude nuclear distribution gene E homolog like 1 | 81565 | -8.9 | 0.0100 |
| AGTATGAGGA | TNFAIP3 | Tumor necrosis factor, alpha-induced protein 3 | 7128 | -8.1 | 0.0083 |
| CAGTTTAAAA | CRSP6 | Cofactor required for Sp1 transcriptional activation | 9440 | -7.7 | 0.0100 |
Table 3.
Most frequent differentially expressed genes between ductal carcinoma in situ and invasive ductal carcinoma (IDC)
| Tag | Gene | Description | Locus link | Fold change | P value |
| IDC overexpressed genes | |||||
| TGGAAATGAC | COL1A1 | Collagen type I, alpha 1 | 1277 | 315.4 | 0.0054 |
| ATGTGAAGAG | SPARC | Secreted protein, cysteine-rich (osteonectin) | 6678 | 286.8 | 0.0003 |
| TTTGGTTTTC | COL1A2 | Collagen type I, alpha 2 | 1278 | 210.9 | 0.0084 |
| TTGCTGACTT | COL6A1 | Collagen type VI, alpha 1 | 1291 | 73.9 | 0.0023 |
| TTATGTTTAA | LUM | Lumican | 4060 | 56.7 | 0.0011 |
| TTGGAGATCT | NDUFA4 | NADH dehydrogenase (ubiquinone) | 4697 | 56.4 | 0.0065 |
| CCACAGGGGA | COL3A1 | Collagen type III, alpha 1 | 1281 | 49.4 | 0.0056 |
| ATCTTGTTAC | FN1 | Fibronectin 1 | 2335 | 44.3 | 0.0031 |
| TTGTAATCGT | OAZ1 | Ornithine decarboxylase antizyme 1 | 4946 | 38.6 | 0.0038 |
| TGTAATCAAT | HNRPA1 | Heterogeneous nuclear ribonucleoprotein A1 | 3178 | 38.2 | 0.0039 |
| GGAAGCTAAG | OSF-2 | Osteoblast specific factor 2 (fasciclin I-like) | 10631 | 36.3 | 0.0005 |
| ACCTGTATCC | IFITM3 | Interferon induced transmembrane protein 3 | 10410 | 34.3 | 0.0021 |
| GGAAATGTCA | MMP2 | Matrix metalloproteinase 2 | 4313 | 29.1 | 0.0008 |
| TGCACTTCAA | SPARCL1 | SPARC-like 1 (mast9, hevin) | 8404 | 21.7 | 0.0050 |
| GGAACTTTTA | SULF2 | Sulfatase 2 | 55959 | 19.8 | 0.0017 |
| CTGTTAGTGT | MDH1 | Malate dehydrogenase 1 | 4190 | 18.5 | 0.0026 |
| TATGAATGCT | CSPG2 | Chondroitin sulfate proteoglycan 2 (versican) | 1462 | 18.2 | 0.0017 |
| TCCAAATCGA | VIM | Vimentin | 7431 | 17.7 | 0.0014 |
| TGTAGTTTGA | SKP1A | S-phase kinase-associated protein 1A | 6500 | 16.9 | 0.0013 |
| TAATAAACAG | ASAH1 | n-Acylsphimgosine amidohydrolase | 427 | 16.8 | 0.0085 |
| GCCTCCTCCC | EIF3k | Eukaryotic translation initiation factor 3 | 27335 | 16.8 | 0.0098 |
| GAAACAAGAT | PGK1 | Phosphoglycerate kinase 1 | 5230 | 15.8 | 0.0006 |
| TGCTTTGGGA | TTC11 | tetratricopeptide repeat domain 11 | 51024 | 15.8 | 0.0018 |
| GAAATCAAAA | SIGLEC5 | Sialic acid binding Ig-like lectin 5 | 8778 | 14.7 | 0.0098 |
| ATGTAGTAGT | HNRPD | Heterogeneous nuclear ribonucleoprotein D | 3184 | 14.7 | 0.0025 |
| GACCACCTTT | MFAP2 | Microfibrillar-associated protein 2 | 4237 | 14.4 | 0.0000 |
| ACTTATTATG | DCN | Decorin | 1634 | 13.9 | 0.0007 |
| TCTCTACCCA | APLP2 | Amyloid beta (A4) precursor-like protein 2 | 334 | 13.7 | 0.0076 |
| TGCAATATGC | FBN1 | Fibrillin 1 | 2200 | 13.5 | 0.0037 |
| ATTTCTTCAA | SFRP2 | Secreted frizzled-related protein 2 | 6423 | 13.4 | 0.0030 |
| ATAAAAAGAA | CTSK | Cathepsin K (pycnodysostosis) | 1513 | 13.0 | 0.0003 |
| GTACATTGTA | MGC15737 | Hypothetical protein | 85012 | 12.6 | 0.0011 |
| TGATGTTTGA | DAZAP2 | DAZ associated protein 2 | 9802 | 12.5 | 0.0013 |
| TCCGTGGTTG | BASP1 | Membrane attached signal protein 1 | 10409 | 12.1 | 0.0055 |
| ACTGCTTTAC | DKFZp564I1922 | Adlican | 25878 | 12.0 | 0.0086 |
| TCTGCAATGA | TINP1 | Trasnforming growth factor beta-inducible nuclear protein 1 | 10412 | 12.0 | 0.0033 |
| GTTTCTTCCC | SELH | Selenoprotein H | 2880636 | 11.8 | 0.0037 |
| AATATGCTTT | ATP6V1E1 | ATPase | 529 | 11.6 | 0.0009 |
| TTATGGATCT | SPON2 | Spondin 2, extracellular matrix protein | 10417 | 11.3 | 0.0003 |
| AAAATAAAGA | APEX1 | Nuclease, multifunctional DNA repair enzyme | 328 | 11.3 | 0.0099 |
| TGTGTGTTTG | HIF0 | H1 histone family | 3005 | 11.2 | 0.0029 |
| TATGTTTCAG | PTPN12 | Protein tyrosine phosphatase | 5782 | 11.1 | 0.0003 |
| ACCAAAGCCC | MGC9651 | Hypothetical protein | 114932 | 10.6 | 0.0075 |
| CAAGGATCTA | NICE-3 | NICE-3 protein | 25912 | 10.5 | 0.0057 |
| GACGTCTTAA | PSMA4 | Proteasome subunit, alpha type | 5685 | 10.3 | 0.0038 |
| CAGATAACAT | TOMM20 | Translocase | 9804 | 10.1 | 0.0064 |
| AACTCTTGAA | EIF3S3 | Eukaryotic translation initiation factor 3 | 8667 | 10.0 | 0.0047 |
| TTCTTGGTGT | TRPS1 | Trichorhinophalangeal syndrome I | 7227 | 9.9 | 0.0042 |
| TGCCTTAGTA | DNAJC1 | DNAJ homolog | 64215 | 9.8 | 0.0040 |
| AGACAAGCTG | SFRS5 | Splicing factor | 6430 | 9.4 | 0.0015 |
| ACAAGAATTG | SYPL | Synaptophysin-like protein | 6856 | 9.3 | 0.0027 |
| TACATCCGAA | MTPN | Myotrophin | 136319 | 9.3 | 0.0013 |
As expected, we detected various ribosomal genes among the most abundant transcripts in all the breast SAGE libraries, and these genes were highly upregulated in the invasive carcinomas. This agrees with the previous global expression profiles and with the comparisons of cancers and the corresponding normal tissues in general [7,11,12]. To simplify illustration of the data, ribosomal genes are not included in the figures and tables.
Global comparison of normal tissues and DCIS
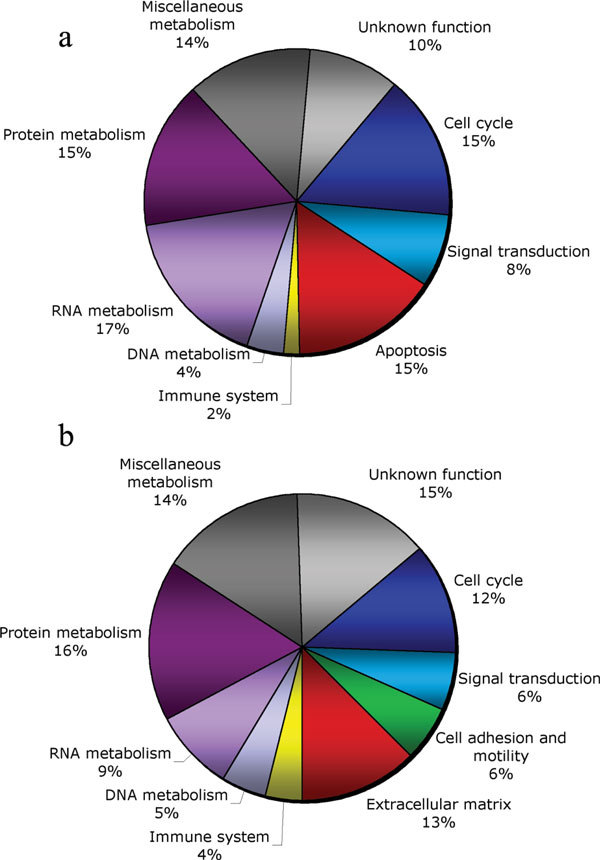
Among the 52 transcripts detected as differentially expressed in DCIS (P < 0.01), 36 were downregulated transcripts and 16 were upregulated transcripts in these lesions when compared with normal breast epithelial cells and mammary epithelial organoids (Fig. 1 and Table 2). We defined and classified the 52 genes differentially expressed into the nine functional categories [13] shown in Fig. 3a. Interestingly, we found that 38% of these transcripts are related to the cell cycle (15%), signal transduction (8%) and apoptosis (15%).
Figure 3.
Classification in functional categories of affected transcripts. (a) Differentially expressed between normal breast tissue and ductal carcinoma in situ (DCIS) (P < 0.01). (b) Transcripts differentially expressed between DCIS and invasive ductal carcinoma (IDC) (P < 0.01).
As expected, our analysis of DCIS versus normal breast epithelium revealed numerous similarities with SAGE data reported previously [12,14], but more importantly it also provided novel information. The expression of numerous genes was significantly downregulated in DCIS, including: transmembrane 4 super family member 1 (TM4SF1), nuclear factor kappa light polypeptide (NFKB1A), pre-B-cell (PBEF), RAS dexamethasone-induced (RASD1), tumor necrosis factor receptor superfamily member 10b (TNFRSF10B), and tumor necrosis factor α-induced protein (TNFAIP). All these transcripts were also observed downregulated in previous reports [12,14] (Table 2). On the contrary, our analysis revealed additional clusters of genes significantly downregulated in the DCIS group that were not previously reported by others: clusterin/apolipoprotein J (CLU), nuclease sensitive element binding protein 1 (NSEP1), lipopolysaccharide-induced TNF factor (LITAF/PIG7), basic leucine zipper/W2 domains 1 (BZW1), and cyclin L1 (CCNL1) (Table 2).
Clusterin was one of the most dramatically downregulated genes (-63.9-fold; P = 0.0036) in DCIS libraries. This gene encodes a heterodimeric, highly conserved, secreted glycoprotein. Alterations in Clusterin expression and/or protein maturation are linked to changes in tissue growth or regression, which may be related to specific proapoptotic or antiapoptotic protein isoforms [15]. Clusterin was reported as overexpressed during tissue and cell involution, and was downregulated in esophageal squamous cell carcinoma and prostate carcinoma, suggesting that this expression alteration could be a general phenomenon during tumor progression [16,17]. On the contrary, and in contrast to these and our observations, Redondo and colleagues reported increased Clusterin expression in breast carcinoma samples [18]. The reason for this discrepancy is unclear at this point. The role of Clusterin in cell survival, cell death and neoplastic transformation remains controversial [15].
Another commonly observed downregulated gene in DCIS libraries was NSEP-1 (-36.2-fold; P = 0.0001). Also known as YB1, NSEP-1 is a member of the highly conserved Y-box family of proteins, which regulate the transcription of several genes associated with cell death including both fas, a cell death-associated receptor, and the tumor suppressor gene p53 [19]. The decrease in expression of NSEP-1 transcripts could play an important role in the early stages of breast carcinogenesis in order to overcome cell proliferation controls.
Interestingly, and as previously observed, we also detected significant downregulation of various cytokines and chemokines: interleukin enhancer binding factor 2 (ILF2), interleukin 13 receptor alpha 1 (IL13RA1), leukemia inhibitory factor (LIF), cardiotrophin-like cytokine (CLC), chemokine C–C ligand 2 (CCL2), and chemokine C–X–C ligand 1 (CXCL1). All these cytokines and chemokines are highly expressed in normal mammary epithelium and are dramatically downregulated in the DCIS samples. These differentially expressed genes were detected within a range of 0.02 <P < 0.05 by means of the modified t test analysis. These small secretory molecules, although usually linked to inflammatory processes, could also play important autocrine and/or paracrine roles in the physiology of normal mammary epithelial cells in particular because receptors for these cytokines are also normally found expressed in normal breast epithelial cells [20]. Some of these molecules (e.g. CXCL1, LIF) appear to play important roles in the normal periodic cycles of growth and involution of the mammary gland following pregnancy and lactation. They may thus be part of the physiologic mechanisms associated with the massive apoptosis observed during involution [21,22]. Unfortunately we understand very little of the relevance of their intriguing de facto silencing in expression, both in in situ as well as in invasive breast cancer lesions.
Interestingly, we also detected a series of transcripts commonly overexpressed in the DCIS samples: polycyctic kidney disease 1-like (PKD1-like), START domain containing 10 (STARD10), EPS8-like2 (EPS8L2), and KIAA0545 protein (Fig. 1d). One of these genes, EPS8-like2, encodes a protein that is related to epidermal growth factor receptor pathway substrate 8 (EPS8), and was shown to be essential in Ras/PI3K to Rac signaling [23]. PKD1-like encodes a member of the polycystin protein family. Members of this protein family may function in cell development and morphology, and may modulate intracellular calcium homoeostasis and other signal transduction pathways [24,25]. Although the PKD1 gene has been associated with cancer mechanisms, this homologous family member has not been implicated in carcinogenesis processes to the best of our knowledge. KIAA0545, also known as signal-induced proliferation-associated 1 like 3 (SIPA1L3), is a member of the Sipa1 family and encodes a protein bearing a domain highly homologous to the catalytic region of human Rap1 GTPase-activating protein (Rap1GAP). Sipal1 is involved in the regulation of the Ras-mediated signal transduction pathway for cell proliferation and cell cycle progression [26]. These genes could be involved in signaling pathways that lead to cell proliferation, but their potential role in malignant transformation remains unknown.
Differentially expressed genes associated with NF-κB and tumor necrosis factor pathways
One of the transcripts observed to be most differentially expressed when comparing normal tissue with DCIS was NFKBIA (better known as IκBα), demonstrating a 150-fold higher expression (P < 0.0001) in normal mammary epithelial cells (Table 2 and Fig. 1b). NFKBIA is a member of IκB family genes that play a critical role in regulating the activity of the NF-κB transcription factor [27,28]. NF-κB plays a major role in diverse biological processes such as cell proliferation, differentiation, apoptosis and metastasis [29,30]. NF-κB is also required to prevent cell death induced by tumor necrosis factor (TNF) [31].
Interestingly, and perhaps pointing to connected pathways and related outcomes, we also detected a strong decrease in the expression levels of TNFRSF10 (29-fold; P < 0.0003), LITAF/PIG7 (29-fold; P < 0.0003) and TNFAIP3 (eightfold; P < 0.0083) transcripts in the DCIS group. The protein encoded by TNFRSF10, also known as TRAIL/APO2, is a member of the TNF-receptor superfamily and contains an intracellular death domain. This receptor can be activated by TNF-related apoptosis inducing ligand and its role is to transduce apoptosis signals [32,33]. LITAF/PIG7, a transcription factor, termed lipopolysaccharide-induced TNF-alpha factor, also found downregulated, was reported to regulate TNF-alpha gene expression playing a major role in TNF-alpha activation [34]. This gene, also known as P53-induced gene 7 (PIG7), has been shown to be induced by p53 when apoptosis is triggered, and therefore could also play a role in programmed cell death [35]. The concerted decline of these transcripts early in breast tumor progression appears conducive to a virtual silencing of apoptosis induction pathways and a consequential net increase in cell proliferation. In other words, the homeostasis of proliferation cell death normally operating in the breast epithelium is altered and inclined towards a net gain in cell numbers via multiple signaling pathways.
Global comparison of in situ and invasive carcinomas
We found 149 transcripts differentially expressed between DCIS and IDC at P < 0.01. All of these genes were found overexpressed commonly at the invasive stage (Fig. 2). Table 2 summarizes the 52 most commonly overexpressed genes in invasive carcinoma lesions. We defined and classified the 149 genes differentially expressed in 10 functional categories [13] as shown in Fig. 3b. Interestingly, we found that 37% of these upregulated transcripts are related to the cell cycle (12%), extracellular matrix or secreted proteins (13%), cell adhesion and motility (6%), and signal transduction (6%).
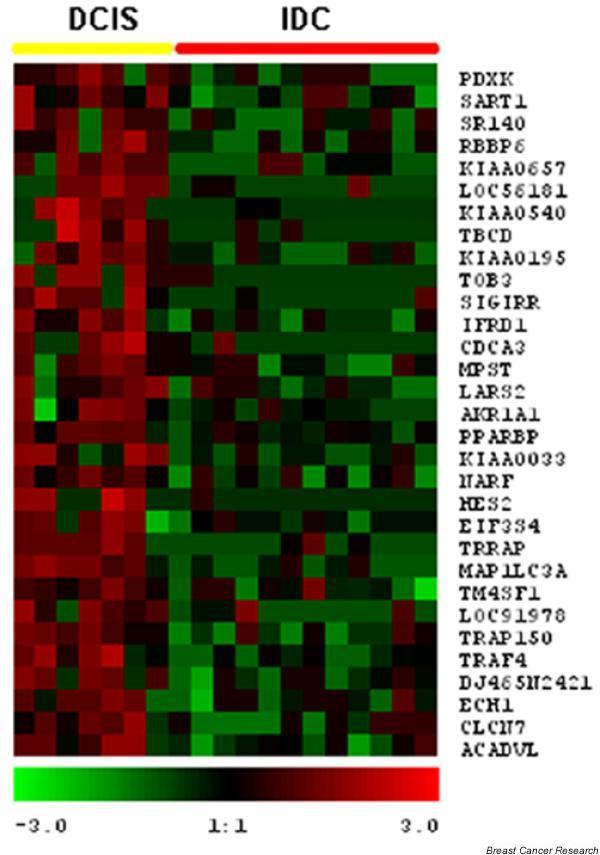
We were also able to detect 31 underexpressed genes in invasive carcinomas when compared with DCIS, but only when the stringency of the statistical comparison was dropped to within the 95% confidence interval (i.e. P < 0.05), reflecting a lower level of consistency in these gene expression changes when comparing DCIS with IDC (Fig. 4). Examples of these genes include: transmembrane 4 superfamily member 1 (TM4SF1) (-26.7-fold; P = 0.04), tumor necrosis factor receptor-associated factor 4 (TRAF4) (-10.7-fold; P = 0.04), PPAR binding protein (PPARBP) (-8.2-fold; P = 0.04), aldo-keto reductase family 1 (AKR1A1) (-6.7-fold; P = 0.03), hypothetical protein dJ465N24.2.1 (-6.4-fold; P = 0.028), microtubule-associated protein 1 (MAP1LC3A) (-3.7-fold; P = 0.02) and retinoblastoma binding protein 6 (RBBP6) (-2.6-fold; P = 0.04).
Figure 4.
Hierarchical clustering of downregulated genes in invasive ductal carcinoma (IDC) (P < 0.05). Color scale at bottom of picture is used to represent expression level: low expression is represented by green, and high expression is represented by red. DCIS, ductal carcinoma in situ.
The first of these transcripts, TM4SF1, was also the most dramatically downregulated gene in DCIS when compared with normal breast libraries (-442.6-fold; P = 0.0083). The transmembrane proteins TM4SF1, also known as the tetraspanin superfamily, are implicated in diverse signal transduction events that play a role in the regulation of cell development, cell proliferation, differentiation and motility [36]. The tetraspanins are associated with adhesion receptors of the integrin family and regulate integrin-dependent cell migration [36]. In the present study, the loss in gene expression of TM4SF1, from normal breast tissue to invasive carcinomas, appears to be a common event in the progression of breast carcinomas. In addition, downregulated levels of the TRAF4 transcript could cooperate in the evolution from DCIS to invasive carcinomas. TRAF4 is a proapoptotic gene member of the TRAF family of adaptor proteins that mediate cellular signaling by binding to various members of the tumor necrosis family receptor superfamily and interleukin-1/Toll-like receptor superfamily [37]. Interestingly, a recent study showed that overexpression of TRAF4 can induce apoptosis, playing a role in p53-mediated proapoptotic signaling in response to cellular stress [38].
Differentially expressed genes related with extracellular matrix remodeling and invasion processes
During their metastatic conversion, epithelial carcinoma cells acquire the ability to invade the surrounding tissues and later disseminate to secondary organs mostly via lymphatic vessels. The metastatic process is not just a function of acquisition of novel migratory and invasive properties by the epithelial tumor cells; the surrounding stroma also plays a critical role in this process [2]. Dramatic changes take place in order to remodel the extracellular matrix environment in response to the infiltrating cancer cells (desmoplastic reaction) [39-41]. In this sense, we identified high expression levels of several transcripts that could be a reflection of the host stromal response, such as collagen 1α1, collagen 1α2, collagen 3α1, collagen 6α1, fibronectin I, fibrilli, microfibrillar-associated protein 2, and Spondin 2.
It is known that the proteolytic degradation of the extracellular matrix is more than the simple removal of a physical barrier to invasion; such processes and the increased expression of the involved genes are known to also significantly influence mechanisms controlling cell proliferation [42]. Matrix metalloproteinases are zinc-dependent endopeptidases involved in matrix degradation and tissue remodeling [43]. These endopeptidases are capable of degrading both the extracellular matrix and basement membrane, physical barriers that play important roles in preventing against expanding growth and migration of cancer cells [44]. It is therefore widely accepted that overexpression of matrix metalloproteinases is associated with cancer-cell invasion and metastasis. A member of the matrix metalloproteinase family (MMP-2) was highly expressed (29.1-fold; P = 0.0008) in IDC libraries in comparison with in situ carcinomas. MMP-2 has been shown overexpressed in various human tumors, including breast cancer [45,46].
To no surprise and as observed in other studies, we also detected significant increases in SPARC (286-fold; P = 0.0003) and a new related gene SPARC-like1 (21.7-fold; P = 0.005) among the groups of genes upregulated in invasive lesions. The SPARC gene encodes for a secreted protein acid rich in cysteines also known as osteonectin [47]. This protein is involved in a variety of diverse biological processes including tissue remodeling, cell adhesion, proliferation, differentiation, matrix synthesis/turnover, angiogenesis and tumor cell migration and invasion [47]. Overexpression of the SPARC gene has been reported associated with melanoma and metastatic carcinomas of the breast, and increased SPARC expression has been observed in conjunction with increased c-Jun and Fra-1 expression in a panel of invasive breast cancer cell lines [48].
Human SPARC-like1, also known as mast9 or hevin, is a member of the SPARC protein family. Interestingly, previous reports indicated downregulation of SPARC-like1 in prostate and colon carcinomas [49,50]. Contrary to these observations, we observed consistent high expression of this transcript across all IDC libraries. Functional assays suggest that SPARC-like1 may serve as an antagonist to cell adhesion, playing a key role in the inhibition of attachment, and may facilitate spreading of endothelial cells on fibronectin substrates [51].
Taken together, these expression profiles suggest that MMP-2, SPARC and SPARC-like1 are probably critical mediators of extracellular matrix remodeling and are all important in facilitating breast cancer invasion and progression.
Other genes commonly expressed at high levels in invasive carcinomas and of much lower expression in DCIS and normal breast tissues include lumican (LUM/LDC) (56.7-fold; P = 0.0011), versican (CSPG2) (18.2-fold; P = 0.0017), vimentin (VIM) (17.7-fold; P = 0.0014), decorin (DCN/PG2) (13.9-fold; P = 0.0007) and adlican (DKFZp564I1922) (12-fold; P = 0.0086). Lumican and decorin are members of the small leucine-rich proteoglycan family of proteins [40]. Several studies have demonstrated that small leucine-rich proteoglycan proteins can modulate cellular behavior, including cell migration and proliferation during tumor growth. Furthermore, the high expression level of lumican was associated with high tumor grade and was expressed specifically in breast cancer tissues, but not in normal breast tissues, suggesting that lumican is differentially expressed during breast tumor progression [40,52]. These findings suggest that lumican may play an important role in breast cancer growth.
Recent studies have suggested that expression of increased amounts of versican, a chondroitin sulphate proteoglycan, in neoplastic tissues may play a role in promoting tumor cell proliferation and migration [53]. Abnormal versican deposition has been observed in a number of tumor types, including breast cancer [54]. Furthermore, it has been suggested that the versican-rich extracellular matrices exert an anti-adhesive effect on cells, thus facilitating tumor-cell migration and invasion [55].
Vimentin is a type III intermediate filament normally expressed in cells of mesenchymal origin [56]. However, numerous studies have now demonstrated that vimentin can also be expressed in epithelial cells involved in physiological or pathological processes requiring epithelial cell migration [57]. Vimentin has indeed been described in migratory epithelial cells involved in embryological and organogenesis processes and tumor invasion [58]. Also, vimentin antisense transfection in vimentin-expressing breast cell lines was shown to reduce their in vitro invasiveness or migration, strongly emphasizing a functional contribution of vimentin to epithelial cell invasion/migration [59].
Conclusions
Using comprehensive gene expression profiling by means of SAGE combined with a recently developed statistical approach, we identified the most consistent and statistically significant changes occurring in breast cancer progression detected by this methodology. A comparison of the genes identified in our DCIS and IDC analysis with previous observations [11,12,14,41] revealed expected similarities. More importantly, several genes were identified in our analysis that were not previously reported or detected in other SAGE studies. This suggests that the comparative analysis we performed of normal breast tissue, DCIS and invasive carcinomas by means of the modified t test appears statistically rigorous and applicable to SAGE studies in which multiple libraries are compared.
In the present study we observed that deregulation of genes involved in the control of cell proliferation, apoptosis and mammary gland development are frequently altered at the in situ stage (Fig. 5). Meanwhile, alterations in the expression of genes related to the cell cycle and extracellular matrix remodeling (proteinases, collagenases, cysteine proteinases), and several transcripts related to cell adhesion and motility, were abundantly deregulated at the invasive carcinoma stage (Fig. 5). Additional analysis and validation of the identified genes will be required to determine the clinical value, and to determine whether they may constitute novel targets for translational research.
Figure 5.
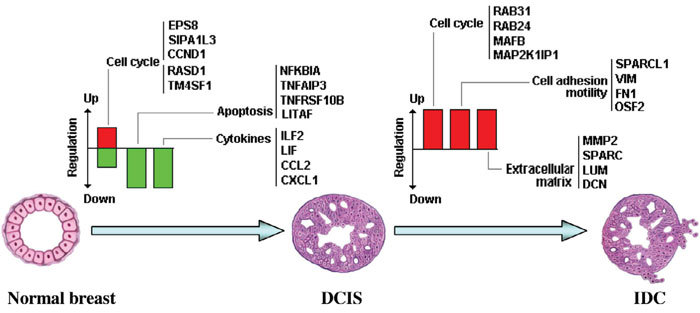
Schematic model portraying some of the most significant transcriptomic changes observed in breast cancer progression. DCIS, ductal carcinoma in situ; IDC, invasive ductal carcinoma.
Competing interests
None declared.
Abbreviations
DCIS = ductal carcinoma in situ; IDC = invasive ductal carcinoma; NF = nuclear factor; SAGE = serial analysis of gene expression; TNF = tumor necrosis factor.
Supplementary Material
Complete list of differentially expressed genes between normal breast epithelium and ductal carcinoma in situ (p < 0.05). See http://breast-cancer-research.com/content/supplementary/bcr899-s1.xls
Complete list of differentially expressed genes between ductal carcinoma in situ and invasive ductal carcinoma (p < 0.05). See http://breast-cancer-research.com/content/supplementary/bcr899-s2.xls
Acknowledgments
Acknowledgement
The authors gratefully acknowledge support from NIH-NCI Grant 1U19 CA84978.
Contributor Information
Martin C Abba, Email: mabba@mdanderson.org.
Jeffrey A Drake, Email: jdrake@mdanderson.org.
Yuhui Hu, Email: yhhu@mdanderson.org.
Hongxia Sun, Email: hsun@sprd1.mdacc.tmc.edu.
Sally Gaddis, Email: sgaddis@sbcglobal.net.
Aysegul Sahin, Email: asahin@mdanderson.org.
Keith Baggerly, Email: kabagg@odin.mdacc.tmc.edu.
C Marcelo Aldaz, Email: maldaz@odin.mdacc.tmc.edu.
References
- Greenlee RT, Murray T, Bolden S, Wingo PA. Cancer statistics. CA Cancer J Clin. 2000;50:7–33. doi: 10.3322/canjclin.50.1.7. [DOI] [PubMed] [Google Scholar]
- Berardo MD, Allred DC, O'Connell P. Breast cancer. In: Jameson JL, editor. In Principles of Molecular Medicine. Totowa, NJ: Human Press; 1998. pp. 625–632. [Google Scholar]
- Ponten J, Holmberg L, Trichopoulos D, Kallioniemi O, Kvale G, Wallgren A. Biology and natural history of breast cancer. Int J Cancer. 1990;5:5–21. doi: 10.1002/ijc.2910460703. [DOI] [PubMed] [Google Scholar]
- Charpentier A, Aldaz CM. The molecular basis of breast carcinogenesis. In: Coleman WB, Tsongalis GJ, editor. In The Molecular Basis of Human Cancer. Totowa, NJ: Human Press; 2002. pp. 347–363. [Google Scholar]
- Troup S, Njue C, Kliewer EV, Parisien M, Roskelley C, Chakravarti S, Roughley PJ, Murphy LC, Watson PH. Reduced expression of the small leucine-rich proteoglycans, Lumican, and Decorin is associated with poor outcome in node-negative breast cancer. Clin Cancer Res. 2003;9:207–214. [PubMed] [Google Scholar]
- Velculescu VE, Zhang L, Vogelstein B, Kinzler KW. Serial analysis of gene expression. Science. 1995;270:484–487. doi: 10.1126/science.270.5235.484. [DOI] [PubMed] [Google Scholar]
- Zhang L, Zhou W, Velculescu VE, Kern SE, Hruban RH, Hamilton SR, Vogelstein B, Kinzler KW. Gene expression profiles in normal and cancer cells. Science. 1997;276:1268–1272. doi: 10.1126/science.276.5316.1268. [DOI] [PubMed] [Google Scholar]
- Baggerly KA, Deng Li, Morris JS, Aldaz CM. Differential expression in Sage: accounting for normal between-library variation. Bioinformatics. 2003;19:1477–1483. doi: 10.1093/bioinformatics/btg173. [DOI] [PubMed] [Google Scholar]
- Kal AJ, van Zonneveld AJ, Benes V, vand den Berg M, Koerkamp MG, Albermann K, Strack N, Ruijter JM, Richter A, Dujon B, Ansorge W, Tabak HF. Dynamics of gene expression revealed by comparison of serial analysis of gene expression transcript profiles form yeast grown on two different carbon sources. Mol Biol Cell. 1999;10:1859–1872. doi: 10.1091/mbc.10.6.1859. [DOI] [PMC free article] [PubMed] [Google Scholar]
- Man MZ, Wang X, Wang Y. Power_Sage: comparing statistical test for SAGE experiments. Bioinformatics. 2000;16:953–959. doi: 10.1093/bioinformatics/16.11.953. [DOI] [PubMed] [Google Scholar]
- Nacht M, Ferguson AT, Zhang W, Petroziello JM, Cook BP, Gao YH, Maguire S, Riley D, Coppola G, Landes GM, Madden SL, Sukumar S. Combining serial analysis of gene expression and array technologies to identify genes differentially expressed in breast cancer. Cancer Res. 1999;59:5464–5470. [PubMed] [Google Scholar]
- Porter DA, Krop IE, Nasser S, Sgroi D, Kaelin CM, Marks JR, Riggins G, Polyak K. A SAGE (Serial Analysis of Gene Expression) view of breast tumor progression. Cancer Res. 2001;61:5697–5702. [PubMed] [Google Scholar]
- Leerkes MR, Caballero OL, Mackay A, Torloni H, O'Hare MJ, Simpson AJG, de Souza SJ. In silico comparison of the transcriptome derived from purified normal breast cells and breast tumor cell lines reveals candidate upregulated genes in breast tumor cells. Genomics. 2002;79:257–265. doi: 10.1006/geno.2002.6691. [DOI] [PubMed] [Google Scholar]
- Porter D, Lahti-Domenici J, Keshaviah A, Bae YK, Argani P, Marks J, Richarson A, Cooper A, Strausberg R, Riggins GJ, Schnitt S, Gabrielson E, Gelman R, Polyak K. Molecular markers in ductal carcinoma in situ of the breast. Mol Cancer Res. 2003;1:362–375. [PubMed] [Google Scholar]
- Trougakos IP, Gonos ES. Clusterin/apolipoprotein J in human aging and cancer. Int J Biochem Cell Biol. 2002;34:1430–1448. doi: 10.1016/S1357-2725(02)00041-9. [DOI] [PubMed] [Google Scholar]
- Zhang LY, Ying WT, Mao YS, He HZ, Liu Y, Wang HX, Liu F, Wang K, Zhang DC, Wang Y, Wu M, Qian XH. Loss of clusterin both in serum and tissue correlates with the tumorigenesis of esophageal squamous cell carcinoma via proteomics approaches. World J Gastroenterol. 2003;9:650–654. doi: 10.3748/wjg.v9.i4.650. [DOI] [PMC free article] [PubMed] [Google Scholar]
- Scaltriti M, Brausi M, Amorosi A, Caporali A, D'Arca D, Astancolle S, Corti A, Bettuzzi S. Clusterin (SGP-2, ApoJ) expression is downregulated in low- and high-grade human prostate cancer. Int J Cancer. 2004;108:23–30. doi: 10.1002/ijc.11496. [DOI] [PubMed] [Google Scholar]
- Redondo M, Villar E, Torres-Munoz J, Tellez T, Morell M, Petito CK. Overexpression of Clusterin in human breast carcinoma. Am J Pathol. 2000;157:393–399. doi: 10.1016/S0002-9440(10)64552-X. [DOI] [PMC free article] [PubMed] [Google Scholar]
- Zhang YF, Homer C, Edwards SJ, Hananeia L, Lasham A, Royds J, Sheard P, Braithwaite AW. Nuclear localization of Y-box factor YB1 requires wild-type p53. Oncogene. 2003;22:2782–2794. doi: 10.1038/sj.onc.1206357. [DOI] [PubMed] [Google Scholar]
- Dhingra K, Sahin A, Emami K, Hortobagyi GN, Estrov Z. Expression of leukemia inhibitory factor and its receptor in breast cancer: a potential autocrine and paracrine growth regulatory mechanism. Breast Cancer Res Treat. 1998;48:165–174. doi: 10.1023/A:1005942923757. [DOI] [PubMed] [Google Scholar]
- Liu J, Hadjokas N, Mosley B, Estrov Z, Spence MJ, Vestal RE. Oncostatin M-specific receptor expression and function in regulating cell proliferation of normal and malignant mammary epithelial cells. Cytokine. 1998;10:295–302. doi: 10.1006/cyto.1997.0283. [DOI] [PubMed] [Google Scholar]
- Grant SL, Douglas AM, Goss GA, Begley CG. Oncostatin M and leukemia inhibitory factor regulate the growth of normal human breast epithelial cells. Growth Factors. 2001;19:153–162. doi: 10.3109/08977190109001083. [DOI] [PubMed] [Google Scholar]
- Tocchetti A, Confalonieri S, Scita G, Di Fiore PP, Betsholtz C. In silico analysis of EPS8 gene family: genomic organization, expression profile, and protein structure. Genomics. 2003;81:234–244. doi: 10.1016/S0888-7543(03)00002-8. [DOI] [PubMed] [Google Scholar]
- Wilson PD, Geng L, Li X, Burrow CR. The PKD1 gene product, 'polycystin-1', is a tyrosine-phosphorylated protein that colocalizes with a2b1-integrin in focal clusters in adherent renal epithelia. Lab Invest. 1999;79:1311–1323. [PubMed] [Google Scholar]
- Boucher C, Sandford R. Autosomal dominant polycystic disease (ADPKD, MIM 17 PKD1 and PKD2 genes, protein products known as polycystin-1 and polycystin-2) Eur J Hum Genet. 3900;186:2309–2318. doi: 10.1038/sj.ejhg.5201162. [DOI] [PubMed] [Google Scholar]
- Wada Y, Kubota H, Maeda M, Taniwaki M, Hattori M, Imamura S, Iwai K, Minato N. Mitogen-inducible SIPA1 is mapped to the conserved syntenic group of chromosome 19 in mouse and chromosome 11q13.3 centromeric to BCL1 in human. Genomic. 1997;39:66–73. doi: 10.1006/geno.1996.4464. [DOI] [PubMed] [Google Scholar]
- May MJ, Ghosh MS. Rel/NF-kB and IkB proteins: an overview. Cancer Biol. 1997;8:63–73. doi: 10.1006/scbi.1997.0057. [DOI] [PubMed] [Google Scholar]
- Curran JE, Weinstein SR, Griffiths LR. Polymorphic variants of NFKB1 and its inhibitory protein NFKBIA, and their involvement in sporadic breast cancer. Cancer Lett. 2002;188:103–107. doi: 10.1016/S0304-3835(02)00460-3. [DOI] [PubMed] [Google Scholar]
- Barkett M, Gilmore TD. Control of apoptosis by Rel/NF-kappaB transcription factors. Oncogene. 1999;18:6910–6924. doi: 10.1038/sj.onc.1203238. [DOI] [PubMed] [Google Scholar]
- Silverman N, Maniatis T. NF-kappaB signaling pathways in mammalian and insect innate immunity. Genes Dev. 2001;15:2321–2342. doi: 10.1101/gad.909001. [DOI] [PubMed] [Google Scholar]
- Nakshatri H, Bhat-Nakshatri P, Martin DA, Goulet RJ, Jr, Sledge GW., Jr Constitutive activation of NF-kB during progression of breast cancer to hormone-independent growth. Mol Cell Biol. 1997;17:3629–3639. doi: 10.1128/mcb.17.7.3629. [DOI] [PMC free article] [PubMed] [Google Scholar]
- Kim EJ, Suliman A, Lam A, Srivastava RK. Failure of BCL-2 to block mitochondrial dysfunction during TRAIL-induced apoptosis. Tumor necrosis-related apoptosis-inducing ligand. Int J Oncol. 2001;18:187–194. [PubMed] [Google Scholar]
- Singh TR, Shankar S, Chen X, Asim M, Srivastava RK. Synergistic interactions of chemotherapeutic drug and tumor necrosis factor related apoptosis-inducing ligand/Apo-2 ligand on apoptosis and on regression of breast carcinomas in vivo. Cancer Res. 2003;63:5390–5400. [PubMed] [Google Scholar]
- Myokai F, Takashiba S, Lebo R, Amar S. A novel lipopolysaccharide-induce transcription factor regulating tumor necrosis factor alpha gene expression: molecular cloning, sequencing, characterization, and chromosomal assignment. Proc Natl Acad Sci USA. 1999;96:4518–4523. doi: 10.1073/pnas.96.8.4518. [DOI] [PMC free article] [PubMed] [Google Scholar]
- Polyak K, Xia Y, Zweier JL, Kinzler KW, Vogelstein B. A model for p53-induced apoptosis. Nature. 1997;389:300–305. doi: 10.1038/38525. [DOI] [PubMed] [Google Scholar]
- Berditchevski F. Complex of tetraspanins with integrins: more than meets the eye. J Cell Science. 2001;114:4143–4151. doi: 10.1242/jcs.114.23.4143. [DOI] [PubMed] [Google Scholar]
- Chung JY, Park YC, Ye H, Wu H. All TRAFs are not created equal: common and distinct molecular mechanisms of TRAF-mediated signal transduction. J Cell Sci. 2002;115:679–688. doi: 10.1242/jcs.115.4.679. [DOI] [PubMed] [Google Scholar]
- Sax JK, El-Deiry WS. Identification and characterization of the cytoplasmic protein TRAF4 as a p53-regulated proapoptotic gene. J Biol Chem. 2003;278:36435–36444. doi: 10.1074/jbc.M303191200. [DOI] [PubMed] [Google Scholar]
- Peyrol S, Raccurt M, Gerard F, Gleyzal C, Grimaud JA, Sommer P. Lysyl oxidase gene expression in the stromal reaction to in situ and invasive ductal breast carcinoma. Am J Pathol. 1997;150:497–507. [PMC free article] [PubMed] [Google Scholar]
- Leygue E, Snell L, Dotzlaw H, Troup S, Hiller-Hitchcok T, Murphy LC, Roughley PJ, Watson PH. Lumican and decorin are differentially expressed in human breast carcinomas. J Pathol. 2000;192:313–320. doi: 10.1002/1096-9896(200011)192:3<313::AID-PATH694>3.3.CO;2-2. [DOI] [PubMed] [Google Scholar]
- Iacobuzio-Donahue CA, Argani P, Hempen PM, Jones J, Kern SE. The desmoplastic response to infiltrating breast carcinoma: gene expression at the site of primary invasion and implications for comparisons between tumor types. Cancer Res. 2002;62:5351–5357. [PubMed] [Google Scholar]
- Henriet P, Blavier L, Declerck YA. Tissue inhibitors of metalloproteinases (TIMP) in invasion and proliferation. Acta Pathol Microbiol Immuno Scandinavica. 1999;107:111–119. doi: 10.1111/j.1699-0463.1999.tb01533.x. [DOI] [PubMed] [Google Scholar]
- Egeblad M, Werb Z. New functions for the matrix metalloproteinases in cancer progression. Nat Rev Cancer. 2002;2:161–174. doi: 10.1038/nrc745. [DOI] [PubMed] [Google Scholar]
- Stamenkovic I. Matrix metalloproteinases in tumor invasion and metastasis. Semin Cancer Biol. 2000;10:415–433. doi: 10.1006/scbi.2000.0379. [DOI] [PubMed] [Google Scholar]
- Jones JL, Glynn P, Walker RA. Expression of MMP-2 and MMP-9, their inhibitors, and the activator MT1-MMP in primary breast carcinomas. J Pathol. 1999;189:161–168. doi: 10.1002/(SICI)1096-9896(199910)189:2<161::AID-PATH406>3.0.CO;2-2. [DOI] [PubMed] [Google Scholar]
- Garbett EA, Reed MW, Brown NJ. Proteolysis in human breast and colorectal cancer. Br J Cancer. 1999;81:287–293. doi: 10.1038/sj.bjc.6690689. [DOI] [PMC free article] [PubMed] [Google Scholar]
- Francki A, Bradshaw AD, Bassuk JA, Howe CC, Couser WG, Sage EH. SPARC regulates the expression of collagen type I and transforming growth factor-beta 1 in mesangial cells. J Biol Chem. 1999;274:32145–32152. doi: 10.1074/jbc.274.45.32145. [DOI] [PubMed] [Google Scholar]
- Zajchowski DA, Bartholdi MF, Gong Y, Webster L, Liu HL, Munishkin A, Beauheim C, Harvey S, Ethier SP, Johnson PH. Identification of gene expression profiles that predict the aggressive behavior of breast cancer cells. Cancer Res. 2001;61:5168–5178. [PubMed] [Google Scholar]
- Nelson PS, Plymate SR, Wang K, True LD, Ware JL, Gan L, Liu AY, Hood L. Hevin, an antiadhesive extracellular matrix protein, is down-regulated in metastatic prostate adenocarcinoma. Cancer Res. 1998;58:232–236. [PubMed] [Google Scholar]
- Isler SG, Schenk S, Bendik I, Schraml P, Novotna H, Moch H, Sauter G, Ludwig CU. Genomic organization and chromosomal mapping of SPARC-like 1, a gene down regulated in cancers. Int J Oncol. 2001;18:521–526. doi: 10.3892/ijo.18.3.521. [DOI] [PubMed] [Google Scholar]
- Hambrock HO, Nitsche DP, Hansen U, Bruckner P, Paulsson M, Maurer P, Hartmann U. SC1/Hevin: an extracellular calcium-modulated protein that binds collagen I. J Biol Chem. 2003;278:11351–11358. doi: 10.1074/jbc.M212291200. [DOI] [PubMed] [Google Scholar]
- Leygue E, Snell L, Dotzlaw H, Hole K, Hiller-Hitchcock T, Roughley PJ, Watson PH, Murphy LC. Expression of lumican in human breast carcinoma. Cancer Res. 1998;58:1348–1352. [PubMed] [Google Scholar]
- Evanko SP, Angello JC, Wight TN. Formation of hyaluronan- and versican-rich pericellular matrix is required for proliferation and migration of vascular smooth muscle cells. Arterioscler Thromb Vasc Biol. 1999;19:1004–1013. doi: 10.1161/01.atv.19.4.1004. [DOI] [PubMed] [Google Scholar]
- Ricciardelli C, Brooks JH, Suwiwata S, Sakko AJ, Mayne K, Raymond WA, Seshadri R, LeBaron RG, Horsfall DJ. Regulation of stromal versican expression by breast cancer cells and importance to relapse-free survival in patients with node-negative primary breast cancer. Clin Cancer Res. 2002;8:1054–1060. [PubMed] [Google Scholar]
- Yamagata M, Suzuki S, Akiyama SK, Yamada KM, Kimata K. Regulation of cell-substrate adhesion by proteoglycans immobilized on extracellular substrate. J Biol Chem. 1989;264:8012–8018. [PubMed] [Google Scholar]
- Steinert PM, Roop DR. Molecular and cellular biology of intermediate filaments. Annu Rev Biochem. 1988;57:593–625. doi: 10.1146/annurev.bi.57.070188.003113. [DOI] [PubMed] [Google Scholar]
- Gilles C, Polette M, Zahm JM, Tournier JM, Volders L, Foidart JM, Birembaut P. Vimentin contributes to human mammary epithelial cell migration. J Cell Sci. 1999;112:4615–4625. doi: 10.1242/jcs.112.24.4615. [DOI] [PubMed] [Google Scholar]
- Gilles C, Polette M, Mestdagt M, Nawrocki-Raby B, Ruggeri P, Birembaut P, Foidart J. Transactivation of vimentin by B-catenin in human breast cancer cells. Cancer Res. 2003;63:2658–2664. [PubMed] [Google Scholar]
- Hendrix MJ, Seftor EA, Seftor RE, Trevor KT. Experimental coexpression of vimentin and keratin intermediate filaments in human breast cancer cells results in phenotypic interconversion and increased invasive behavior. Am J Pathol. 1997;150:483–495. [PMC free article] [PubMed] [Google Scholar]
Associated Data
This section collects any data citations, data availability statements, or supplementary materials included in this article.
Supplementary Materials
Complete list of differentially expressed genes between normal breast epithelium and ductal carcinoma in situ (p < 0.05). See http://breast-cancer-research.com/content/supplementary/bcr899-s1.xls
Complete list of differentially expressed genes between ductal carcinoma in situ and invasive ductal carcinoma (p < 0.05). See http://breast-cancer-research.com/content/supplementary/bcr899-s2.xls